Abstract
This paper asks whether the period shown by a crossover of two moving averages is a property of the market or something produced by the choice of the two periods — the answer is the latter. It claims neither a new mathematical theorem nor a new law.
First, holding the ratio at 4.0 and multiplying both periods by 8 moves the median crossing interval divided by the slow period only from 0.650 to 0.653, a factor of 1.005. If the market carried a period of its own, the same quantity would move by a factor of 8.00 (Section 3).
Second, and this is the core of the paper, holding the slow period at 80 and moving only the ratio from 16 to 2 moves the same quantity from 0.247 to 0.731, a factor of 2.962. The only thing changed is the ratio (Section 3).
Third, the median crossing interval of the 20/80 pair is 53.0 bars in all four series. The spread across series is 0.0 bars (Section 4).
Fourth, the same measurement on a synthetic random walk (the cumulative sum of independent normal increments) gives 0.625 for 20/80. Across all eleven cells the median difference from the measured value is 0.035 and the maximum is 0.050 (Section 5).
Fifth, multiplying the size of the random-walk increments by 100 changes the resulting value by 0.000000. The crossing interval is scale invariant (Section 6).
Sixth, however, in all eleven cells the measured value lies on the longer side of the random walk, with a median ratio of 1.060. This paper does not explain that offset (Section 7).
Scope of this paper (scope note): No new mathematical theorem and no new law are claimed — simple moving averages, their crossovers, and random walks are all known. No particular product or proponent is discussed — no real course, author, or vendor is the subject here, and none is named. What is treated is only the general quantity "the interval between crossovers of two simple moving averages." Trading is not discussed — this paper measures the interval only. Whether that interval yields a profit is not addressed. The scope is intraday and a small number of instruments — four series, six years, one-hour bars. Nothing is said about all markets or all time scales. In particular, this paper does not contradict results documented at longer holding periods, such as monthly time-series momentum. No forecast is claimed — no method for predicting when the next crossover will occur is proposed. Relation to earlier papers: Paper 191 showed that when two smoothings of different speed are combined the length is built from the coefficients and the container never appears — this paper stands beside it and measures whether the same thing happens to crossovers in a market. Paper 264 showed that a threshold belongs to its lattice — here the "period" belongs to the periods one chose. Paper 82 and Paper 427 treated the act of dividing time itself — the lattice here is fixed at one-hour bars. Paper 422 showed that removing the condition named as the core of a rule does not move the result — this paper works one step earlier, on the quantity the rule is said to see. What is added here is writing the predictions before measuring, across three families, placing a synthetic random-walk baseline beside the measurement under the same procedure, checking scale invariance to 0.000000, and reporting the residual offset as 11 out of 11 with a median of 1.060.
1. Notation and the question
Consider two simple moving averages, the faster with period f and the slower with period s, where f is smaller than s. A crossover is a change of sign of the difference (fast moving average minus slow moving average). The interval between consecutive crossovers is counted in bars.
Of moving-average crossovers it is often said that "this pair captures waves of about N bars." That phrasing presumes that the N is something on the side of the market.
Question: is that N set by the market, or by the choice of f and s?
Observation 1.1: f and s carry two degrees of freedom: the absolute size (how long they are) and the ratio (s divided by f, how far apart they are). These can be moved independently.
Observation 1.2: so the question can be settled. Build one family that moves only the absolute size and another that moves only the ratio, and see which one the interval follows.
2. Writing the two predictions before measuring
Prediction A (the ratio makes it): the interval is proportional to the slow period. Therefore, holding the ratio fixed and multiplying the absolute size by k multiplies the interval by k as well, and the interval divided by the slow period stays constant.
Prediction B (the market carries a period): the market has an intrinsic period T and the interval settles onto it. Therefore multiplying the absolute size by k leaves the interval unchanged, and the interval divided by the slow period is divided by k.
The two make opposite predictions. That is why the question settles.
Design (declared before running and unchanged at run time)
| Pairs (fast, slow) | What moves | |
|---|---|---|
| Family 1 | (5,20) (10,40) (20,80) (40,160) | ratio fixed at 4.0, absolute size ×8 |
| Family 2 | (8,20) (20,50) (40,100) | ratio fixed at 2.5, absolute size ×5 |
| Family 3 | (5,80) (10,80) (20,80) (40,80) | slow period fixed at 80, ratio 16 → 2 |
The quantity measured is the median interval between consecutive crossovers. Bars are one-hour, mid price, closing value of completed bars only (the last tick in the bar). Because the test uses completed bars only, no look-ahead is involved. The instruments are USDJPY, EURUSD, GBPUSD and XAUUSD, over the six years 2019–2024.
Observation 2.1: Families 1 and 2 separate Prediction A from Prediction B. Family 3 moves only the ratio, so if the ratio is what matters, it should move a great deal there. The third family is there to check the answer the first two give.
3. Measurement
The bar counts are 36,534 for USDJPY, 36,554 for EURUSD, 36,535 for GBPUSD and 34,892 for XAUUSD.
Calculation 3.1 Family 1 — ratio 4.0 fixed, absolute size ×8
| Fast | Slow | Ratio | USDJPY | EURUSD | GBPUSD | XAUUSD | Median / slow | Crossings |
|---|---|---|---|---|---|---|---|---|
| 5 | 20 | 4.0 | 13.0 | 13.0 | 13.0 | 13.0 | 0.650 | 9,090 |
| 10 | 40 | 4.0 | 26.0 | 25.0 | 27.0 | 27.0 | 0.656 | 4,387 |
| 20 | 80 | 4.0 | 53.0 | 53.0 | 53.0 | 53.0 | 0.662 | 2,202 |
| 40 | 160 | 4.0 | 104.0 | 105.0 | 104.0 | 105.0 | 0.653 | 1,129 |
The absolute size is multiplied by 8. Prediction A gives a factor of 1.00, Prediction B a factor of 8.00.
The measured value goes from 0.650 to 0.653, a factor of 1.005.
Calculation 3.2 Family 2 — ratio 2.5 fixed, absolute size ×5
| Fast | Slow | Ratio | USDJPY | EURUSD | GBPUSD | XAUUSD | Median / slow | Crossings |
|---|---|---|---|---|---|---|---|---|
| 8 | 20 | 2.5 | 14.0 | 14.0 | 15.0 | 14.0 | 0.713 | 8,208 |
| 20 | 50 | 2.5 | 38.0 | 36.0 | 38.0 | 37.0 | 0.745 | 3,118 |
| 40 | 100 | 2.5 | 72.0 | 78.0 | 77.0 | 70.0 | 0.743 | 1,558 |
The absolute size is multiplied by 5, so Prediction B would give a factor of 5.00. The measured factor is 1.042.
Calculation 3.3 Family 3 — slow period fixed at 80, only the ratio moves
| Fast | Slow | Ratio | USDJPY | EURUSD | GBPUSD | XAUUSD | Median / slow | Crossings |
|---|---|---|---|---|---|---|---|---|
| 5 | 80 | 16.0 | 19.0 | 20.0 | 20.0 | 20.0 | 0.247 | 3,699 |
| 10 | 80 | 8.0 | 35.5 | 30.5 | 34.0 | 36.0 | 0.425 | 2,846 |
| 20 | 80 | 4.0 | 53.0 | 53.0 | 53.0 | 53.0 | 0.662 | 2,202 |
| 40 | 80 | 2.0 | 58.0 | 59.0 | 61.0 | 56.0 | 0.731 | 1,952 |
The slow period never moves from 80. The value still moves from 0.247 to 0.731, a factor of 2.962.
Observation 3.4: in Families 1 and 2 a factor of 5 to 8 in absolute size produces a factor of 1.005 to 1.042. In Family 3 a factor of 2.962 appears without the absolute size moving at all. What moves the interval is the ratio, not the absolute size.
Calculation 3.5 Sorting by ratio
Sorting all eleven cells by ratio brings cells from different families to the same place.
| Ratio | Cells | Min | Max | Spread |
|---|---|---|---|---|
| 2.0 | 1 | 0.731 | 0.731 | 0.000 |
| 2.5 | 3 | 0.713 | 0.745 | 0.032 |
| 4.0 | 5 | 0.650 | 0.662 | 0.012 |
| 8.0 | 1 | 0.425 | 0.425 | 0.000 |
| 16.0 | 1 | 0.247 | 0.247 | 0.000 |
Observation 3.6: the five cells at ratio 4.0 come from both Family 1 and Family 3. Their periods span a factor of 8, from (5,20) to (40,160), yet the spread is only 0.012.
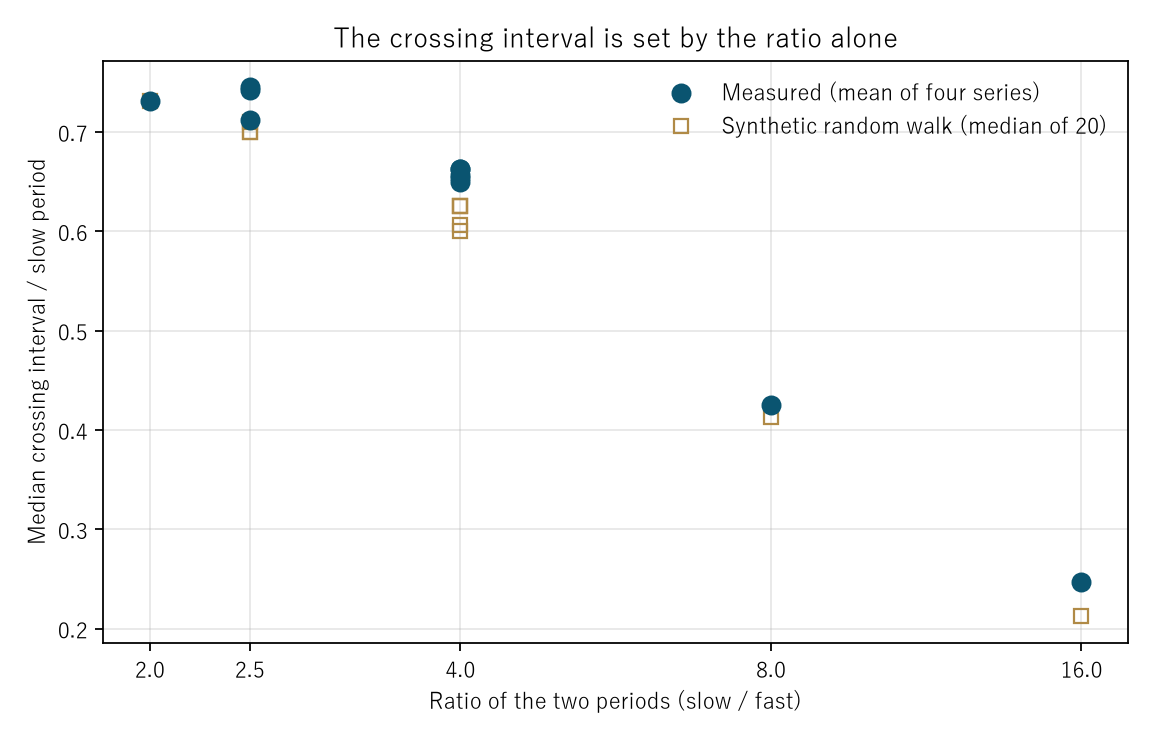
Figure 1: the horizontal axis is the ratio, the vertical axis the median crossing interval divided by the slow period. All eleven cells gather by the value of the ratio. The open squares are the synthetic random walk of Section 5.
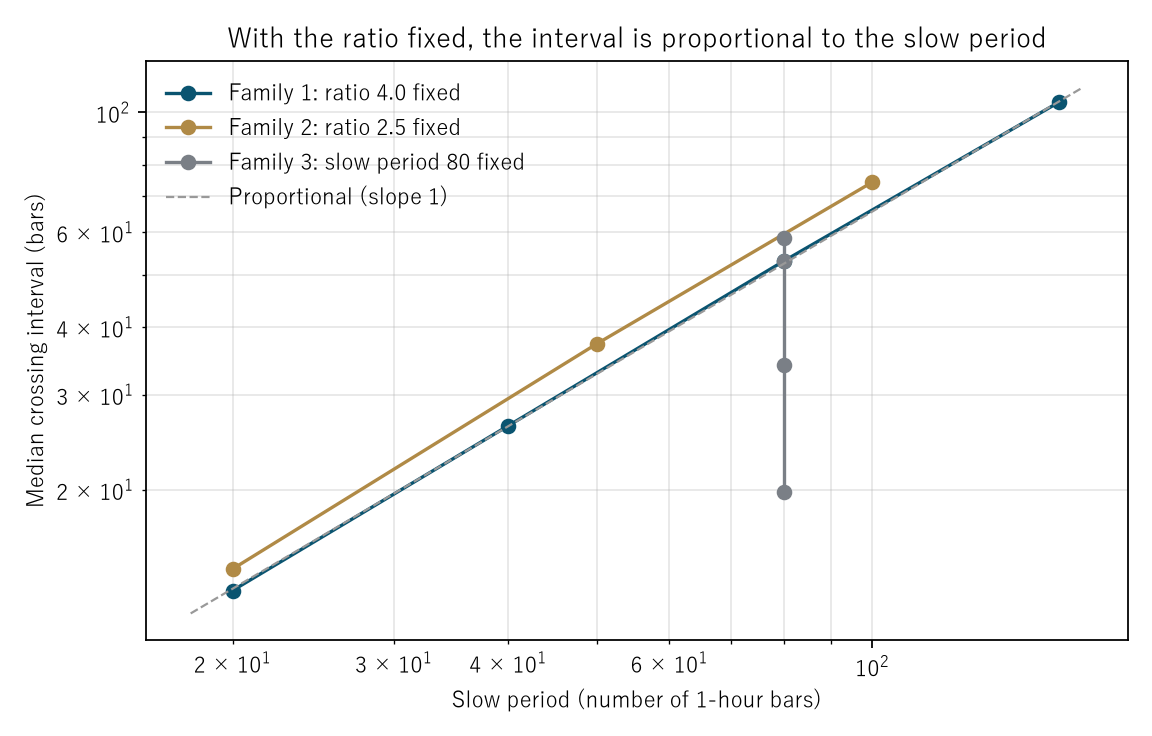
Figure 2: log–log. Families 1 and 2 fall on straight lines of slope 1 (proportionality). Family 3 becomes a vertical line at 80 on the horizontal axis — with the same slow period, four different ratios give four different intervals.
4. The four series agree
Calculation 4.1: opening the 20/80 cell by instrument.
| Instrument | Median interval | Crossings |
|---|---|---|
| USDJPY | 53.0 bars | 549 |
| EURUSD | 53.0 bars | 554 |
| GBPUSD | 53.0 bars | 572 |
| XAUUSD | 53.0 bars | 527 |
The spread across the four is 0.0 bars.
Observation 4.2: these four differ in the size of their moves, in the hours when they trade, and in who trades them. The same 53.0 bars comes out all the same. If the market side were setting the number, there would be no reason for four series to agree.
Observation 4.3: the median is taken over integer intervals, so this agreement at 53.0 includes a discretisation effect. The possibility that four values happened to land on the same integer cannot be excluded. It is not written here that it can be. The baseline of the next section shows, however, that such agreement also occurs for a random walk.
5. Baseline — a synthetic random walk gives the same values
So far only "the ratio makes it" has been shown. But is the remaining dependence on the ratio a property of the market? To see this, the same measurement is made on a series that is not a market.
Design (also declared before running): series formed by cumulating independent normal increments, of length 36,500 bars (close to the real data), in 20 realisations (seeds fixed at 0 through 19). The same three families, the same quantity.
Calculation 5.1 Measurement and random walk side by side
| Family | Fast | Slow | Measured | Random walk | Difference | Ratio |
|---|---|---|---|---|---|---|
| 1 | 5 | 20 | 0.650 | 0.600 | 0.050 | 1.083 |
| 1 | 10 | 40 | 0.656 | 0.625 | 0.031 | 1.050 |
| 1 | 20 | 80 | 0.662 | 0.625 | 0.037 | 1.060 |
| 1 | 40 | 160 | 0.653 | 0.606 | 0.047 | 1.077 |
| 2 | 8 | 20 | 0.713 | 0.700 | 0.013 | 1.018 |
| 2 | 20 | 50 | 0.745 | 0.710 | 0.035 | 1.049 |
| 2 | 40 | 100 | 0.743 | 0.700 | 0.043 | 1.061 |
| 3 | 5 | 80 | 0.247 | 0.212 | 0.034 | 1.162 |
| 3 | 10 | 80 | 0.425 | 0.412 | 0.013 | 1.030 |
| 3 | 20 | 80 | 0.662 | 0.625 | 0.037 | 1.060 |
| 3 | 40 | 80 | 0.731 | 0.731 | 0.000 | 1.000 |
The median absolute difference is 0.035 and the maximum is 0.050.
Observation 5.2: on the random-walk side as well, Family 1 moves from 0.600 to 0.606 (a factor of 1.010) and Family 2 from 0.700 to 0.700 (a factor of 1.000), while Family 3 moves from 0.212 to 0.731, a factor of 3.441. The shape of all three families is reproduced.
Observation 5.3: a synthetic random walk has no trend, no session hours, no participants and no news. The same shape appears anyway. Therefore the fact that the interval does not move in Families 1 and 2 and does move in Family 3 says nothing about the market. It is a property of the operation of subtracting two smoothings.
Observation 5.4: this baseline is consistent with the conclusion of Paper 191, where the length appearing from a combination of two smoothings was built from the coefficients and the container never appeared. The "container" here is the market, and it does not appear.
6. Scale invariance
Calculation 6.1: setting the standard deviation of the random-walk increments to 1.0 and to 100.0 and measuring the same eleven cells.
The maximum difference in the median-over-slow quantity is 0.000000.
Observation 6.2: multiplying the size of the moves by 100 does not change the crossing interval by a single bar. A moving average is linear, so multiplying the series by a constant multiplies the difference of the two averages by the same constant, and the points where the sign changes do not move.
Observation 6.3: therefore the adjustment "volatility is high, so use shorter settings" does nothing to the crossing interval. What sets the interval is f and s alone.
7. The residual offset — what this paper does not explain
Calculation 7.1: the difference between measurement and random walk is positive in all eleven cells (by chance one would expect 5.5). The median ratio is 1.060, the minimum 1.000 and the maximum 1.162.
Calculation 7.2: whether that offset lies inside the realisation-to-realisation spread of the random walk. Counting how often the measured value falls between the minimum and the maximum of the 20 realisations gives 9 of 11 cells inside. Two fall outside.
| Family | Fast | Slow | Measured | RW min | RW max | Inside |
|---|---|---|---|---|---|---|
| 2 | 20 | 50 | 0.745 | 0.660 | 0.740 | no |
| 3 | 5 | 80 | 0.247 | 0.200 | 0.237 | no |
Observation 7.3: it therefore cannot be written that the measurement is indistinguishable from a random walk. The sign agrees 11 times out of 11, and two cells fall outside the spread of 20 realisations. Crossing intervals in the market are systematically longer than those of a random walk, with a median ratio of 1.060.
Observation 7.4: this paper does not explain that offset. A reading in which positive autocorrelation in the increments makes sign changes less frequent and stretches the interval is available, but it has not been measured here. What has not been measured is not written as measured.
Observation 7.5: and the size of the offset is a factor of 1.060. Compared with the factor of 2.962 produced by moving the ratio in Section 3, it is an order of magnitude apart. Almost all of the interval is made by the ratio; what the market adds sits outside it, and it is small.
8. Limitations
- Only one lattice is used. Bars are fixed at one hour. Whether the same shape appears under other bar constructions is not measured here (this is the axis treated in Paper 82 and Paper 427).
- Only simple moving averages. Exponential and weighted moving averages carry different smoothing weights and therefore different coefficients. It cannot be written that the conclusion carries over.
- Only the median of the interval is examined. The shape of the distribution — its tail, its dispersion — is not measured.
- Trading is not discussed. The interval is measured; whether it yields a profit is not addressed.
- The synthetic baseline uses independent normal increments. The heavy tails and volatility clustering of real price moves are not included. It is the simplest possible baseline.
- Four instruments over six years. Nothing is said about other markets or other periods.
Conclusion
The phrase "this pair captures waves of about 53 bars" turns out, on measurement, to be a restatement of having chosen 20 and 80. The 53.0 bars is common to all four instruments, and a synthetic random walk gives 50.0. Multiplying both periods by 8 while holding the ratio fixed moves the quantity by a factor of 1.005; moving the ratio while holding the periods fixed moves it by 2.962.
One thing separates the cases — whether what was moved is the absolute size or the ratio.
And what this paper could measure is the interval alone. Whether that interval carries directional information is a different question, and it is not answered here.
Data and reproduction
| Data | Currency ticks from Dukascopy (agreement to the millisecond, bid and ask, verified from 2019 onward). Gold from Dukascopy |
| Period | 2019–2024 (six years) |
| Instruments | USDJPY, EURUSD, GBPUSD, XAUUSD |
| Bars | One hour, mid price, closing value of completed bars only |
| Verification | 検算/F001.py (with --zu it also writes the figures). Every number in the text is taken from 検算/F001_output.txt |
| Figures | 図/F001_zu1, 図/F001_zu2 (png, svg, English versions) |
| Random seeds | Fixed at 0–19. Re-running gives the same values |
References
- Yamagishi, Y. (2026). The Thing That Smooths Is What Makes the Pattern [Paper 191]. Zenodo. 10.5281/zenodo.22106439
- Yamagishi, Y. (2026). Inside One Phenomenon Live a Number That Moves with the Lattice and a Number That Does Not [Paper 264]. Zenodo. 10.5281/zenodo.22169720
- Yamagishi, Y. (2026). The Condition Named as the Core of a Rule Does Nothing [Paper 422]. Zenodo. 10.5281/zenodo.22700081
- Yamagishi, Y. (2026). Time Measured in Events Does Not Line Up with Time Measured on a Clock [Paper 427]. Zenodo. 10.5281/zenodo.22700235
Reference
Yamagishi, Y. (2026). The Period a Moving-Average Crossover Finds Is Made by the Ratio of the Two Periods [F001]. Zenodo.
DOI: 10.5281/zenodo.22880428
YOI: https://www.yamagishiyuuki.com/yoi/F001
ORCID: 0009-0006-8587-3450
PDF (English) · PDF (Japanese) · Date proof of the English PDF (OpenTimestamps .ots) · SHA256SUMS
The record page for this paper (in Japanese, with the PDFs in each language and the date proof): YOI F001. This paper is a preprint and has not been peer reviewed.