Abstract
This paper asks what moves and what does not when the multiplier of a Bollinger band is changed — the answer is that how often price leaves the band moves by a factor of thirty, and the direction never settles anywhere. It claims neither a new mathematical theorem nor a new law.
First, at the standard setting (period 20, multiplier 2.0), the mean of the daily means is negative in all 8 cases, and it disagrees in sign with the overall mean in 5 of the 8. The median number of observations per day is 3.0 (Section 3).
Second, and this is the core of the paper, raising the multiplier from 1.0 to 3.0 cuts the count to 0.0335 of itself. The directional information spans a range of 4.3252 pips over that move, yet the standard 2.0 is the best of five in only 1 of 8 cases, and the best multiplier agrees between the selection and evaluation periods in 0 of the 4 series (Section 4).
Third, against the normal-distribution figure of 4.55% outside two standard deviations, the measured figure is 13.4769%, a factor of 2.9620. But a synthetic random walk with no heavy tails already gives 11.5897%, a factor of 2.1388 (Section 7).
Fourth, only a factor of 1.1628 can therefore be attributed to the tails. Moreover at multipliers 1.0 and 1.5 the measured series leaves the band less often (0.9426 and 0.9406); the tails begin to matter at 2.5 and reach 6.6768 at 3.0 (Section 7).
Fifth, splitting by the width of the band — a quantity that grows the same way upward and downward — is not monotone in any of the four series (Section 6).
Sixth, splitting into five non-overlapping sessions, the daily-clustered t reaches 2 in absolute value in 2 of the 20 cells. By chance about 0.9 would be expected, and both are negative (Section 8).
Scope of this paper (scope note): No new mathematical theorem and no new law is claimed — moving averages, rolling standard deviations and random walks are all known. No particular product or proponent is discussed — no real course, author, or vendor is the subject here, and none is named. What is treated is the public indicator itself. Trading is not discussed — what is measured is directional information, not trading performance including commissions, fills and money management. The scope is intraday and a small number of instruments — four series, six years, one-hour bars. Nothing is said about all markets or all time scales. In particular, this paper does not contradict results documented at longer holding periods, such as monthly time-series momentum. Only the trend-following reading is measured — the mean-reverting reading is the same signal with its sign flipped, so its directional information is the same number with its sign flipped. One is measured and the other is read off. No forecast is claimed — no method for predicting future prices from the band is proposed. Relation to earlier papers: Paper 264 showed that a threshold belongs to its lattice — here the multiplier belongs to the period and the bars one chose. Paper 422 showed that removing the condition named as the core of a rule does not move the result — this paper applies that shape to the scale of an indicator. Paper 423 showed that a wrong conclusion can come from correct parts — the normal-distribution figure is correct; what errs is using it as the baseline. F002 of this series showed that changing the forward shift of the Ichimoku cloud does not change the answer — this paper measures the same shape on another scale, the multiplier of a band. What is added here is declaring the multiplier as the separator in advance and measuring it at five values, placing the normal figure, a synthetic random walk and the measurement side by side so the source of the departure from normality can be separated, and splitting into five non-overlapping sessions with the denominator of the multiple comparison reported alongside.
1. Notation and the question
A Bollinger band is built from three lines.
| Line | Definition |
|---|---|
| Centre | simple moving average of the last n closes |
| Upper band | centre + k × standard deviation of the last n closes |
| Lower band | centre − k × standard deviation of the last n closes |
Here n is the period and k the multiplier. The common choice is n = 20 and k = 2.0, of which it is said that "leaving the band is rare". The content of that word rare comes from the 4.55% of a normal distribution.
Observation 1.1: two roles are mixed into k: how rare an event is selected, and whether the direction is right when it occurs. These are different quantities, and one may move while the other does not.
Observation 1.2: raising k must reduce the count. Because it must, the reduction is not information in itself. What is to be read is whether the direction improves in exchange.
Question: when the multiplier is moved, what moves and what does not?
2. Writing the quantity and the design in advance
The quantity measured is directional information.
```
D = mean( sign of the signal × the price move over the next h bars ) in pips
```
The signal is +1 (buy) when price is above the upper band, −1 (sell) when below the lower band, and 0 (do nothing) between them. This is the trend-following reading.
Observation 2.1: the mean-reverting reading (sell above, buy below) is this signal with its sign flipped. Its directional information is therefore the same number with its sign flipped. So one is measured and the other is read off. The two are not measured and the better one chosen.
Design (declared before running and unchanged at run time)
| Item | Decision |
|---|---|
| Bars | one hour, mid price, closing value of completed bars only (the last tick in the bar) |
| Instruments | USDJPY, EURUSD, GBPUSD, XAUUSD |
| Period | 2019–2024. Selection 2019–2021 / evaluation 2022–2024 (the evaluation period is never used for selection) |
| Horizon | h = n (one period ahead) |
| Separator | the multiplier k = 1.0, 1.5, 2.0, 2.5, 3.0 |
| Period n | 10, 20, 50 (standard is 20) |
| Cost | the median spread of the same bars is always reported alongside |
| Mean | both the overall mean and the mean of the daily means are reported |
Observation 2.2: this paper does not measure with an exit that cuts at a take-profit or a stop-loss, because which side was touched first within a bar is not determined by the bar's high and low.
The bar counts are 36,534 for USDJPY, 36,554 for EURUSD, 36,535 for GBPUSD and 34,892 for XAUUSD.
3. Measuring at the standard setting
Calculation 3.1 Period 20, multiplier 2.0
| Instrument | Period | Count | D (overall mean) | Dd (daily mean) | Daily t | Per day | spr |
|---|---|---|---|---|---|---|---|
| USDJPY | selection | 2,391 | 2.9255 | −1.9918 | −1.54 | 3.0 | 0.30 |
| USDJPY | evaluation | 2,310 | 8.2906 | −3.0631 | −1.09 | 3.0 | 0.60 |
| EURUSD | selection | 2,605 | −0.7991 | −4.4607 | −4.27 | 3.0 | 0.30 |
| EURUSD | evaluation | 2,489 | −2.5100 | −7.6099 | −5.58 | 3.0 | 0.30 |
| GBPUSD | selection | 2,709 | 0.3716 | −6.7302 | −3.73 | 4.0 | 0.80 |
| GBPUSD | evaluation | 2,468 | −1.2035 | −7.9907 | −4.15 | 3.0 | 0.80 |
| XAUUSD | selection | 2,231 | 16.9158 | −12.7621 | −2.54 | 3.0 | 3.37 |
| XAUUSD | evaluation | 2,293 | 8.5412 | −14.8270 | −2.82 | 3.0 | 3.43 |
Observation 3.2: the mean of the daily means is negative in all 8 cases. It disagrees in sign with the overall mean in 5 of the 8; those five are set in bold.
Observation 3.3: the median number of observations per day is 3.0. When days with few and days with many are mixed, the days with many pull the overall mean hard. For USDJPY in the evaluation period the overall mean is 8.2906 while the daily mean is −3.0631: the sign changes.
Observation 3.4: this is not a question of which one is right. To know what a single occurrence is worth, the overall mean; to know what a day is worth, the daily mean. They are two different quantities, and there is no correct way to write them other than both.
Observation 3.5: the absolute value of the overall mean exceeds the spread in all four series (4 / 4). Yet the daily-clustered t never exceeds 1.54 on the positive side; it reaches significance only on the negative side. Significance on the negative side concerns betting against the trend-following reading. This paper does not recommend it. The mean-reverting side fails to settle in exactly the same way once the multiplier is moved, as Section 4 shows.
4. Moving the multiplier — this is the separator
The multiplier k is moved through 1.0, 1.5, 2.0, 2.5 and 3.0, with everything else held the same.
Calculation 4.1 The multiplier, the count and the directional information (evaluation period)
| Instrument | k=1.0 | k=1.5 | k=2.0 | k=2.5 | k=3.0 |
|---|---|---|---|---|---|
| USDJPY count | 9,632 | 5,293 | 2,310 | 835 | 245 |
| USDJPY D | 4.4920 | 5.1570 | 8.2906 | 10.5912 | 16.5180 |
| EURUSD count | 9,267 | 5,200 | 2,489 | 1,002 | 333 |
| EURUSD D | −1.2602 | −2.0476 | −2.5100 | −2.9278 | 2.2075 |
| GBPUSD count | 9,289 | 5,136 | 2,468 | 986 | 308 |
| GBPUSD D | −0.6788 | −1.1642 | −1.2035 | −1.0493 | 2.2821 |
| XAUUSD count | 9,192 | 5,110 | 2,293 | 879 | 312 |
| XAUUSD D | 4.1868 | 4.1424 | 8.5412 | 13.2720 | 9.9579 |
Calculation 4.2: comparing how the count and the directional information move.
| Instrument | Period | Count ratio (k=3 ÷ k=1) | Range of D | spr |
|---|---|---|---|---|
| USDJPY | selection | 0.0269 | 3.5151 | 0.30 |
| USDJPY | evaluation | 0.0254 | 12.0260 | 0.60 |
| EURUSD | selection | 0.0319 | 1.0010 | 0.30 |
| EURUSD | evaluation | 0.0359 | 5.1353 | 0.30 |
| GBPUSD | selection | 0.0338 | 1.0258 | 0.80 |
| GBPUSD | evaluation | 0.0332 | 3.4857 | 0.80 |
| XAUUSD | selection | 0.0338 | 11.4073 | 3.37 |
| XAUUSD | evaluation | 0.0339 | 9.1296 | 3.43 |
Observation 4.3: raising the multiplier from 1.0 to 3.0 cuts the count to a median of 0.0335 of itself (from 0.0254 to 0.0359). About one thirtieth. The proportion is nearly the same in all eight cases, so this is a property of cutting the outside off a near-normal distribution, not a property of the market.
Observation 4.4: the directional information spans a median range of 4.3252 pips over that move (from 1.0010 to 12.0260). The spread runs from 0.30 to 3.43, so the range exceeds the cost. The single act of choosing the multiplier can manufacture an apparent difference larger than the cost.
Observation 4.5: yet the standard 2.0 is the best of five in only 1 of the 8 cases. Choosing at random among five would give 1.6, so the measured figure is below chance.
Observation 4.6: and the best multiplier agrees between the selection and evaluation periods in 0 of the 4 series. The range is wide and the destination never settles. This is not information but room to choose.
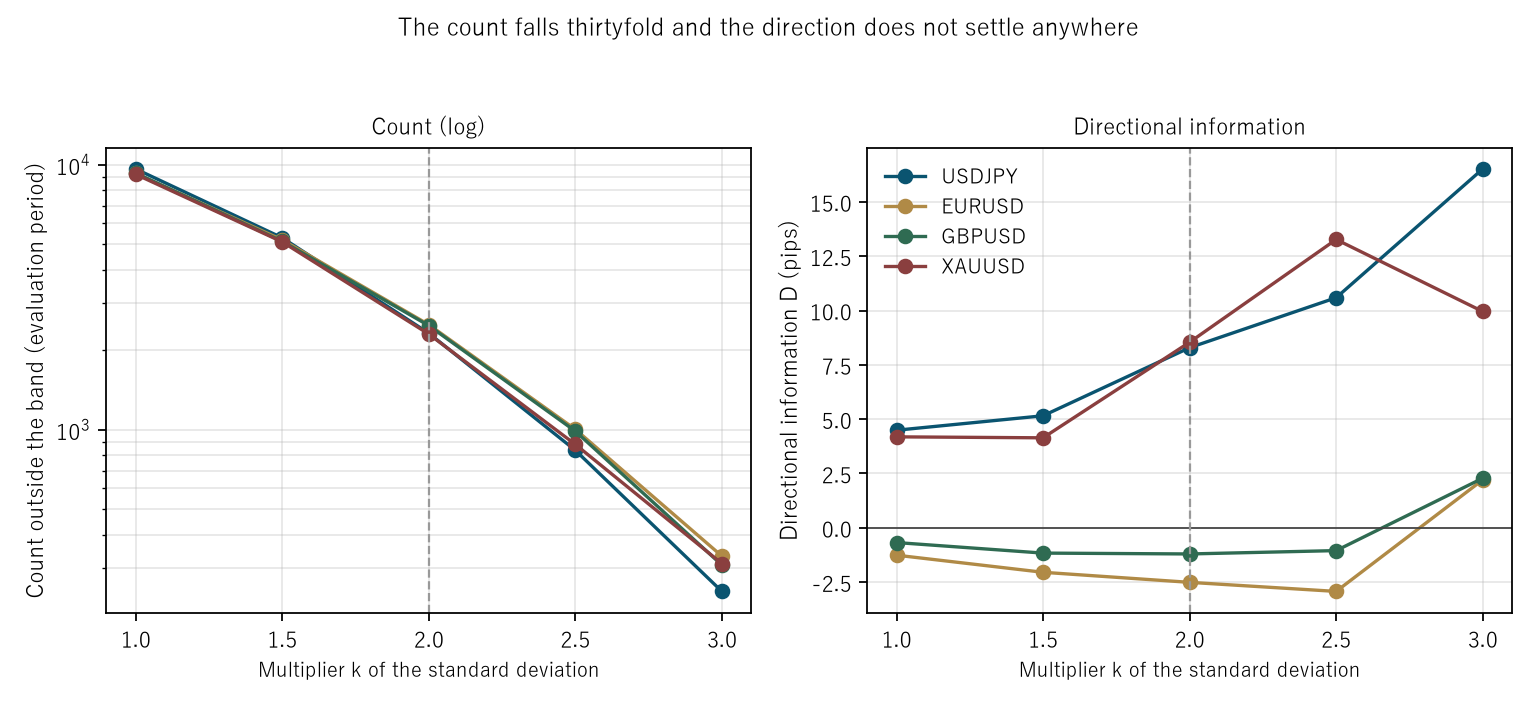
Figure 1: the count on the left (logarithmic) and the directional information on the right. The dashed line marks the standard 2.0. On the left all four series fall straight with the same slope; on the right they move in different directions.
5. Comparing with moving the period
The period n can be chosen as well as the multiplier. Holding the multiplier at 2.0, n is moved.
Calculation 5.1 Moving the period (evaluation period, multiplier fixed at 2.0)
| Instrument | n=10 count | n=10 D | n=20 count | n=20 D | n=50 count | n=50 D |
|---|---|---|---|---|---|---|
| USDJPY | 1,849 | 3.5112 | 2,310 | 8.2906 | 2,651 | 1.1580 |
| EURUSD | 1,969 | −1.0660 | 2,489 | −2.5100 | 2,421 | −7.0110 |
| GBPUSD | 1,940 | −1.7177 | 2,468 | −1.2035 | 2,425 | −4.2383 |
| XAUUSD | 1,796 | 3.4732 | 2,293 | 8.5412 | 2,603 | 4.5215 |
Observation 5.2: moving the period moves not only the count but the horizon as well (since h = n). So this is not a comparison in which one thing was moved, as Section 4 was. When two or more things move, which of them acted cannot be stated.
Observation 5.3: something can still be read. Multiplying n by five, from 10 to 50, moves the count only from 1,849 to 2,651 for USDJPY and from 1,969 to 2,421 for EURUSD. Set against the multiplier cutting the count to one thirtieth, the period barely moves the count at all. What sets the count is the multiplier.
6. Splitting by a quantity without direction
Calculation 6.1 Splitting by the width of the band into quintiles (evaluation period)
| Instrument | Q1 (narrow) | Q2 | Q3 | Q4 | Q5 (wide) | Monotone? |
|---|---|---|---|---|---|---|
| USDJPY | 12.1123 | 10.3721 | 8.5104 | 4.8736 | 5.5830 | not monotone |
| EURUSD | −1.6066 | −0.2769 | 0.1564 | −7.8912 | −2.9500 | not monotone |
| GBPUSD | −2.8968 | 3.4584 | −1.1705 | −4.0611 | −1.3354 | not monotone |
| XAUUSD | 8.1930 | 13.0206 | 18.0371 | 11.6947 | −8.2117 | not monotone |
Observation 6.2: the width of the band grows the same way upward and downward: it is a quantity without direction. Splitting by a quantity without direction cannot, in principle, order directional information. That none of the four came out monotone is consistent with that expectation.
Observation 6.3: USDJPY does fall monotonically from Q1 to Q4 (12.1123 to 4.8736). One of four lining up part of the way is not rare by chance. Monotonicity is judged on all five points.
7. Where does "4.55% outside two standard deviations" go wrong?
The claim that leaving the band is rare rests on a normal-distribution figure: 4.5500% at a multiplier of 2.0 and 0.2700% at 3.0. What is measured?
Calculation 7.1 The normal figure, a synthetic random walk and the measurement, side by side
The synthetic series are built with independent normal increments down to the movement inside each bar (seeds fixed at 0 to 4). Their tails are not heavy. Only the fact that the mean and the standard deviation are estimated in a moving window is kept the same as the measurement.
| k | 1: normal figure | 2: random walk | 3: measured | 3÷1 | 3÷2 | 2÷1 |
|---|---|---|---|---|---|---|
| 1.0 | 31.7311% | 55.5055% | 52.3201% | 1.6489 | 0.9426 | 1.7492 |
| 1.5 | 13.3614% | 31.0242% | 29.1817% | 2.1840 | 0.9406 | 2.3219 |
| 2.0 | 4.5500% | 11.5897% | 13.4769% | 2.9620 | 1.1628 | 2.5472 |
| 2.5 | 1.2419% | 2.6562% | 5.2760% | 4.2483 | 1.9863 | 2.1388 |
| 3.0 | 0.2700% | 0.2630% | 1.7561% | 6.5042 | 6.6768 | 0.9741 |
Observation 7.2: the ratio of measurement to normal figure has a median of 2.9620. Stopping here invites the reading that the tails of the market are heavier than normal.
Observation 7.3: but a random walk with no heavy tails already gives 2.1388 times the normal figure. The centre and the width are estimated from the same 20 bars, so price leaves a band it built itself more easily. This has nothing to do with tails.
Observation 7.4: what can be attributed to the tails is the ratio of measurement to random walk. Its median is only 1.1628. Of the factor of 2.9620, a factor of 2.1388 comes from how the estimate is made.
Observation 7.5: looking closer, at multipliers 1.0 and 1.5 the measured series leaves the band less often (0.9426 and 0.9406). The tails begin to act at 2.5 (1.9863) and reach 6.6768 at 3.0. "The tails are heavy" holds or fails depending on the multiplier.
Observation 7.6: this check concerns how often price leaves the band and says nothing about direction. Heavy tails and a correct direction are different things.
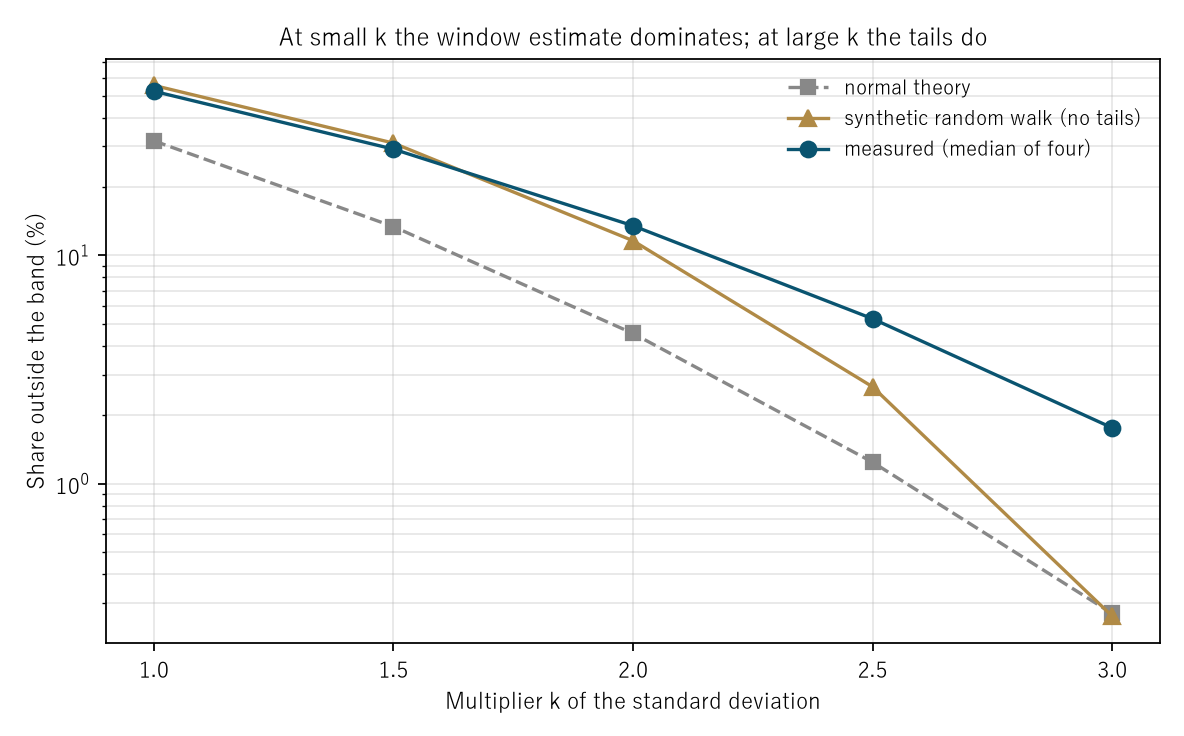
Figure 2: the vertical axis is logarithmic. The dashed line is the normal figure, the triangles the synthetic random walk, the circles the measurement. At the left end the random walk and the measurement nearly coincide; they separate at the right.
Calculation 7.7 The baseline on the directional side (evaluation period, period 20, multiplier 2.0)
| Instrument | Measured D | Median random D | Random minimum | Random maximum | Inside? |
|---|---|---|---|---|---|
| USDJPY | 8.2906 | −0.6392 | −6.6683 | 3.3975 | no |
| EURUSD | −2.5100 | −0.5007 | −4.5645 | 2.2158 | yes |
| GBPUSD | −1.2035 | −0.6678 | −6.5850 | 3.3351 | yes |
| XAUUSD | 8.5412 | −0.8058 | −16.4605 | 10.3403 | yes |
Observation 7.8: in 3 of the 4 series the measured value falls inside the range of the 20 realisations. The one outside is USDJPY. That judgement, however, uses the overall mean; the daily mean for the same USDJPY is −3.0631, a negative number (Calculation 3.1). Whether it falls outside depends on which mean is read.
8. Splitting by session
"Were the sessions separated?" is the first question this kind of result meets.
Design: five non-overlapping bins in Coordinated Universal Time — Tokyo 0–7, London 7–12, overlap 12–16, late New York 16–21, and night 21–24.
Observation 8.1: bins must not overlap. Placing overlapping bins side by side creates places whose contents are the same as their neighbour's, and something will look good somewhere.
Calculation 8.2 Directional information in each of the five bins (evaluation period)
| Instrument | Tokyo 0–7 | London 7–12 | Overlap 12–16 | NY late 16–21 | Night 21–24 |
|---|---|---|---|---|---|
| USDJPY | 9.58 (t −0.66) | 7.59 (t 0.04) | 6.32 (t 0.01) | 11.01 (t 0.20) | 8.83 (t 1.23) |
| EURUSD | −4.53 (t −1.07) | −3.31 (t −1.89) | −0.17 (t −2.53) | −4.96 (t −1.66) | 0.00 (t −0.26) |
| GBPUSD | −3.05 (t −0.90) | −0.28 (t −1.17) | −0.01 (t −2.31) | −3.90 (t −1.77) | −2.96 (t −0.05) |
| XAUUSD | 25.96 (t 1.16) | 12.06 (t 0.61) | 5.57 (t −1.37) | 7.57 (t −0.85) | −54.51 (t −1.66) |
Observation 8.3: the daily-clustered t reaches 2 in absolute value in 2 of the 20 cells. By chance about 0.9 would be expected, so the measured figure is somewhat above that.
Observation 8.4: both are in the overlap session, for EURUSD and GBPUSD, and both are negative. Moreover the directional information itself is −0.17 and −0.01, far smaller than the spread (0.30 and 0.80). A t that stands up while the amount is tiny means the dispersion in that bin is small.
Observation 8.5: what is read is not the individual cell. Trying five bins and finding one that looks significant is the ordinary case. What is read is whether the number of significant cells exceeds chance. Two against 0.9 is neither clearly more nor clearly less.
9. Limitations
- The measurement uses a fixed horizon. It does not use an exit that cuts at a take-profit or a stop-loss, because which side was touched first within a bar is not determined by the high and the low.
- Only one lattice is used. Bars are fixed at one hour. Whether the same shape appears on daily or five-minute bars is not measured.
- Only the trend-following reading is measured. The mean-reverting reading is read off by flipping the sign, but readings that cannot be written as a sign flip — such as waiting for price to return after touching the band — are not treated.
- The comparison across periods moves two things at once. The period and the horizon move together, so which of them acted is not separated (Observation 5.2).
- The synthetic baseline uses independent normal increments. Volatility clustering is not included. Part of the gap from the measurement may come from there, but that has not been measured.
- The session bins are fixed in Coordinated Universal Time. The market's own boundaries shift by an hour under daylight saving, and this paper does not follow them.
- Four instruments over six years. Nothing is said about other markets or other periods.
Conclusion
Raising the multiplier cuts the count to one thirtieth. That happens reliably. But the direction did not improve in exchange. The standard 2.0 was best in only 1 of 8 cases, and the best position failed to agree across periods in all four series.
And "4.55% outside two standard deviations" is wrong. Most of the reason it is wrong, however, is not the tails of the market but that the centre and the width are estimated from the same 20 bars. Only a factor of 1.1628 can be attributed to the tails, and at small multipliers the measured series in fact leaves the band less often.
One thing separates the cases — when the multiplier moved, was it the rarity that moved or the accuracy? Only the rarity moved.
And what this paper could measure is the form that enters at the moment price leaves the band. About the reading that waits for price to return, nothing is answered here.
Data and reproduction
| Data | Currency ticks from Dukascopy (agreement to the millisecond, bid and ask, verified from 2019 onward). Gold from Dukascopy |
| Period | 2019–2024 (six years). Selection 2019–2021 / evaluation 2022–2024 |
| Instruments | USDJPY, EURUSD, GBPUSD, XAUUSD |
| Bars | One hour, mid price, closing value of completed bars only. Bars with no ticks are not created |
| Verification | 検算/F003.py (with --zu it also writes the figures). Every number in the text is taken from 検算/F003_output.txt |
| Figures | 図/F003_zu1, 図/F003_zu2 (png, svg, English versions) |
| Random seeds | Fixed at 0–19 (0–4 in Calculation 7.1). Re-running gives the same values |
| Audit of the foundation | _ツール/audit_bars.py (look-ahead in the bars, daylight saving, the day boundary). The record is _土台の検査.txt |
References
- Yamagishi, Y. (2026). Inside One Phenomenon Live a Number That Moves with the Lattice and a Number That Does Not [Paper 264]. Zenodo. 10.5281/zenodo.22169720
- Yamagishi, Y. (2026). The Condition Named as the Core of a Rule Does Nothing [Paper 422]. Zenodo. 10.5281/zenodo.22700081
- Yamagishi, Y. (2026). The Table Is Right and the Trade Still Loses [Paper 423]. Zenodo. 10.5281/zenodo.22700114
- Yamagishi, Y. (2026). The Ichimoku Cloud Is a Past Drawn Twenty-Six Bars Ahead [F002]. Zenodo. 10.5281/zenodo.22880552
Reference
Yamagishi, Y. (2026). The Multiplier of a Bollinger Band Changes How Often Price Leaves It, Not Which Way Price Goes [F003]. Zenodo.
DOI: 10.5281/zenodo.22881085
YOI: https://www.yamagishiyuuki.com/yoi/F003
ORCID: 0009-0006-8587-3450
PDF (English) · PDF (Japanese) · Date proof of the English PDF (OpenTimestamps .ots) · SHA256SUMS
The record page for this paper (in Japanese, with the PDFs in each language and the date proof): YOI F003. This paper is a preprint and has not been peer reviewed.