Abstract
Using the Vital Statistics tables by month of death (2024, condensed list), by age (2024, three-character list), and by year (1995–2024, three-character list), the monthly pattern, items, and age pattern of deaths from accidental suffocation were lined up. It claims no new mathematical theorem and no new law.
First, the tables are consistent. The 2024 total of accidental suffocation, 8,186, is the same in the monthly, three-character, and yearly tables, and in the three-character table (W75-W84) = the sum of nine items (at every age and sex) (Section 3).
Second, daily deaths from accidental suffocation are highest in January (31.9) and lowest in June (17.1) (maximum ÷ minimum 1.86). Of the five compared (suffocation, drowning, falls, transport accidents, all causes), only suffocation has more deaths in January than in December, with January ÷ December at 1.138 (Section 4).
Third, 0.535 of suffocation deaths in 2024 are W79 (inhalation and ingestion of food causing obstruction of the respiratory tract), and the three inhalation items W78, W79, and W80 make up 0.928 (Section 5).
Fourth, from 2016 to 2017, W80 (inhalation and ingestion of other objects causing obstruction of the respiratory tract) went from 819 to 2,475 (3.022-fold) and W84 (unspecified threat to breathing) from 2,170 to 339 (0.156-fold), but their sum went from 2,989 to 2,814 (0.941-fold), hardly moving. Among W80's year-to-year ratios for 2014–2024, the largest is 2016 to 2017 (Section 6).
Fifth, this is the core of the paper. The suffocation rate (per 100,000) rises at every step from 1.01 at 45–49 to 136.78 at 100+ and forms no peak. This differs from bathtub drowning, which peaks at 85–89 (M069). Of suffocation deaths, 0.899 are at 65+ (Section 7).
Sixth, what separates them is the month, age, and under which item a death is counted. The "movement" in suffocation numbers mixes the monthly and age patterns with a change in how items are counted.
Scope note: This paper claims no new mathematical theorem and no new law — the death counts are in public tables, and this paper only lined them up by month, item, and age. This paper is a structural interpretation of the shape of numbers in public aggregate data; it is not medical advice, not a diagnosis, and not a treatment recommendation. The author is not a physician. Decisions about individual health should be discussed with a physician or a medical institution. This is a preprint that has not been peer reviewed. It does not go into how or what people eat, how care is given, or how to prevent accidents. The tables do not name foods, and neither does this paper. Why the monthly pattern arises cannot be separated with these tables. There is no three-character × month table, so the monthly pattern is for suffocation as a whole. Which change in how death records are written or in classification rules produced the 2017 swap between W80 and W84 cannot be separated with these tables. It does not blame those who lost family members or those who give care. Prefectures are not compared. It is not written as an outlook for any one person. About the data: the Vital Statistics (e-Stat) are used under the Government Standard Terms of Use (Version 2.0), and the ratios in this paper were created by processing them. What this paper adds: showing, from the same year's tables, that among five causes only accidental suffocation has its monthly peak in January, that the 2017 swap between W80 and W84 hardly moves their sum, and that the rate keeps rising up to 100+, a different shape from bathtub drowning.
1. Notation and question
- Suffocation: accidental suffocation (condensed code 20104 = three-character W75–W84).
- Three-character items: W75 accidental suffocation and strangulation in bed, W76 other accidental hanging and strangulation, W77 threat to breathing due to cave-in, falling earth and other substances, W78 inhalation of gastric contents, W79 inhalation and ingestion of food causing obstruction of the respiratory tract, W80 inhalation and ingestion of other objects causing obstruction of the respiratory tract, W81 confined to or trapped in a low-oxygen environment, W83 other specified threats to breathing, and W84 unspecified threat to breathing.
- Daily: monthly deaths ÷ days in the month (in 2024, February has 29 days). January and December both have 31 days, so January ÷ December equals the ratio of deaths.
- Rate: per 100,000 population. The population is back-calculated from the 2024 deaths ÷ death rate × 100,000 in Volume 1 Table 5.15 (5-year groups).
Question: What shape do suffocation deaths take by month and by age? Are the yearly movements affected by the item under which deaths are counted?
Observation 1.1: M069 showed that bathtub drowning leans toward winter and that its rate peaks at 85–89. M041 showed that with the 2017 partial revision of the cause-of-death classification, deaths moved between items. This paper applies the same measures to suffocation.
2. Survey and design
To be honest: the design was decided after seeing the tables.
| Content | |
|---|---|
| Tables | Vital Statistics 2024, Volume 2 Table 3 (condensed × month of death) and Table 1-1 (three-character × 5-year age), and Volume 1 Table 5.30 (three-character × year) and Table 5.15 (back-calculating the population) |
| Noticed in the survey | (1) Only suffocation had more deaths in January than December. (2) In the yearly table, W80 jumped and W84 dropped in 2017 |
| Measures | Daily max ÷ min and January ÷ December, item shares, the sum W80 + W84, and age-specific rates and doubling years |
| Not written | Names of foods (not in the tables) |
3. Data and checks
Calculation 3.1 The 4 retrieved files were fixed by SHA-256, and the following was checked.
- Table 3: month headings are total and January–December. For the five causes, total = sum of 12 months and men + women = total.
- Table 1-1: age headings are total, single years 0–4, 0–4, 20 five-year groups, and unknown. (W75-W84) = the sum of the nine three-character items (at every age and sex), every row has total = sum of ages + unknown, and men + women = total.
- The 2024 suffocation total, 8,186, is the same in Table 3, Table 1-1, and Table 5.30, and W78, W79, W80, and W84 in Table 5.30 match the same items in Table 1-1.
4. The monthly pattern — only suffocation peaks in January
Calculation 4.1 Daily deaths (2024)
| Cause | Highest month | Daily | Lowest month | Daily | Max ÷ min | Jan ÷ Dec |
|---|---|---|---|---|---|---|
| Accidental suffocation | January | 31.9 | June | 17.1 | 1.86 | 1.138 |
| Accidental drowning | December | 55.7 | September | 8.5 | 6.53 | 0.906 |
| Falls | December | 40.2 | June | 26.4 | 1.52 | 0.941 |
| Transport accidents | December | 11.6 | March | 7.7 | 1.51 | 0.834 |
| All causes | December | 5069.1 | June | 3889.0 | 1.30 | 0.989 |
Observation 4.2: Of the five, only accidental suffocation has its daily maximum in January and more deaths in January than December (January 988, December 868). The other four peak in December, with January ÷ December at 0.834–0.989. Suffocation in December–February is 2,566 (0.313 of the year) and in June–August 1,720 (0.210).
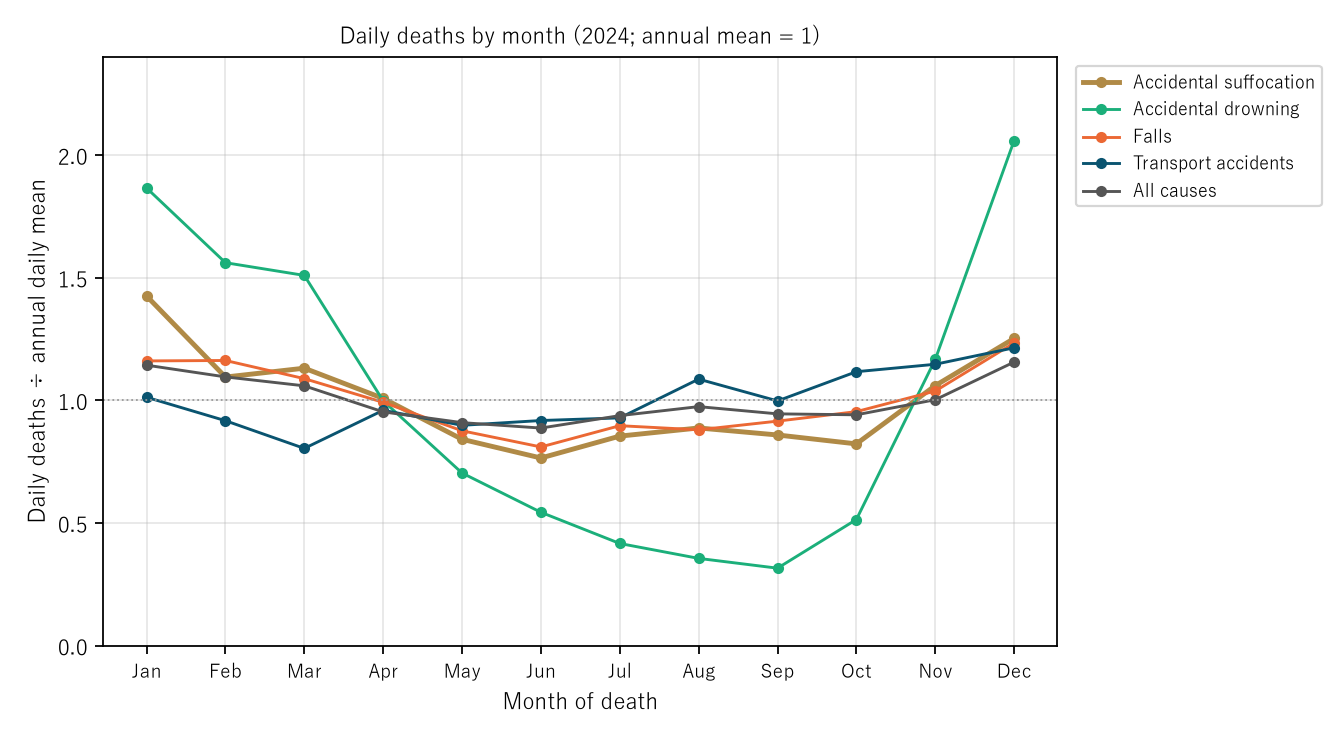
Figure 1: Daily deaths by month in 2024, divided by that cause's annual daily average. Gold (thick) is accidental suffocation, green accidental drowning, orange falls, navy transport accidents, and gray all causes. The dotted line is 1.
5. Items
Calculation 5.1 Three-character items of suffocation in 2024
| Item | Deaths | Share of suffocation |
|---|---|---|
| W79 inhalation of food | 4,383 | 0.535 |
| W80 inhalation of other objects | 1,978 | 0.242 |
| W78 inhalation of gastric contents | 1,236 | 0.151 |
| W84 unspecified threat to breathing | 417 | 0.051 |
| W75, W76, W77, W81, W83 combined | 172 | 0.021 |
Observation 5.2: The largest item is W79 at 0.535, and the three inhalation items W78, W79, and W80 make up 0.928.
6. W80 and W84 in 2017
Calculation 6.1 Items by year (Table 5.30)
| Item | 2014 | 2015 | 2016 | 2017 | 2018 | 2024 |
|---|---|---|---|---|---|---|
| W79 inhalation of food | 4,874 | 4,686 | 4,870 | 4,739 | 4,604 | 4,383 |
| W80 inhalation of other objects | 855 | 739 | 819 | 2,475 | 2,405 | 1,978 |
| W84 unspecified | 2,253 | 2,166 | 2,170 | 339 | 350 | 417 |
| W80 + W84 | – | – | 2,989 | 2,814 | – | – |
Observation 6.2: From 2016 to 2017, W80 rose 3.022-fold and W84 fell to 0.156, but their sum moved only to 0.941. W80 ÷ (W80 + W84) went from 0.274 to 0.880. Among W80's year-to-year ratios for 2014–2024, the largest is 2016 to 2017, while W79 moved 0.973-fold that year. 2017 was the year of the partial revision of the classification (M041), and within suffocation the count moved from "unspecified" to "other objects." Which rule change caused it cannot be separated with these tables.
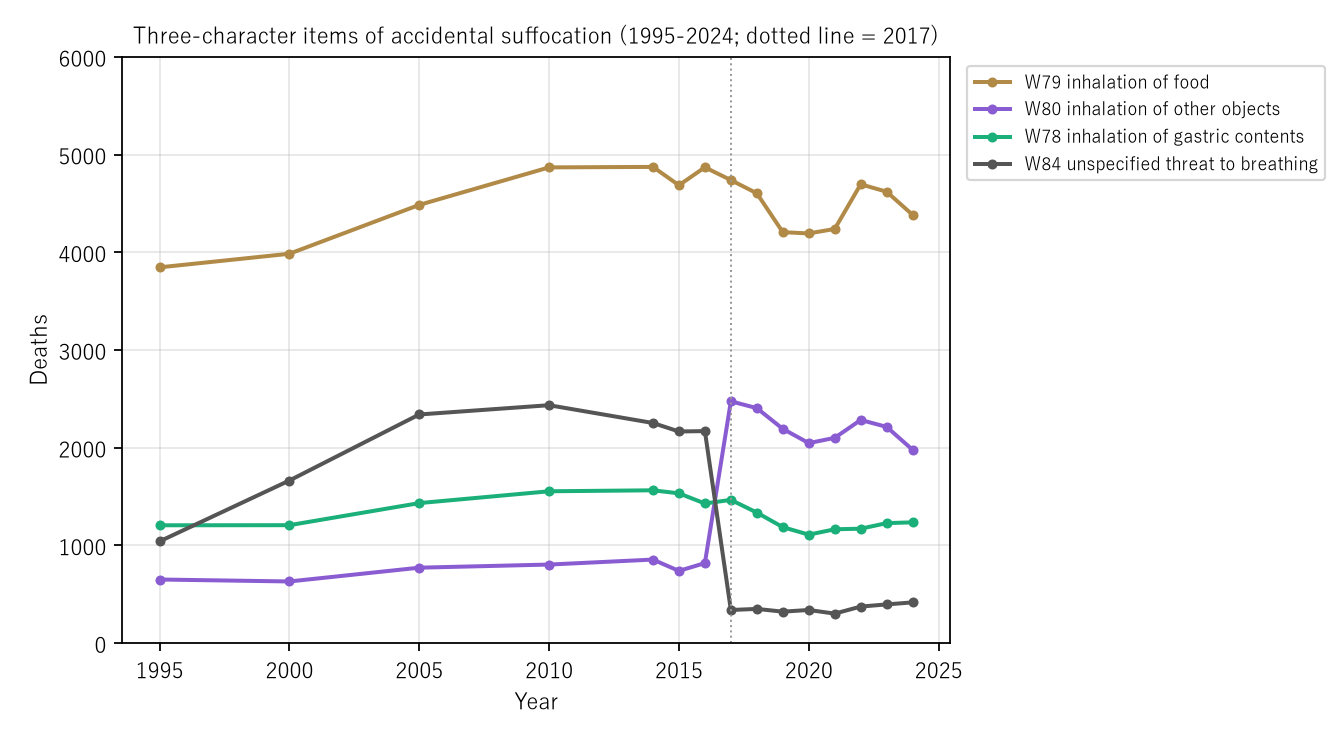
Figure 2: Three-character items of accidental suffocation (1995–2024, table years). Gold is W79, purple W80, green W78, and gray W84. The vertical dotted line is 2017.
7. Core — the suffocation rate forms no peak
Calculation 7.1 Suffocation deaths and rates by age (per 100,000, 2024)
| Age | Deaths | Rate | Doubling years (from previous group) | W79 rate |
|---|---|---|---|---|
| 60–64 | 220 | 2.95 | 8.42 | 1.74 |
| 65–69 | 310 | 4.31 | 9.14 | 2.59 |
| 70–74 | 605 | 7.43 | 6.37 | 4.11 |
| 75–79 | 964 | 12.29 | 6.89 | 7.41 |
| 80–84 | 1,438 | 23.53 | 5.33 | 12.84 |
| 85–89 | 1,762 | 44.83 | 5.38 | 24.43 |
| 90–94 | 1,486 | 71.34 | 7.46 | 37.45 |
| 95–99 | 678 | 107.11 | 8.53 | 50.24 |
| 100+ | 119 | 136.78 | 14.17 | 54.02 |
Observation 7.2: The suffocation rate rises at every step from 1.01 at 45–49 to 136.78 at 100+ and forms no peak. The doubling years are short in the steps to 80–84 and 85–89 (5.33 and 5.38; the shortest is the step to 80–84) and lengthen after 90, but the rate keeps rising. The W79 rate also rises up to 100+ (54.02). This differs from bathtub drowning, whose rate peaks at 85–89 and falls from 90–94 (M069). Of suffocation deaths, 0.899 are at 65+, and ages 0–4 account for 64 (of which age 0 is 45).
8. Limitations
- There is no three-character × month table. The monthly pattern is for suffocation as a whole; the monthly pattern of each item is unknown.
- Why the monthly and age patterns arise cannot be separated with these tables. The tables do not name foods.
- Which rule change produced the 2017 swap between W80 and W84 cannot be separated with these tables.
- The population was back-calculated from deaths and death rates. This compares ages within one year, 2024, not the same people over time. It does not go into accident prevention. Prefectures are not compared. It is not an outlook for any one person.
Conclusion
Of five causes compared, only accidental suffocation had its peak in January, with January ÷ December at 1.138. In 2024, 0.535 of suffocation deaths were inhalation of food (W79), and the three inhalation items made up 0.928. From 2016 to 2017, W80 rose 3.022-fold and W84 fell to 0.156, but their sum hardly moved, at 0.941. The suffocation rate kept rising up to 136.78 at 100+, a different shape from bathtub drowning, which peaks at 85–89.
Three things separate them — the month, age, and under which item a death is counted.
On hearing "suffocation deaths rose" or "fell," check together which months and ages are meant, and whether the way of counting items moved that year.
Data and reproduction
| Data | Vital Statistics 2024 (final figures), Volume 2 Tables 3 and 1-1, and Volume 1 Tables 5.30 and 5.15 (Ministry of Health, Labour and Welfare; e-Stat) (retrieved 26 September 2026) |
| Terms of use | e-Stat follows the Government Standard Terms of Use (Version 2.0). The ratios in this paper were created by processing it and are not figures produced by the government |
| Scope | Japan, 2024 (items by year, 1995–2024) |
| Checker | 検算/M070.py (--zu also draws the figures). Every number in the text is taken from 検算/M070_output.txt |
| Raw data | The retrieved files and SOURCES.md in data/ (URL, retrieval date, SHA-256, terms of use, definitions and how calculations are set up) |
| Figures | 図/M070_zu1, 図/M070_zu2 (png, svg, English versions) |
References
- Ministry of Health, Labour and Welfare. Vital Statistics 2024 (final figures), Volume 2 Tables 3 and 1, and Volume 1 Tables 5.30 and 5.15 (in Japanese). e-Stat (accessed 26 September 2026). https://www.e-stat.go.jp/
- Yamagishi, Y. (2026). The Fall in Pneumonia Deaths in 2017 Is Nearly Predicted by the Ratio from Recoding the Same Death Records under the New and Old Classifications — for Pneumonia, an Actual Step of 0.826 Against a New/Old Ratio of 0.810, a Correlation of 0.969 Across 65 Causes, and the Lost Deaths Moved to Dementia, Alzheimer's Disease, Heart Failure, COPD, and Others [M041]. Zenodo. https://doi.org/10.5281/zenodo.22974374
- Yamagishi, Y. (2026). Of 7,776 Bathtub Drownings in 2024, at Least 0.592 Fell in November–March and at Most 0.173 in June–September — Daily Drowning Deaths in December Were 6.53 Times Those in September, and the Bathtub Drowning Rate Peaks at 85–89 (43.05 per 100,000) [M069]. Zenodo. https://doi.org/10.5281/zenodo.22977889
Reference
Yamagishi, Y. (2026). Of Five Causes Compared, Only Accidental Suffocation Has More Deaths in January Than December (January ÷ December 1.138), and Its Rate Keeps Rising up to 100+ (136.78 per 100,000) [M070]. Zenodo.
DOI: 10.5281/zenodo.22977973
YOI: https://www.yamagishiyuuki.com/yoi/M070
ORCID: 0009-0006-8587-3450
PDF (English) · PDF (Japanese) · Date proof of the English PDF (OpenTimestamps .ots) · SHA256SUMS
The record page for this paper (in Japanese, with the PDFs in each language and the date proof): YOI M070. This paper is a preprint and has not been peer reviewed.