Abstract
Using the 2024 Vital Statistics tables by month of death (condensed list) and by age (three-character list), how much drowning in a bathtub (W65, W66) concentrates in winter and in old age was lined up. It claims no new mathematical theorem and no new law.
First, the tables are consistent. In the monthly table every row satisfies total = sum of 12 months and men + women = total, and unintentional injuries equal the sum of their seven subgroups. The total of drownings, 9,905, is the same in the monthly table and the three-character table (Section 3).
Second, daily deaths from accidental drowning are highest in December (55.7) and lowest in September (8.5). The maximum ÷ minimum is 6.53, larger than for transport accidents (1.51), falls (1.52), accidental suffocation (1.86), and all causes (1.30) (Section 4).
Third, there is no table of bathtub drowning × month. So, bounding with bathtub drowning 7,776 (0.785 of drownings) and other drowning 2,129, of bathtub drownings, the share in June–September (0.333 of the year) is at most 0.173, and the share in November–March (0.417 of the year) is at least 0.592. Wherever in the year the other drownings fall, the lean toward winter holds (Section 5).
Fourth, this is the core of the paper. The bathtub drowning rate (per 100,000) rises from 0.33 at 45–49 to 43.05 at 85–89, peaks at 85–89, and falls from 90–94. The four steps from 50–54 to 70–74 double every 4.31–4.86 years, and the three steps from 70–74 to 85–89 take 6.05–11.37 years, doubling more slowly (Section 6).
Fifth, 0.947 of bathtub drownings are at 65+; the numbers are almost the same for men (3,926) and women (3,850), but at every age from 65 to 99 the rate for men is 1.25–2.42 times that for women (Section 6).
Sixth, what separates them is season (month of death), age, and what the tables count separately. That bathtub drowning leans toward winter can be stated with bounds even though the monthly table has no bathtub category.
Scope note: This paper claims no new mathematical theorem and no new law — the death counts are in public tables, and this paper only lined them up by month and age and bounded a category the monthly table does not have. This paper is a structural interpretation of the shape of numbers in public aggregate data; it is not medical advice, not a diagnosis, and not a treatment recommendation. The author is not a physician. Decisions about individual health should be discussed with a physician or a medical institution. This is a preprint that has not been peer reviewed. It does not go into how to bathe, room temperature, or how to prevent accidents. Why the monthly pattern arises (temperature, how often people bathe, bodily condition, and so on) cannot be separated with these tables. Bathtub drowning is the underlying cause on the death record, and not every death during bathing is necessarily counted as drowning. The month of death is the month the person died, not necessarily the day of bathing. It does not blame those who lost family members. Prefectures are not compared. It is not written as an outlook for any one person. About the data: the Vital Statistics (e-Stat) are used under the Government Standard Terms of Use (Version 2.0), and the ratios in this paper were created by processing them. What this paper adds: bounding the winter share of bathtub drowning from the monthly counts of all drowning when no bathtub × month table exists, and showing that the age-specific rate peaks at 85–89 and doubles more slowly after 70.
1. Notation and question
- Bathtub drowning: the sum of W65 (drowning while in a bathtub) and W66 (drowning following a fall into a bathtub) in the three-character list.
- Drowning: condensed code 20103, accidental drowning and submersion (three-character W65–W74). Other drowning: drowning − bathtub drowning.
- Daily: monthly deaths ÷ days in the month (in 2024, February has 29 days).
- Monthly bounds: bathtub drowning in given months cannot exceed all drowning in those months, and cannot fall below all drowning in those months − the annual total of other drowning.
- Rate: per 100,000 population. The population is back-calculated from the 2024 deaths ÷ death rate × 100,000 in Volume 1 Table 5.15 (5-year groups).
- Doubling years: from the ratio r between adjacent 5-year groups, 5 × log 2 ÷ log r.
Question: Is bathtub drowning concentrated in winter and in old age? Can that be said even though the monthly table has no bathtub category?
Observation 1.1: M068 showed that the leading cause of home-accident deaths is drowning in a bathtub, and that bathtub drowning has come to exceed transport accidents. M002 measured how fast adult death rates double with age. This paper lines up the monthly and age patterns of bathtub drowning with the same measures.
2. Survey and design
To be honest: the design was decided after seeing the tables.
| Content | |
|---|---|
| Tables | Vital Statistics 2024, Volume 2 Table 3 (condensed causes × sex × month of death) and Table 1-1 (three-character × sex × 5-year age), and Volume 1 Table 5.15 (back-calculating the population) |
| Noticed in the survey | The 2024 e-Stat listing has no three-character × month table. The monthly pattern can only be seen for all drowning |
| So | The monthly share of bathtub drowning is bounded from above and below using the monthly counts of all drowning and the annual total of other drowning |
| Measures | Daily maximum ÷ minimum, the monthly bounds, and age-specific rates and doubling years |
3. Data and checks
Calculation 3.1 The 3 retrieved files were fixed by SHA-256, and the following was checked.
- The title and month headings of Table 3 (total, January–December). Every row: total = sum of 12 months; every cause: men + women = total; unintentional injuries = the sum of seven subgroups (20101–20107).
- The age headings of Table 1-1 (total, single years 0–4, 0–4, 20 five-year groups, unknown). For the drowning, W65, and W66 rows: total = sum of ages + unknown, 0–4 = sum of single years, and men + women = total.
- The drowning total in Table 3 and the (W65-W74) total in Table 1-1 are both 9,905. The 2024 total deaths in Table 5.15, 1,605,378, match the total in Table 3.
4. The monthly pattern
Calculation 4.1 Daily deaths (2024)
| Cause | Highest month | Daily | Lowest month | Daily | Max ÷ min |
|---|---|---|---|---|---|
| Accidental drowning | December | 55.7 | September | 8.5 | 6.53 |
| Accidental suffocation | January | 31.9 | June | 17.1 | 1.86 |
| Falls | December | 40.2 | June | 26.4 | 1.52 |
| Transport accidents | December | 11.6 | March | 7.7 | 1.51 |
| Unintentional injuries | December | 174.9 | June | 89.6 | 1.95 |
| All causes | December | 5069.1 | June | 3889.0 | 1.30 |
Observation 4.2: The daily maximum ÷ minimum is largest for accidental drowning, at 6.53. Drowning is 4,517 in December–February and 647 in July–August: more in winter, not in the summer water season. The other causes lie within 1.30–1.95.
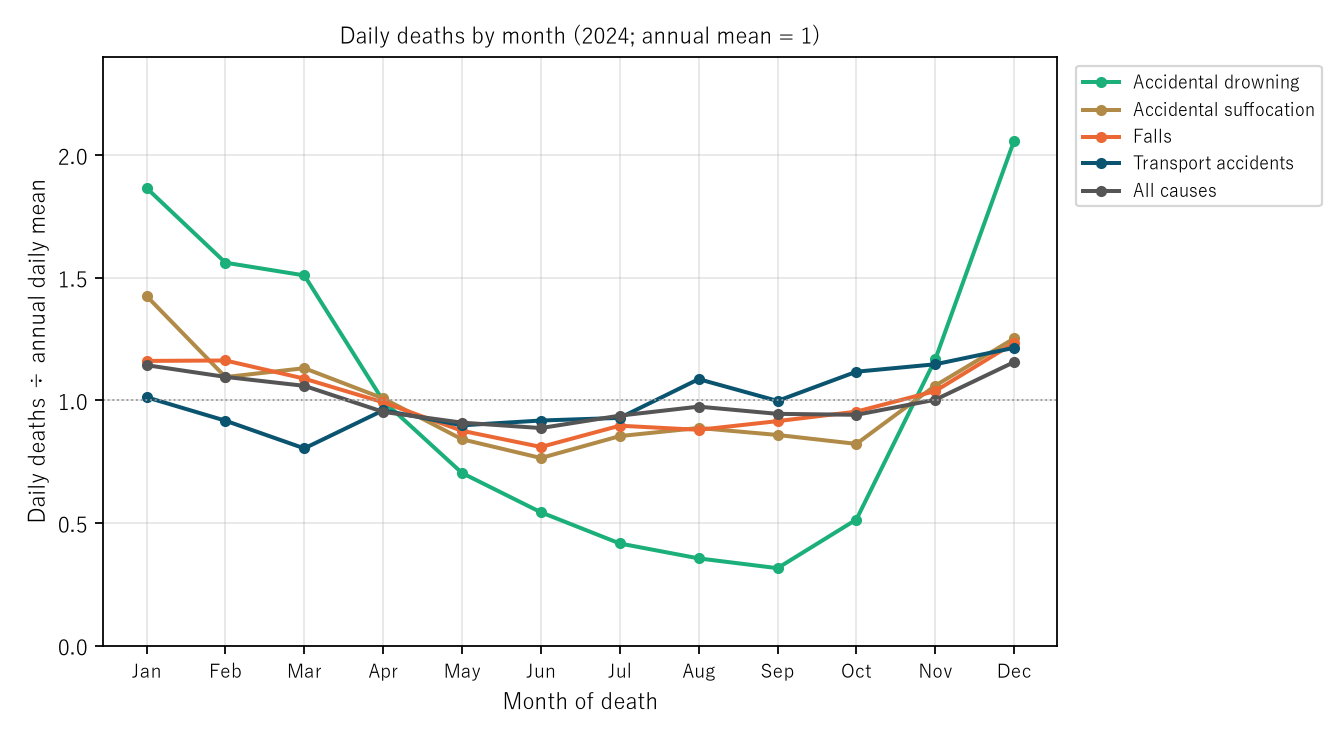
Figure 1: Daily deaths by month in 2024, divided by that cause's annual daily average. Green is accidental drowning, gold accidental suffocation, orange falls, navy transport accidents, and gray all causes. The dotted line is 1 (the annual average).
5. Bounds on the monthly share of bathtub drowning
Calculation 5.1 Bounds from bathtub drowning 7,776 (W65 7,746, W66 30) and other drowning 2,129
| Months | Share of the year | All drowning | Share of bathtub drowning in these months |
|---|---|---|---|
| June–September | 0.333 | 1,344 | at least 0.000, at most 0.173 |
| November–March | 0.417 | 6,730 | at least 0.592, at most 0.865 |
| December–February | 0.250 | 4,517 | at least 0.307, at most 0.581 |
Observation 5.2: Of bathtub drownings, the share in June–September is at most 0.173 (the months are 0.333 of the year), and the share in November–March is at least 0.592 (the months are 0.417 of the year). The upper bound is when all drowning in those months was in a bathtub; the lower bound is when all 2,129 other drownings fell in those months; either way the pattern leans toward winter. For December–February alone the range is 0.307–0.581, above those months' share of the year (0.250) even at its lower end.
6. Core — the age pattern
Calculation 6.1 Bathtub drowning deaths and rates by age (per 100,000, 2024)
| Age | Deaths | Rate | Doubling years (from previous group) |
|---|---|---|---|
| 50–54 | 48 | 0.50 | 8.23 |
| 55–59 | 85 | 1.02 | 4.86 |
| 60–64 | 170 | 2.28 | 4.31 |
| 65–69 | 362 | 5.03 | 4.37 |
| 70–74 | 880 | 10.81 | 4.54 |
| 75–79 | 1,404 | 17.89 | 6.87 |
| 80–84 | 1,940 | 31.74 | 6.05 |
| 85–89 | 1,692 | 43.05 | 11.37 |
| 90–94 | 882 | 42.34 | does not double |
| 95–99 | 195 | 30.81 | does not double |
Observation 6.2: The rate rises from 0.33 at 45–49 to 43.05 at 85–89, peaks at 85–89, and falls from 90–94 (42.34). The four steps from 50–54 to 70–74 double every 4.31–4.86 years, and the three steps from 70–74 to 85–89 lengthen to 6.05–11.37 years. To be honest: I expected it to keep rising through 90–94, and that expectation missed.
Observation 6.3: 0.947 of bathtub drownings (7,363) are at 65+. The numbers for men (3,926) and women (3,850) are almost the same, but the rate is higher for men at every age from 65 to 99 (men ÷ women from 1.25 at 80–84 to 2.42 at 95–99). Since deaths = rate × population, similar numbers despite higher male rates fit with women being more numerous at 65+ (women ÷ men 1.31). A difference in rates and a difference in numbers are different things.
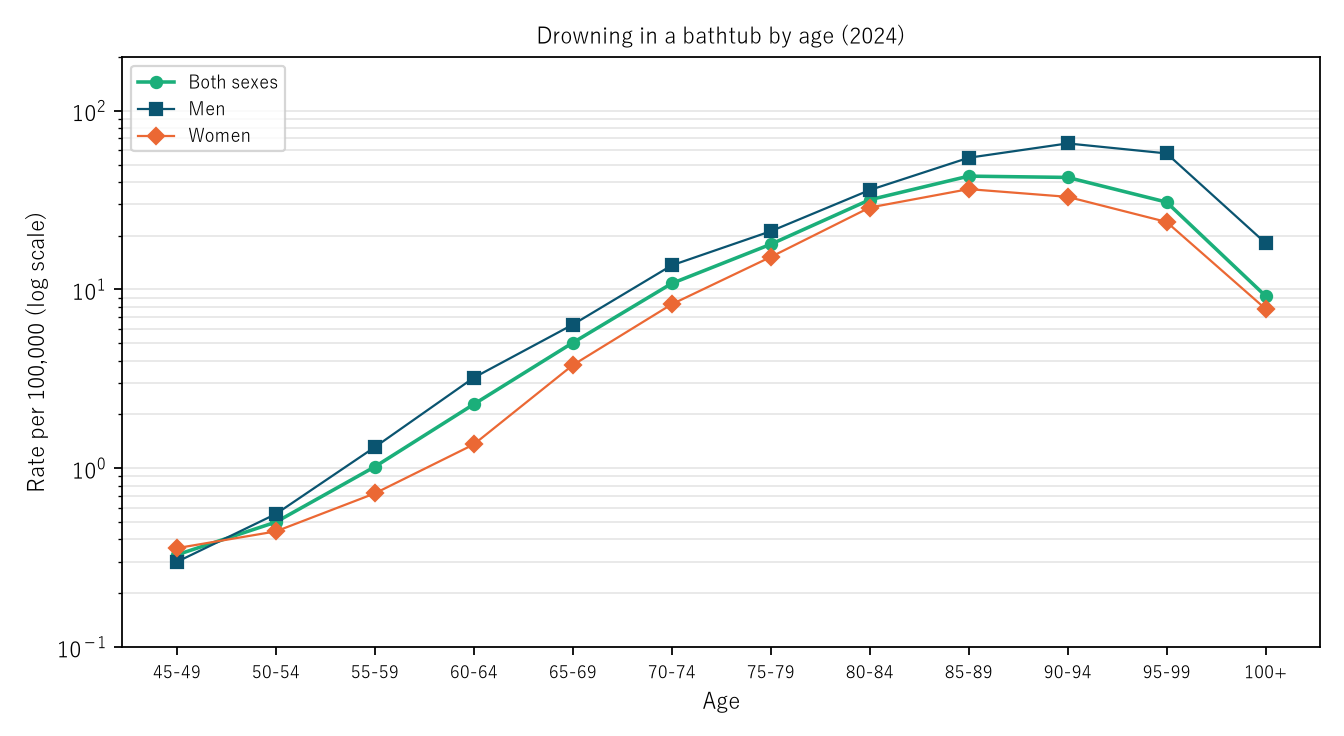
Figure 2: Bathtub drowning rates by age in 2024 (per 100,000, log scale). Green is both sexes, navy men, and orange women.
7. Limitations
- There is no bathtub drowning × month table. The monthly share can only be given as bounds; the true value lies somewhere within them.
- The month of death is the month the person died, not the day of bathing. Why the monthly pattern arises cannot be separated with these tables.
- Bathtub drowning is a count of underlying causes, not all deaths during bathing. The age-specific rates are for one year, 2024, not the same people followed over time.
- The population was back-calculated from deaths and death rates. It does not go into how to bathe or how to prevent accidents. Prefectures are not compared. It is not an outlook for any one person.
Conclusion
In 2024, daily deaths from accidental drowning in December were 6.53 times those in September, leaning far more toward winter than other causes (1.30–1.95). There is no bathtub drowning × month table, but bounding it, of the 7,776 bathtub drownings the share in November–March was at least 0.592 and the share in June–September at most 0.173. The bathtub drowning rate peaked at 43.05 at 85–89, doubled every 4.31–4.86 years from 50–54 to 70–74, and doubled more slowly after that.
Three things separate them — season (month of death), age, and what the tables count separately.
On hearing "bath accidents happen in winter and to older people," check together how far the monthly tables can support it, at what age the rate peaks, and whether it is about numbers or rates.
Data and reproduction
| Data | Vital Statistics 2024 (final figures), Volume 2 Tables 3 and 1-1, and Volume 1 Table 5.15 (Ministry of Health, Labour and Welfare; e-Stat) (retrieved 26 September 2026) |
| Terms of use | e-Stat follows the Government Standard Terms of Use (Version 2.0). The ratios in this paper were created by processing it and are not figures produced by the government |
| Scope | Japan, 2024 |
| Checker | 検算/M069.py (--zu also draws the figures). Every number in the text is taken from 検算/M069_output.txt |
| Raw data | The retrieved files and SOURCES.md in data/ (URL, retrieval date, SHA-256, terms of use, definitions and how calculations are set up) |
| Figures | 図/M069_zu1, 図/M069_zu2 (png, svg, English versions) |
References
- Ministry of Health, Labour and Welfare. Vital Statistics 2024 (final figures), Volume 2 Tables 3 and 1, and Volume 1 Table 5.15 (in Japanese). e-Stat (accessed 26 September 2026). https://www.e-stat.go.jp/
- Yamagishi, Y. (2026). The Speed at Which Adult Death Rates Double with Age Hardly Moved; What Fell Was the Level [M002]. Zenodo. https://doi.org/10.5281/zenodo.22963210
- Yamagishi, Y. (2026). In 2024, Unintentional-Injury Deaths Recorded as Occurring at Home Were 17,320, 5.59 Times Road Traffic Deaths (3,100), but 17,625 Had an Unspecified Place — Home Accidents Are Fewer Than Road Traffic Deaths Only at 15–44, and 10.39 Times at 80+ [M068]. Zenodo. https://doi.org/10.5281/zenodo.22977842
Reference
Yamagishi, Y. (2026). Of 7,776 Bathtub Drownings in 2024, at Least 0.592 Fell in November–March and at Most 0.173 in June–September [M069]. Zenodo.
DOI: 10.5281/zenodo.22977889
YOI: https://www.yamagishiyuuki.com/yoi/M069
ORCID: 0009-0006-8587-3450
PDF (English) · PDF (Japanese) · Date proof of the English PDF (OpenTimestamps .ots) · SHA256SUMS
The record page for this paper (in Japanese, with the PDFs in each language and the date proof): YOI M069. This paper is a preprint and has not been peer reviewed.