Abstract
The Vital Statistics counts of X30, "exposure to excessive natural heat" (called heat deaths in this paper), by year (15 years, 1995–2024) and by age in 2024 were lined up with the Japan Meteorological Agency's summer (June–August) mean temperature anomaly for Japan. It claims no new mathematical theorem and no new law.
First, the data are consistent. The 2024 X30 count, 2,160, is the same in the yearly and age tables. The JMA data file lists summer anomalies for 1898–2026 without gaps, and the largest year is 2025 (+2.36°C), as the page states (Section 3).
Second, heat deaths rose from 318 in 1995 to 2,160 in 2024 (6.79-fold), and 2024 is the highest of the 15 table years (Section 4).
Third, this is the core of the paper. Over the 15 years, the correlation between the summer anomaly and log(deaths) is 0.649 (rank correlation 0.758), and the fitted line gives 2.16-fold deaths per 1°C of anomaly. But the summer anomaly itself rises with the year (correlation 0.579); adding the year to the line shrinks the factor per 1°C to 1.39, leaving 1.0551-fold per year (1.71-fold per 10 years) (Section 5).
Fourth, in 2023 and 2024, with the same summer anomaly of +1.76, deaths were 1,651 and 2,160, differing 1.31-fold. The years farthest from the line are 2000 (actual 207, line 792) and 2019 (actual 1,224, line 605) (Section 6).
Fifth, the 2024 heat death rate (per 100,000) rises from 1.45 at 60–64 to 11.49 at 100+; 0.850 of deaths are at 65+, with 1,303 men and 857 women (Section 7).
Sixth, what separates them is summer heat, other things that move with the year, or age. The national summer mean anomaly lines up with much of the year-to-year movement in deaths, but years with the same anomaly differ, and over these 15 years the anomaly part and the part that moves with the year cannot be fully separated.
Scope note: This paper claims no new mathematical theorem and no new law — the death counts and temperature anomalies are in public data, and this paper only lined them up and fitted lines. This paper is a structural interpretation of the shape of numbers in public aggregate data; it is not medical advice, not a diagnosis, and not a treatment recommendation. The author is not a physician. Decisions about individual health should be discussed with a physician or a medical institution. This is a preprint that has not been peer reviewed. It does not go into how to prevent heat illness, how to use air conditioning or drink fluids, or measures against heat. The numbers here are a pattern of moving together, not the causal size of how many times heat multiplies deaths. The summer anomaly is Japan's average for June–August and does not include regional heat, daily heat, or how long hot spells last. The cause of death is the underlying cause X30, and other deaths in which heat played a part are not included. What remains as "the year part" in the line with the year added (age composition, counting, changes in living, and so on) cannot be separated with these numbers. There are only 15 years, and the coefficients of the lines can vary. It does not blame those who lost family members. Prefectures are not compared. It is not written as an outlook for any one person. About the data: the Vital Statistics (e-Stat) are used under the Government Standard Terms of Use (Version 2.0), and the JMA "seasonal mean temperature anomalies in Japan" (JMA website https://www.data.jma.go.jp/cpdinfo/temp/list/ssn_jpn.html ) under the Public Data License (Version 1.0), and the ratios and correlations in this paper were created by processing them. What this paper adds: lining up yearly heat deaths with the summer mean temperature anomaly, and showing that they move together, that the anomaly part shrinks when the year is added, and that deaths differ 1.31-fold even in years with the same anomaly.
1. Notation and question
- Heat deaths: deaths with underlying cause X30, "exposure to excessive natural heat," in the three-character list. The name is used only within this paper.
- Summer anomaly: the summer (June–August) value (°C) in JMA's "seasonal mean temperature anomalies in Japan." The baseline is the 30-year average for 1991–2020.
- Correlation: over the 15 table years (1995, 2000, 2005, 2010, 2014–2024), the correlation between the summer anomaly and log(deaths). Fitted line: least squares for log(deaths) = a + b × summer anomaly; exp(b) is the factor per 1°C. With the year: log(deaths) = a + b1 × summer anomaly + b2 × (year − 1995).
- Rate: per 100,000 population. The population is back-calculated from the 2024 deaths ÷ death rate × 100,000 in Volume 1 Table 5.15 (5-year groups).
Question: How much do heat deaths jump in hot summers? Can the heat part be separated from the rest?
Observation 1.1: M069 bounded how much bathtub drowning leans toward winter when the monthly table has no bathtub category. Heat deaths also have no three-character × month table, so this paper looks at years and summer temperature rather than months.
2. Survey and design
To be honest: the design was decided after seeing the tables.
| Content | |
|---|---|
| Data | Vital Statistics 2024, Volume 1 Table 5.30 (three-character × year), Volume 2 Table 1-1 (three-character × 5-year age), Volume 1 Table 5.15 (back-calculating the population), and JMA "seasonal mean temperature anomalies in Japan" (data file) |
| Terms checked | JMA website content follows the Public Data License (Version 1.0), and processed use must say so (checked on a copy of the terms page) |
| Noticed in the survey | Deaths differed between 2023 and 2024, which had the same summer anomaly. The summer anomaly rose with the year |
| Measures | The correlation and fitted line, the line with the year added, years far from the line, and age-specific rates |
3. Data and checks
Calculation 3.1 The 6 retrieved files were fixed by SHA-256, and the following was checked.
- The JMA page contains the sentence that the baseline is the 30-year average for 1991–2020, and the terms page states conformity with the Public Data License (Version 1.0) and gives an example wording for processed use.
- The JMA data file's headings are year, winter (previous December–February), spring (March–May), summer (June–August), and autumn (September–November), and summer values run 1898–2026 without gaps. The largest summer anomaly is 2025 (+2.36), matching the page.
- The 2024 X30 in Table 5.30, 2,160, matches X30 in Table 1-1. In Table 1-1, X30 total = sum of ages + unknown, and men + women = total.
4. Heat deaths and the summer anomaly
Calculation 4.1 The 15 table years
| Year | Deaths | Summer anomaly (°C) | Year | Deaths | Summer anomaly (°C) |
|---|---|---|---|---|---|
| 1995 | 318 | -0.38 | 2018 | 1,581 | +0.57 |
| 2000 | 207 | +0.47 | 2019 | 1,224 | +0.12 |
| 2005 | 328 | +0.17 | 2020 | 1,528 | +0.62 |
| 2010 | 1,731 | +1.08 | 2021 | 755 | +0.54 |
| 2014 | 529 | +0.18 | 2022 | 1,477 | +0.91 |
| 2015 | 970 | -0.09 | 2023 | 1,651 | +1.76 |
| 2016 | 621 | +0.49 | 2024 | 2,160 | +1.76 |
| 2017 | 635 | +0.24 |
Observation 4.2: Heat deaths rose from 318 in 1995 to 2,160 in 2024 (6.79-fold), and 2024 is the highest of the 15 years. The JMA file also has the summers of 2025 (+2.36) and 2026 (+1.02), but the death tables end in 2024.
5. Core — they move together, but cannot be separated from the year
Calculation 5.1 Summer anomaly and log(deaths) (15 years)
| Measure | Value |
|---|---|
| Correlation | 0.649 |
| Rank correlation (Spearman) | 0.758 |
| Fitted line: factor per 1°C | 2.16 |
| r² | 0.422 |
| Correlation of the summer anomaly with the year | 0.579 |
| Line with year: factor per 1°C | 1.39 |
| Line with year: factor per year (per 10 years) | 1.0551 (1.71) |
Observation 5.2: The summer anomaly and log(deaths) move together with a correlation of 0.649, and the fitted line gives 2.16-fold per 1°C. But the summer anomaly itself rises with the year (correlation 0.579); adding the year to the line shrinks the factor per 1°C to 1.39 and leaves 1.0551-fold per year. Over 15 years, the heat part and the part that moves with the year cannot be clearly separated.
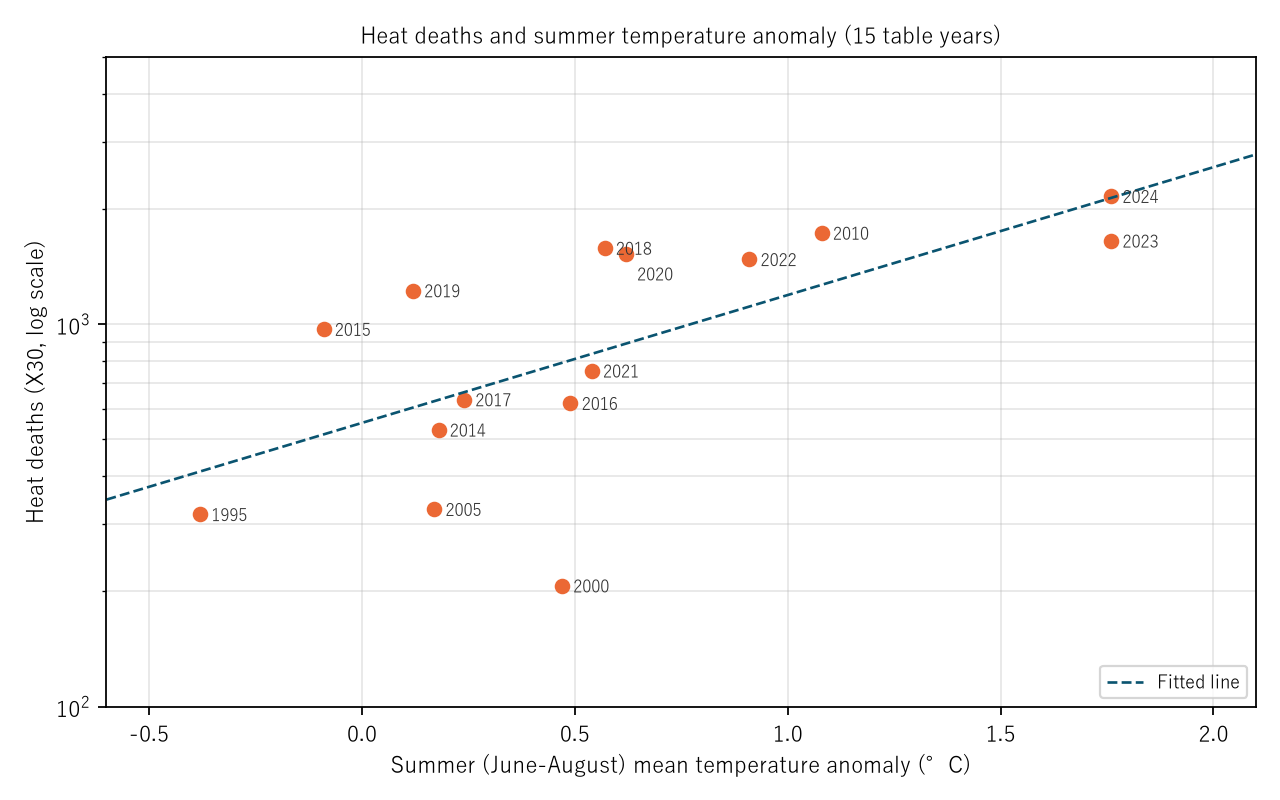
Figure 1: For the 15 table years, the summer (June–August) mean temperature anomaly (horizontal) and heat deaths (X30, vertical, log scale). Orange dots are labeled with the year. The navy dashed line is the fitted line. Created by processing JMA "seasonal mean temperature anomalies in Japan" and the Vital Statistics.
6. Comparing similar summers
Calculation 6.1 Pairs of years with close summer anomalies
| Year | Summer anomaly (°C) | Deaths |
|---|---|---|
| 2023 | +1.76 | 1,651 |
| 2024 | +1.76 | 2,160 |
| 2010 | +1.08 | 1,731 |
| 2022 | +0.91 | 1,477 |
| 2015 | -0.09 | 970 |
| 2018 | +0.57 | 1,581 |
Observation 6.2: In 2023 and 2024, with the same summer anomaly of +1.76, deaths differ 1.31-fold. 2015, with an anomaly of -0.09, had 970, more than 2000 (207) at +0.47. The years farthest from the line are 2000 (actual 207, line 792, ratio 0.26), 2019 (actual 1,224, line 605, ratio 2.02), and 2005 (actual 328, line 629, ratio 0.52). Japan's three-month summer average alone does not determine each year's deaths.
7. Age
Calculation 7.1 Heat deaths and rates by age in 2024 (per 100,000)
| Age | Deaths | Rate |
|---|---|---|
| 60–64 | 108 | 1.45 |
| 65–69 | 149 | 2.07 |
| 70–74 | 265 | 3.25 |
| 75–79 | 361 | 4.60 |
| 80–84 | 408 | 6.68 |
| 85–89 | 352 | 8.96 |
| 90–94 | 218 | 10.47 |
| 95–99 | 72 | 11.37 |
| 100+ | 10 | 11.49 |
Observation 7.2: The heat death rate rises at every step from 1.45 at 60–64 to 11.49 at 100+. The factor from 65–69 to 85–89 is 4.32, and the rise is smaller past 90. Of deaths, 0.850 (1,835) are at 65+, with 1,303 men and 857 women.
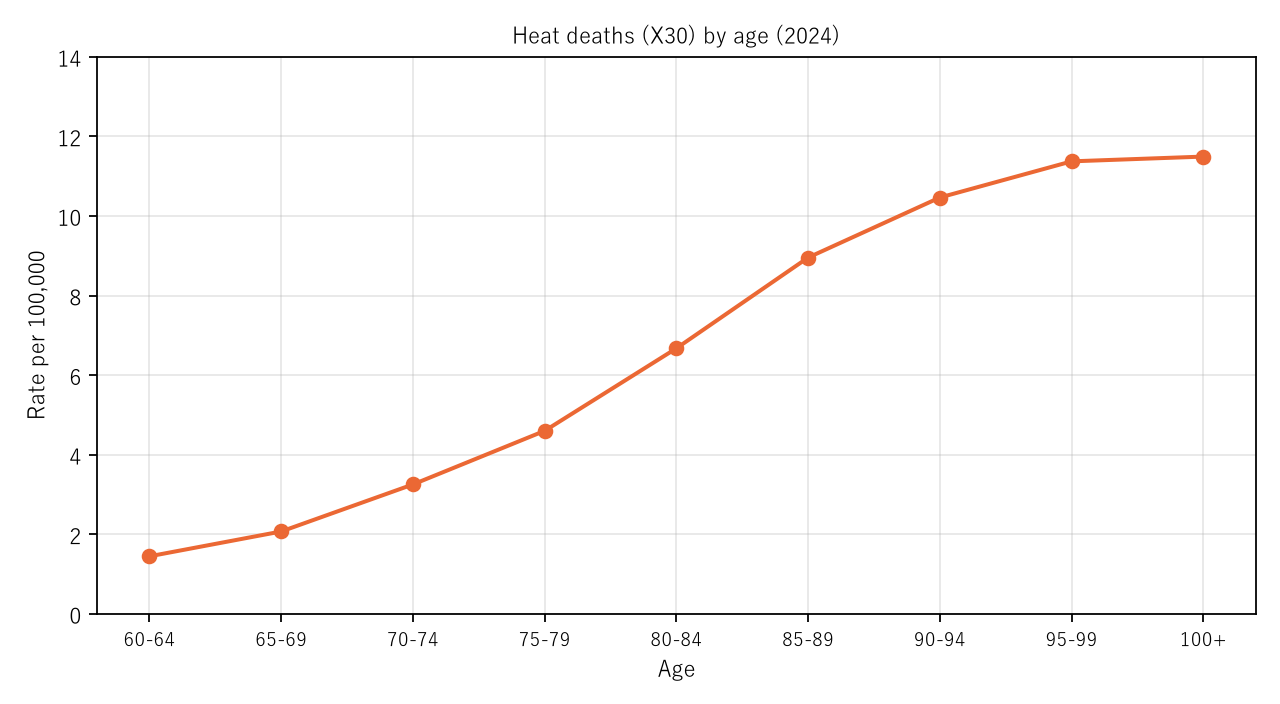
Figure 2: Heat death (X30) rates by age in 2024 (per 100,000).
8. Limitations
- The numbers are a pattern of moving together, not the causal size of heat. Adding the year shrinks the anomaly part, and what the remaining year part consists of cannot be separated. There are only 15 years.
- The summer anomaly is Japan's June–August average and does not include regional or daily heat or how long hot spells last. There is no three-character × month table.
- The cause of death is the underlying cause X30; other deaths in which heat played a part are not included.
- The age-specific rates are for 2024 only, and the yearly series is not divided into age composition and rates. It does not go into preventing heat illness. Prefectures are not compared. It is not an outlook for any one person.
Conclusion
Heat deaths (X30) rose from 318 in 1995 to 2,160 in 2024. Over 15 years, the summer mean temperature anomaly and log(deaths) moved together with a correlation of 0.649, at 2.16-fold per 1°C, but the anomaly itself rose with the year, and adding the year shrank this to 1.39-fold per 1°C. Even in 2023 and 2024, with the same summer anomaly, deaths differed 1.31-fold. In 2024 the rate kept rising up to 100+, and 0.850 of deaths were at 65+.
Three things separate them — summer heat, other things that move with the year, or age.
On hearing "heat deaths multiply so many times in a hot summer," check together whether that factor includes the year part, how much years with the same heat differ, and which ages are meant.
Data and reproduction
| Data | Vital Statistics 2024 (final figures), Volume 1 Tables 5.30 and 5.15, and Volume 2 Table 1-1 (Ministry of Health, Labour and Welfare; e-Stat); JMA "seasonal mean temperature anomalies in Japan" (JMA website) (retrieved 26 September 2026) |
| Terms of use | e-Stat follows the Government Standard Terms of Use (Version 2.0), and the JMA website the Public Data License (Version 1.0). The ratios and correlations in this paper were created by processing them and are not figures produced by the government |
| Scope | Japan, 1995–2024 (15 table years), age for 2024 |
| Checker | 検算/M072.py (--zu also draws the figures). Every number in the text is taken from 検算/M072_output.txt |
| Raw data | The retrieved files and SOURCES.md in data/ (URL, retrieval date, SHA-256, terms of use, definitions and how calculations are set up) |
| Figures | 図/M072_zu1, 図/M072_zu2 (png, svg, English versions) |
References
- Ministry of Health, Labour and Welfare. Vital Statistics 2024 (final figures), Volume 1 Tables 5.30 and 5.15, and Volume 2 Table 1 (in Japanese). e-Stat (accessed 26 September 2026). https://www.e-stat.go.jp/
- Japan Meteorological Agency. Seasonal mean temperature anomalies in Japan (°C) (in Japanese) (accessed 26 September 2026). https://www.data.jma.go.jp/cpdinfo/temp/list/ssn_jpn.html
- Yamagishi, Y. (2026). Of 7,776 Bathtub Drownings in 2024, at Least 0.592 Fell in November–March and at Most 0.173 in June–September — Daily Drowning Deaths in December Were 6.53 Times Those in September, and the Bathtub Drowning Rate Peaks at 85–89 (43.05 per 100,000) [M069]. Zenodo. https://doi.org/10.5281/zenodo.22977889
Reference
Yamagishi, Y. (2026). Heat Deaths (Exposure to Excessive Natural Heat) Move with the Summer Mean Temperature Anomaly (Log Correlation 0.649; 2.16-Fold per 1°C), but Adding the Year Shrinks This to 1.39-Fold per 1°C [M072]. Zenodo.
DOI: 10.5281/zenodo.22978195
YOI: https://www.yamagishiyuuki.com/yoi/M072
ORCID: 0009-0006-8587-3450
PDF (English) · PDF (Japanese) · Date proof of the English PDF (OpenTimestamps .ots) · SHA256SUMS
The record page for this paper (in Japanese, with the PDFs in each language and the date proof): YOI M072. This paper is a preprint and has not been peer reviewed.