Abstract
The National Police Agency's counts of fatal accidents with a driver of a general moped or larger vehicle as the first party, and the same per 100,000 license holders (by age group, 2015–2025), were lined up with the Population Estimates (1 October 2024) to see how the age ranking changes with the denominator. It claims no new mathematical theorem and no new law.
First, the tables are consistent. In the count table, the age groups sum to the total and the restated rows equal the sums of their groups; the 2025 rates equal count ÷ license holders × 100,000 to 2 decimals. License holders by age sum to the total, 81,510,369 (Section 3).
Second, this is the core of the paper. In 2025, per 100,000 license holders, ages 16–19 (9.44) rank first and 85+ (9.31) second; per 100,000 population, 85+ is 1.36, 14th of 15 age groups, and 16–19 is 1.32, 15th. The highest per population is 55–59 (2.58) (Section 4).
Third, in every age group, per population = per license holder × share holding a license, and that share ranges from 0.944 at 55–59 down to 0.146 at 85+ and 0.140 at 16–19. The ranking flips between the two denominators because of this difference in shares (Section 4).
Fourth, at 85+, from 2015 to 2025, the rate per license holder fell from 18.17 to 9.31 (0.512-fold), license holders (2015 back-calculated) rose from 522,840 to 987,713 (1.889-fold), and the count went from 95 to 92 (0.968-fold). At 16–19 the count was 0.514-fold, the rate 0.657-fold, and license holders 0.782-fold (Section 5).
Fifth, total fatal accidents fell from 3,585 to 2,257 (0.630-fold), and the share with a driver aged 65+ rose from 0.277 to 0.342 (Section 5).
Sixth, what separates them is whether the denominator is people holding a license or everyone of that age. "Older drivers have many accidents" holds per license holder, does not hold per population, and in counts, the fall in rates has been offset by the rise in license holders.
Scope note: This paper claims no new mathematical theorem and no new law — counts, rates, license holders, and population are in public tables, and this paper only lined them up by two denominators. This paper is a structural interpretation of the shape of numbers in public aggregate data; it is not medical advice, not a diagnosis, and not a treatment recommendation. The author is not a physician. Decisions about individual health should be discussed with a physician or a medical institution. This is a preprint that has not been peer reviewed. It does not go into driving ability or fitness, or the evaluation of policies such as license surrender or renewal. It does not blame older drivers, young drivers, or those involved in accidents or their families. The counts are fatal accidents counted with a "first party," determined under the police's rules. The rates are per license holder and per population, not per distance or time driven. Population is as of 1 October 2024 and license holders as of the end of December 2025, so ratios of numbers from different dates are approximate. The population denominator for 16–19 includes 15-year-olds. Prefectures are not compared. It is not written as an outlook for any one person. About the data: the Road Traffic Statistics (National Police Agency) and the Population Estimates (Statistics Bureau) were taken from e-Stat and used under the Government Standard Terms of Use (Version 2.0), and the ratios in this paper were created by processing them. What this paper adds: lining up the same fatal accident counts by two denominators, per license holder and per population, and showing that 85+ moves from 2nd to 14th, that the difference is fully explained by the share holding a license, and that the count at 85+ hardly moved because the fall in the rate and the rise in license holders offset each other.
1. Notation and question
- Fatal accidents: the count of fatal accidents with a driver of a general moped or larger vehicle as the first party (Table 3-1-2). These are accidents, not people who died.
- Per license holder: the rate in Table 3-1-1 (per 100,000 license holders).
- Per population: the 2025 count ÷ population on 1 October 2024 × 100,000. The denominator for 16–19 is the Population Estimates' 15–19, and for 85+ the sum of ages 85 and over.
- Share holding a license: 2025 license holders ÷ population on 1 October 2024.
- 2015 license holders: back-calculated as count ÷ rate × 100,000.
Question: With which denominator can "older drivers have many accidents" be said?
Observation 1.1: M066 showed that road traffic deaths have three ways of counting that differ by age. M067 divided the fall in road traffic deaths into the population's age composition and age-specific rates. This paper lines up the counts on the side that caused the accident (drivers as first party) with different denominators.
2. Survey and design
To be honest: the design was decided after seeing the tables.
| Content | |
|---|---|
| Tables | Road Traffic Statistics, "fatal road traffic accidents and traffic law enforcement," Table 3-1-2 (counts) and Table 3-1-1 (per 100,000 license holders, with 2025 license holders), and Population Estimates Table 3 (1 October 2024) |
| Noticed in the survey | Table 3-1-1 has a column of 2025 license holders, and the 2015 license holders could be back-calculated from counts and rates |
| Comparisons | The 2025 ranking under two denominators, a check that per population = per license holder × share holding a license, and the 2015-to-2025 movement of counts, rates, and license holders |
3. Data and checks
Calculation 3.1 The 3 retrieved files were fixed by SHA-256, and the following was checked.
- The titles of the two tables, the years (the 11 years 2015–2025), and the rows for age groups (15 and under, 16–19, …, 85+), total, and restated groups.
- Table 3-1-2: in every year, total = 15 and under + 15 age groups, and the restated rows (16–24, 65+, 75+) equal the sums of their groups.
- Table 3-1-1: the 2025 license holders of the 15 age groups sum to the total (81,510,369). The 2025 rate equals count ÷ license holders × 100,000 to 2 decimals in every age group.
- Population Estimates: the 21 five-year groups and the total differ by 2,000 (rounding to thousands). The total population on 1 October 2024 is 123,802,000.
4. Core — changing the denominator flips the ranking
Calculation 4.1 Fatal accidents with the driver as first party, 2025
| Age group | Count | Per 100,000 license holders | Per 100,000 population | Share holding a license |
|---|---|---|---|---|
| 16–19 | 72 | 9.44 | 1.32 | 0.140 |
| 20–24 | 149 | 3.39 | 2.38 | 0.701 |
| 30–34 | 104 | 1.87 | 1.63 | 0.869 |
| 55–59 | 219 | 2.73 | 2.58 | 0.944 |
| 65–69 | 181 | 2.93 | 2.49 | 0.851 |
| 75–79 | 185 | 3.66 | 2.35 | 0.641 |
| 80–84 | 120 | 5.19 | 1.96 | 0.377 |
| 85+ | 92 | 9.31 | 1.36 | 0.146 |
Observation 4.2: Per license holder the order is 16–19 (9.44), 85+ (9.31), 80–84 (5.19), 75–79 (3.66), 20–24 (3.39); per population it is 55–59 (2.58), 65–69 (2.49), then 50–54, 20–24, and 70–74 (all 2.38). 85+ is 2nd per license holder and 14th per population; 16–19 is 1st and 15th.
Observation 4.3: In every age group, per population = per license holder × share holding a license holds within rounding (0.01). The share holding a license is largest at 55–59 (0.944), and is 0.146 at 85+ and 0.140 at 16–19. In the two end groups few people hold a license, so the rate per license holder is high and the rate per person of that age is low.
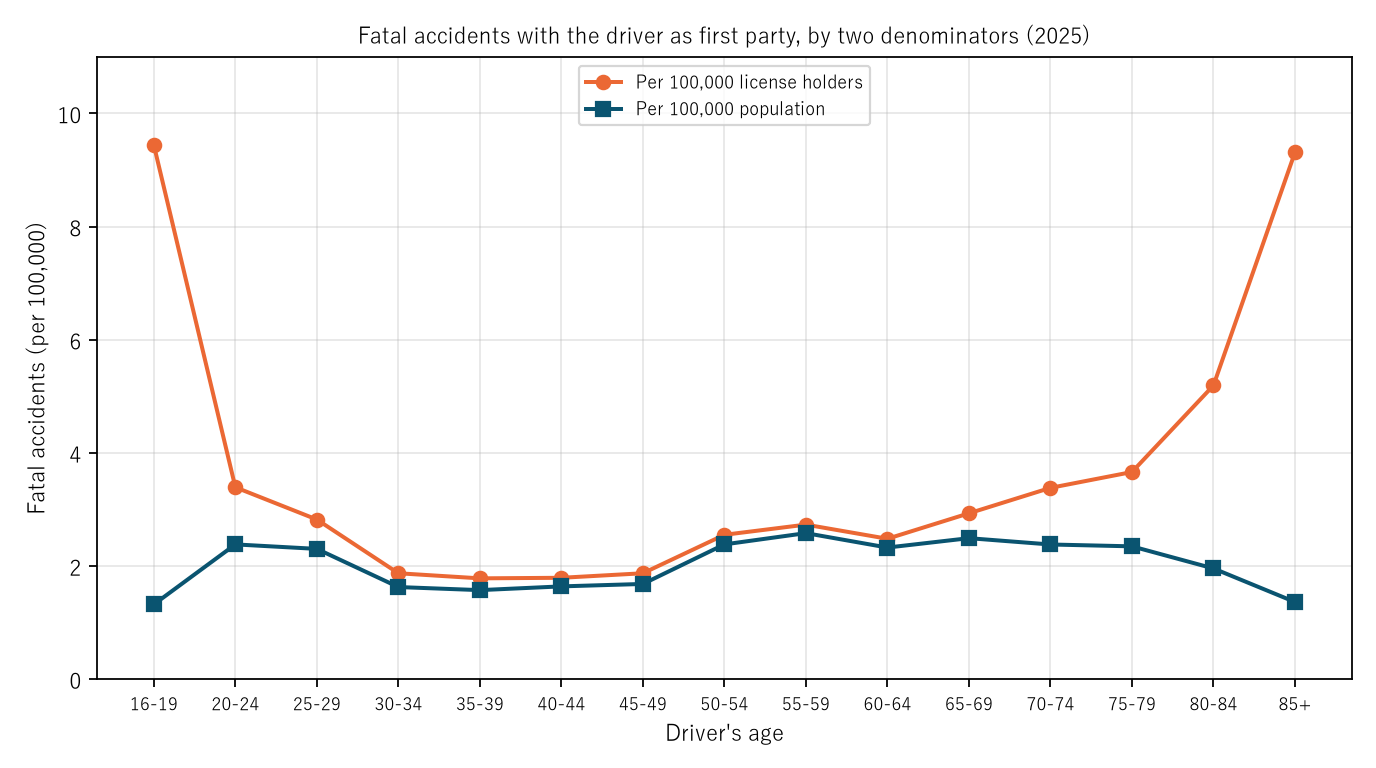
Figure 1: Fatal accidents with the driver as first party in 2025, by age group under two denominators. Orange is per 100,000 license holders, navy per 100,000 population.
5. From 2015 to 2025: counts, rates, and license holders
Calculation 5.1 Movement of counts, rates, and license holders (2015 license holders back-calculated)
| Age group | Count | Rate per license holder | License holders | Count ratio | Rate ratio | License ratio |
|---|---|---|---|---|---|---|
| 16–19 | 140 → 72 | 14.36 → 9.44 | 974,930 → 762,731 | 0.514 | 0.657 | 0.782 |
| 20–24 | 297 → 149 | 6.23 → 3.39 | 4,767,255 → 4,388,849 | 0.502 | 0.544 | 0.921 |
| 65–69 | 306 → 181 | 4.02 → 2.93 | 7,611,940 → 6,185,504 | 0.592 | 0.729 | 0.813 |
| 75–79 | 197 → 185 | 6.99 → 3.66 | 2,818,312 → 5,051,729 | 0.939 | 0.524 | 1.792 |
| 80–84 | 166 → 120 | 11.53 → 5.19 | 1,439,722 → 2,310,985 | 0.723 | 0.450 | 1.605 |
| 85+ | 95 → 92 | 18.17 → 9.31 | 522,840 → 987,713 | 0.968 | 0.512 | 1.889 |
Observation 5.2: At 85+, the rate per license holder fell to 0.512, license holders rose 1.889-fold, and the count hardly moved, at 0.968. At 75–79 and 80–84, rates also fell to 0.524 and 0.450, but license holders rose 1.792- and 1.605-fold. At 16–19 and 20–24, both rates and license holders fell, and counts roughly halved (0.514 and 0.502).
Observation 5.3: Total fatal accidents fell from 3,585 to 2,257 (0.630-fold), and the share with a driver aged 65+ rose from 0.277 to 0.342. "The share of fatal accidents involving older drivers increased" happened as a result of more older people holding licenses while their rates fell.
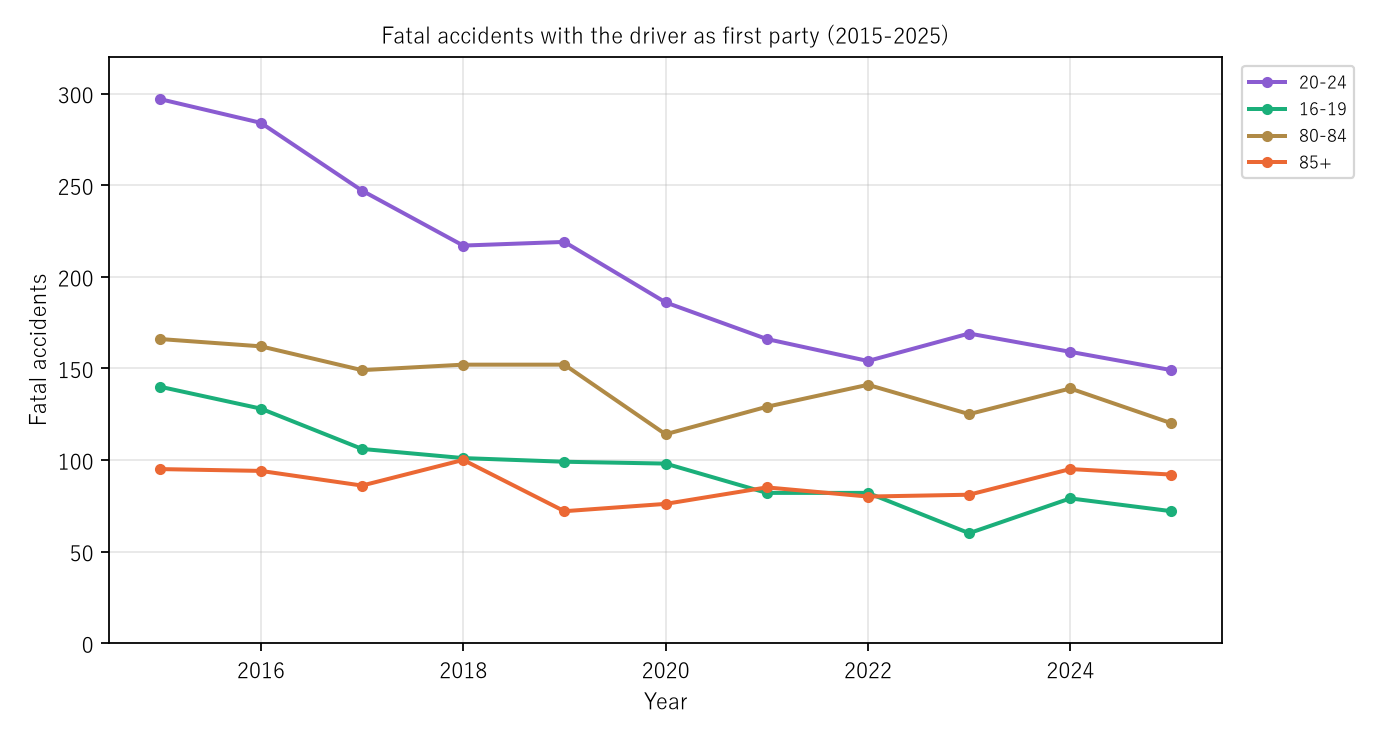
Figure 2: Fatal accidents with the driver as first party, 2015–2025. Purple is 20–24, green 16–19, gold 80–84, and orange 85+.
6. Limitations
- The rates are per license holder and per population, not per distance or time driven. Differences in the amount of driving by age cannot be seen in these tables.
- Population is as of 1 October 2024 and license holders as of the end of December 2025, so ratios of numbers from different dates are approximate. The population denominator for 16–19 includes 15-year-olds, so the rate comes out somewhat low.
- The 2015 license holders were back-calculated from counts and rates (2 decimals), so rounding error enters.
- The counts are fatal accidents counted with a first party, determined under the police's rules. It does not go into driving ability or fitness, or the evaluation of policies such as license surrender. Prefectures are not compared. It is not an outlook for any one person.
Conclusion
In 2025, the rate of fatal accidents with the driver as first party ranked 16–19 (9.44) and 85+ (9.31) first and second per 100,000 license holders, but per 100,000 population 85+ was 1.36, 14th, and 16–19 was 1.32, 15th. The difference was fully explained by the share holding a license (0.146 at 85+, 0.140 at 16–19). At 85+, from 2015 to 2025, the rate fell to 0.512, license holders rose 1.889-fold, and the count was 0.968 times.
One thing separates them — whether the denominator is people holding a license or everyone of that age.
On hearing "older drivers have many accidents," check together whether it is per license holder, per person of that age, or the count itself.
Data and reproduction
| Data | Road Traffic Statistics, "fatal road traffic accidents and traffic law enforcement," Tables 3-1-2 and 3-1-1 (National Police Agency; e-Stat), and Population Estimates Table 3 (Statistics Bureau; e-Stat) (retrieved 26 September 2026) |
| Terms of use | e-Stat follows the Government Standard Terms of Use (Version 2.0). The ratios in this paper were created by processing them and are not figures produced by the government |
| Scope | Japan, 2015–2025 (population as of 1 October 2024) |
| Checker | 検算/M073.py (--zu also draws the figures). Every number in the text is taken from 検算/M073_output.txt |
| Raw data | The retrieved files and SOURCES.md in data/ (URL, retrieval date, SHA-256, terms of use, definitions and how calculations are set up) |
| Figures | 図/M073_zu1, 図/M073_zu2 (png, svg, English versions) |
References
- National Police Agency. Road Traffic Statistics, fatal road traffic accidents and traffic law enforcement, Tables 3-1-2 and 3-1-1 (in Japanese). e-Stat (accessed 26 September 2026). https://www.e-stat.go.jp/
- Statistics Bureau. Population Estimates, population as of 1 October each year, Table 3: population by age (5-year groups) and sex and percentage — total population (in Japanese). e-Stat (accessed 26 September 2026). https://www.e-stat.go.jp/
- Yamagishi, Y. (2026). Road Traffic Deaths in 2024 Were 2,663 by the Police 24-Hour Count, 3,221 by the Police 30-Day Count, and 3,100 by Vital Statistics — Vital Statistics Exceeds the 30-Day Count Only at 80+ (955 vs 945), and the Ratio to 24-Hour Deaths Is Largest at 80+, at 1.303 [M066]. Zenodo. https://doi.org/10.5281/zenodo.22977686
- Yamagishi, Y. (2026). Road Traffic Deaths Within 24 Hours Fell to 0.619 Times from 2015 to 2025, Though the Age Composition Alone Would Have Raised Them 1.077-Fold — The Rate Part Fell Sharply for Cyclists (0.493) and Pedestrians (0.520), Only to 0.790 for Motorcyclists, and Motorcycle Deaths at 15–24 Did Not Fall, from 94 to 95 [M067]. Zenodo. https://doi.org/10.5281/zenodo.22977762
Reference
Yamagishi, Y. (2026). Fatal Accidents with the Driver as First Party: per 100,000 License Holders, Ages 16–19 (9.44) and 85+ (9.31) Rank First and Second, but per 100,000 Population 85+ Is 1.36, 14th of 15 Age Groups [M073]. Zenodo.
DOI: 10.5281/zenodo.22978329
YOI: https://www.yamagishiyuuki.com/yoi/M073
ORCID: 0009-0006-8587-3450
PDF (English) · PDF (Japanese) · Date proof of the English PDF (OpenTimestamps .ots) · SHA256SUMS
The record page for this paper (in Japanese, with the PDFs in each language and the date proof): YOI M073. This paper is a preprint and has not been peer reviewed.