Abstract
This paper asks whether MACD and a moving-average cross share a root — the answer is that the zero cross is the same expression, while the signal-line cross is a different one. It claims neither a new mathematical theorem nor a new law.
First, the zero cross of the MACD line and the cross of exponential moving averages disagree 0 times across 144,415 comparisons in four series. The difference in directional information is 0.000000 pips. They are not close; they are the same (Section 3).
Second, and this is the core of the paper, the same 0 appears on a synthetic random walk. The agreement is therefore not a property of the market but a property of the expression (Section 6).
Third, the signal-line cross is a different expression. It agrees with a simple moving-average cross 60.3419% of the time and with the zero cross of the MACD line between 58.1683% and 57.7283% (Section 3).
Fourth, the cross of exponential and of simple moving averages agree 86.3268% of the time. At the same periods, changing only the kind of smoothing produces that much disagreement (Section 3).
Fifth, holding the ratio and multiplying the periods by eight moves the zero cross's interval divided by the slow period by only 1.1184. A market-intrinsic period would give 8.00. The signal-line cross, by contrast, moves by 2.6977, because only the signal period of 9 was held fixed (Section 4).
Sixth, on the directional side the daily t reaches 2 in absolute value in 1 of the 16 cells with overlap allowed (chance gives about 0.7), and in 0 of 16 once the overlap is removed (Section 5).
Scope of this paper (scope note): No new mathematical theorem and no new law is claimed — the definition of MACD, exponential moving averages and random walks are all known. That the agreement of Section 3 follows from the definition is also known. What this paper adds is only to confirm it by count and to place a random walk beside it. No particular product or proponent is discussed — no real course, author, or vendor is the subject here, and none is named. What is treated is the public indicator itself. Trading is not discussed — what is measured is directional information, not trading performance including commissions, fills and money management. The scope is intraday and a small number of instruments — four series, six years, one-hour bars. This paper does not contradict results documented at longer holding periods, such as monthly time-series momentum. Readings of the histogram are not treated — peaks, troughs and divergence are not questions about crosses and lie outside this paper. No forecast is claimed. Relation to earlier papers: Paper 300 showed that whether two things share a root is decidable, and that numerical closeness alone is not accepted as a shared root — this paper applies three of its five criteria to a market indicator. Paper 264 showed that a threshold belongs to its lattice. F001 of this series showed that the interval of a moving-average cross comes from the ratio of the two periods — Section 4 extends that measurement to four signals. What is added here is deciding the shared root by a count of disagreements, making the same decision on a synthetic random walk so that agreement from the expression is separated out, and measuring how fixing just one of three periods breaks the structure of the ratio.
1. Notation and the question
MACD is built from three lines.
| Line | Definition |
|---|---|
| MACD line | fast exponential moving average (12) − slow exponential moving average (26) |
| Signal line | exponential moving average (9) of the MACD line |
| Histogram | MACD line − signal line |
Two readings are used: the MACD line crossing zero (the zero cross) and the MACD line crossing the signal line (the signal-line cross).
Observation 1.1: the MACD line is "fast exponential average minus slow exponential average". Therefore the MACD line being above zero and the fast exponential average being above the slow one are the same condition. This follows from the definition.
Observation 1.2: but "follows from the definition" and "agrees in practice" are different. In an implementation, how the smoothing is initialised and how values are rounded can produce disagreements. So it is confirmed by count.
Question: do MACD and a moving-average cross share a root?
Observation 1.3: Paper 300 set out five criteria for deciding a shared root. This paper measures three.
Criterion 1 — whether the two move together when a variable is moved (Section 4).
Criterion 2 — whether they agree as expressions. Numerical closeness alone is not accepted (Section 3).
Criterion 5 — how many agree and how many disagree (Sections 3 and 5).
The remaining two — Criterion 3, the route, and Criterion 4, what the quantity carries — are read from the definitions (Observation 3.6).
2. Writing the quantity and the design in advance
Four signals are compared.
| Symbol | Signal |
|---|---|
| A | zero cross of the MACD line (12, 26) |
| B | cross of exponential moving averages (12, 26) |
| C | signal-line cross of MACD (9) |
| D | cross of simple moving averages (12, 26) |
Prediction (written before measuring): A and B should be the same expression, so the disagreements should number 0. C and D are different expressions; how far they agree cannot be known without measuring.
Four quantities are measured: the count of disagreements; the median crossing interval; the directional information; and the response to moving the periods.
```
D = mean( sign of the signal × the price move over the next 24 bars ) in pips
```
Design (declared before running and unchanged at run time)
| Item | Decision |
|---|---|
| Bars | one hour, mid price, closing value of completed bars only |
| Instruments | USDJPY, EURUSD, GBPUSD, XAUUSD |
| Period | 2019–2024. Selection 2019–2021 / evaluation 2022–2024 |
| Horizon | 24 bars (twenty-four hours) |
| Family of periods | (6,13) (12,26) (24,52) (48,104). The ratio is held while the sizes are multiplied by eight |
| Cost | the median spread of the same bars is always reported alongside |
The bar counts are 36,534 for USDJPY, 36,554 for EURUSD, 36,535 for GBPUSD and 34,892 for XAUUSD.
3. Criterion 2, identity — do they agree as expressions?
Calculation 3.1 Counts of disagreement (comparing only where both are non-zero)
| Instrument | Pair | Compared | Disagreements | Agreement |
|---|---|---|---|---|
| USDJPY | A and B | 36,509 | 0 | 100.0000% |
| USDJPY | C and D | 36,501 | 14,298 | 60.8285% |
| USDJPY | A and C | 36,501 | 15,269 | 58.1683% |
| USDJPY | B and D | 36,509 | 5,033 | 86.2144% |
| EURUSD | A and B | 36,529 | 0 | 100.0000% |
| EURUSD | C and D | 36,521 | 14,593 | 60.0422% |
| EURUSD | A and C | 36,521 | 15,133 | 58.5636% |
| EURUSD | B and D | 36,529 | 4,894 | 86.6024% |
| GBPUSD | A and B | 36,510 | 0 | 100.0000% |
| GBPUSD | C and D | 36,502 | 14,467 | 60.3666% |
| GBPUSD | A and C | 36,502 | 15,430 | 57.7283% |
| GBPUSD | B and D | 36,510 | 4,951 | 86.4393% |
| XAUUSD | A and B | 34,867 | 0 | 100.0000% |
| XAUUSD | C and D | 34,859 | 13,833 | 60.3173% |
| XAUUSD | A and C | 34,859 | 14,679 | 57.8904% |
| XAUUSD | B and D | 34,867 | 4,850 | 86.0900% |
Observation 3.2: A and B disagree 0 times across the four series. The comparisons number 36,509, 36,529, 36,510 and 34,867, or 144,415 in total.
Observation 3.3: zero is not "almost agreeing". Not a single difference means one expression written two ways. Criterion 2 of Paper 300 exists precisely to decide this.
Observation 3.4: C and D agree between 60.0422% and 60.8285% (median 60.3419%). They disagree four times in ten. The signal-line cross and the simple moving-average cross are different expressions.
Observation 3.5: B and D agree between 86.0900% and 86.6024% (median 86.3268%). Even at the same periods of 12 and 26, exponential against simple smoothing alone produces that much disagreement.
Observation 3.6: the remaining two criteria can be read from the definitions. Criterion 3, the route — A and B both come from "the difference of two smoothings" and their routes are the same; C comes from "the difference against a further smoothing of that difference" and has one step more. Criterion 4, what the quantity carries — A, B and D all carry the dimension of price, and so does C. None of the four separate on dimension. What separates them is the route and the expression.
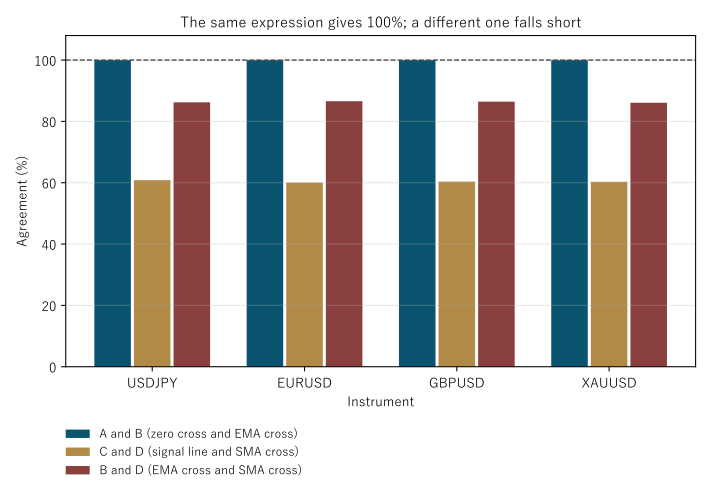
Figure 2: the agreement of three pairs by instrument. The dashed line marks 100%. Only A and B reach it.
4. Criterion 1, moving a variable — multiplying the periods by eight
The ratio 26 ÷ 12 is held while the sizes are multiplied by eight.
Calculation 4.1 Median crossing interval (mean of the four series)
| Fast | Slow | A interval | B interval | C interval | D interval | A ÷ slow | C ÷ slow |
|---|---|---|---|---|---|---|---|
| 6 | 13 | 9.5 | 9.5 | 7.2 | 9.0 | 0.7308 | 0.5577 |
| 12 | 26 | 20.2 | 20.2 | 10.8 | 19.2 | 0.7788 | 0.4135 |
| 24 | 52 | 42.5 | 42.5 | 15.5 | 38.8 | 0.8173 | 0.2981 |
| 48 | 104 | 82.4 | 82.4 | 21.5 | 78.0 | 0.7921 | 0.2067 |
Observation 4.2: A and B agree to one decimal place in all four rows (9.5, 20.2, 42.5, 82.4). What Section 3 found appears again in a different quantity.
Observation 4.3: A's interval divided by the slow period moves by only 1.1184. The sizes were multiplied by 8, so a market-intrinsic period would give 8.00. The interval is made by the ratio of the two periods (the same shape as F001).
Observation 4.4: C, by contrast, moves by 2.6977. The signal period of 9 was held fixed while the two MACD periods were multiplied by eight. Fixing one of three periods breaks the structure of the ratio.
Observation 4.5: this is a trap specific to MACD. Saying "double the MACD settings" gives a different indicator depending on whether the 9 is doubled too. This paper held the 9 fixed, following standard use.
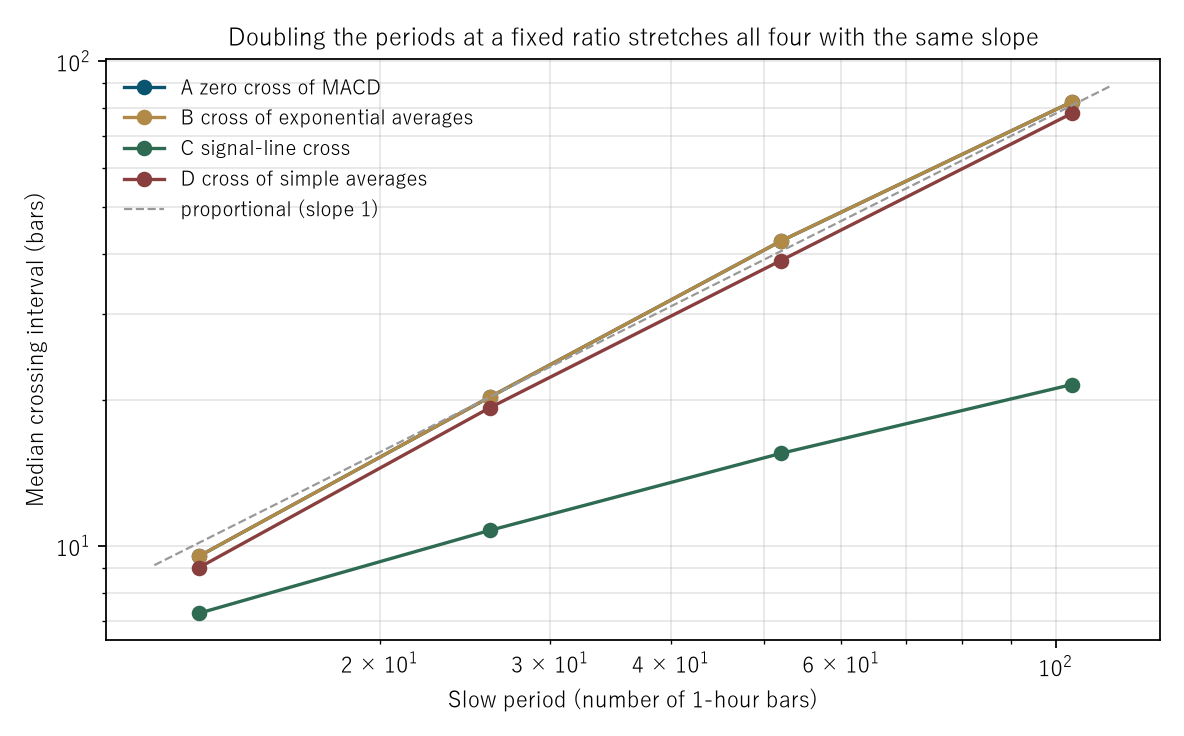
Figure 1: log–log. A, B and D fall on straight lines of slope 1. Only C lies flat, because its signal period was held fixed.
5. Criterion 5, the count of mappings — directional information
Calculation 5.1 Directional information of the four signals (evaluation period, 24 bars ahead)
| Instrument | Signal | Count | D (overall) | Dd (daily) | Daily t | Per day | spr |
|---|---|---|---|---|---|---|---|
| USDJPY | A | 17,841 | 0.0576 | 0.8617 | 0.39 | 24.0 | 0.60 |
| USDJPY | B | 17,841 | 0.0576 | 0.8617 | 0.39 | 24.0 | 0.60 |
| USDJPY | C | 17,841 | 3.4049 | 3.8890 | 2.03 | 24.0 | 0.60 |
| USDJPY | D | 17,841 | −0.1702 | −0.0240 | −0.01 | 24.0 | 0.60 |
| EURUSD | A | 17,867 | 0.4365 | 1.3125 | 1.09 | 24.0 | 0.30 |
| EURUSD | B | 17,867 | 0.4365 | 1.3125 | 1.09 | 24.0 | 0.30 |
| EURUSD | C | 17,867 | −0.0118 | −0.0871 | −0.09 | 24.0 | 0.30 |
| EURUSD | D | 17,867 | 0.6436 | 1.6519 | 1.45 | 24.0 | 0.30 |
| GBPUSD | A | 17,850 | 0.6296 | 0.8859 | 0.54 | 24.0 | 0.90 |
| GBPUSD | B | 17,850 | 0.6296 | 0.8859 | 0.54 | 24.0 | 0.90 |
| GBPUSD | C | 17,850 | −0.1914 | 0.2989 | 0.22 | 24.0 | 0.90 |
| GBPUSD | D | 17,850 | 0.6445 | 0.9341 | 0.60 | 24.0 | 0.90 |
| XAUUSD | A | 17,471 | −3.3894 | −5.3779 | −1.16 | 23.0 | 3.57 |
| XAUUSD | B | 17,471 | −3.3894 | −5.3779 | −1.16 | 23.0 | 3.57 |
| XAUUSD | C | 17,471 | 2.0300 | 2.5616 | 0.64 | 23.0 | 3.57 |
| XAUUSD | D | 17,471 | −0.1950 | −0.8392 | −0.19 | 23.0 | 3.57 |
Observation 5.2: the difference in directional information between A and B is at most 0.000000 pips. The count, the overall mean, the daily mean and the t all come out the same in all four series.
Observation 5.3: C and D differ by at most 3.575108 pips. A different expression gives a different answer.
Observation 5.4: the daily t reaches 2 in absolute value in 1 of the 16 cells. By chance about 0.7 would be expected, so one is neither clearly many nor clearly few.
Calculation 5.5 Removing the overlap (evaluation period)
The horizon is 24 bars while entries are taken every hour, so one observation every 24 bars is kept.
| Instrument | Signal | Count with overlap | D | Daily t | Count without | D | t |
|---|---|---|---|---|---|---|---|
| USDJPY | A | 17,841 | 0.0576 | 0.39 | 744 | 1.5620 | 0.44 |
| USDJPY | C | 17,841 | 3.4049 | 2.03 | 744 | 0.9817 | 0.27 |
| USDJPY | D | 17,841 | −0.1702 | −0.01 | 744 | 2.4593 | 0.69 |
| EURUSD | A | 17,867 | 0.4365 | 1.09 | 745 | −1.0935 | −0.55 |
| EURUSD | C | 17,867 | −0.0118 | −0.09 | 745 | −0.6646 | −0.34 |
| EURUSD | D | 17,867 | 0.6436 | 1.45 | 745 | −0.0905 | −0.05 |
| GBPUSD | A | 17,850 | 0.6296 | 0.54 | 744 | −0.8772 | −0.34 |
| GBPUSD | C | 17,850 | −0.1914 | 0.22 | 744 | 2.8359 | 1.09 |
| GBPUSD | D | 17,850 | 0.6445 | 0.60 | 744 | 0.4266 | 0.16 |
| XAUUSD | A | 17,471 | −3.3894 | −1.16 | 728 | 1.1883 | 0.17 |
| XAUUSD | C | 17,471 | 2.0300 | 0.64 | 728 | 7.6593 | 1.09 |
| XAUUSD | D | 17,471 | −0.1950 | −0.19 | 728 | 4.0804 | 0.58 |
Observation 5.6: the cells with a daily t above 2 in absolute value fall from 1 of 16 to 0 of 16. The one that stood, USDJPY's C, falls from 2.03 to 0.27.
Observation 5.7: the count falls from 17,841 to 744. The power of the test falls sharply. "Down to 0" is not "there is none"; it is not visible at this count.
6. The baseline — is the agreement a property of the market or of the expression?
Section 3 found A and B agreeing with 0 disagreements. Whether that says anything about the market is checked.
Calculation 6.1 The same decision on synthetic random walks (10 realisations, evaluation period)
| Instrument | Random-walk disagreements, A and B | Random-walk agreement, C and D | Measured agreement, C and D |
|---|---|---|---|
| USDJPY | 0 | 60.9298% | 60.8285% |
| EURUSD | 0 | 60.9321% | 60.0422% |
| GBPUSD | 0 | 60.9309% | 60.3666% |
| XAUUSD | 0 | 60.9097% | 60.3173% |
Observation 6.2: on random walks A and B also disagree 0 times. The agreement therefore says nothing about the market. It is a property of the expression.
Observation 6.3: the agreement of C and D is also nearly the same on random walks (60.9097% to 60.9321%) as measured (60.0422% to 60.8285%). The four-in-ten disagreement also comes from the difference between two expressions, not from the market.
Observation 6.4: without this section, the zero of Section 3 could be read as "in a market, MACD and a moving average move together". Applying the same measurement to a series that is not a market removes that reading.
7. Splitting by session
Design: five non-overlapping bins in Coordinated Universal Time. The signal is the signal-line cross (C).
Calculation 7.1 Directional information in each of the five bins (evaluation period)
| Instrument | Tokyo 0–7 | London 7–12 | Overlap 12–16 | NY late 16–21 | Night 21–24 |
|---|---|---|---|---|---|
| USDJPY | 3.45 (t 1.25) | 4.93 (t 1.46) | 1.33 (t 0.48) | 2.04 (t 0.86) | 5.68 (t 1.98) |
| EURUSD | −0.94 (t −0.60) | 0.50 (t 0.26) | −1.93 (t −1.02) | 0.92 (t 0.37) | 2.45 (t 1.46) |
| GBPUSD | −0.73 (t −0.36) | 0.70 (t 0.34) | −0.97 (t −0.35) | −0.70 (t −0.25) | 1.51 (t 0.83) |
| XAUUSD | 3.73 (t 0.72) | 10.97 (t 1.91) | 2.37 (t 0.45) | −7.22 (t −1.10) | −4.18 (t −0.53) |
Observation 7.2: the daily t reaches 2 in absolute value in 0 of the 20 cells. By chance about 0.9 would be expected, so the measured figure is below it.
Observation 7.3: this table does not remove the overlap. In Section 5, removing it dropped the same kind of t from 1 to 0. The session table must be discounted by the same amount. Here it is already 0 before correction, so the direction of the conclusion does not change.
8. Limitations
- Only one implementation is used. Exponential moving averages can be initialised in several ways (from the simple average of the first n bars, from the first value, and so on), and one was fixed. Under another convention A and B might not disagree 0 times. That would be a difference of initialisation, not of expression.
- The signal period was held fixed. The structure of the ratio broke for C in Section 4 because the 9 was held. The version where the 9 is multiplied too was not measured.
- Readings of the histogram are not treated. Peaks, troughs and divergence are not questions about crosses.
- Removing the overlap leaves 744 observations. At that count even an effect several times the spread would not be visible.
- Only one lattice is used. Bars are fixed at one hour.
- The synthetic baseline uses independent normal increments. Volatility clustering is not included.
- Four instruments over six years. Nothing is said about other markets or other periods.
Conclusion
MACD and a moving-average cross are spoken of as separate indicators. But the zero cross of the MACD line and the cross of exponential moving averages did not differ once in 144,415 comparisons. The difference in directional information was 0.000000 pips. They are not close. They are the same expression.
And the same zero appears on a synthetic random walk. So the agreement says nothing about the market.
The signal-line cross, meanwhile, is a different expression and disagrees with a simple moving-average cross four times in ten. Under one name, MACD, live something that shares a root and something that does not.
One thing separates the cases — having the same name and having the same expression. The name is one; the expressions are two.
Data and reproduction
| Data | Currency ticks from Dukascopy (agreement to the millisecond, bid and ask, verified from 2019 onward). Gold from Dukascopy |
| Period | 2019–2024 (six years). Selection 2019–2021 / evaluation 2022–2024 |
| Instruments | USDJPY, EURUSD, GBPUSD, XAUUSD |
| Bars | One hour, mid price, closing value of completed bars only. Bars with no ticks are not created |
| Verification | 検算/F005.py (with --zu it also writes the figures). Every number in the text is taken from 検算/F005_output.txt |
| Figures | 図/F005_zu1, 図/F005_zu2 (png, svg, English versions) |
| Random seeds | Fixed at 0–19. Re-running gives the same values |
| Audit of the foundation | _ツール/audit_bars.py (look-ahead in the bars, daylight saving, the day boundary). The record is _土台の検査.txt |
References
- Yamagishi, Y. (2026). Inside One Phenomenon Live a Number That Moves with the Lattice and a Number That Does Not [Paper 264]. Zenodo. 10.5281/zenodo.22169720
- Yamagishi, Y. (2026). The Three Hundredth Census: Whether Two Things Share a Root Is Decidable [Paper 300]. Zenodo. 10.5281/zenodo.22171914
- Yamagishi, Y. (2026). The Period a Moving-Average Crossover Finds Is Made by the Ratio of the Two Periods [F001]. Zenodo. 10.5281/zenodo.22880428
Reference
Yamagishi, Y. (2026). The Zero Cross of MACD Is the Same Thing as a Moving-Average Cross [F005]. Zenodo.
DOI: 10.5281/zenodo.22881227
YOI: https://www.yamagishiyuuki.com/yoi/F005
ORCID: 0009-0006-8587-3450
PDF (English) · PDF (Japanese) · Date proof of the English PDF (OpenTimestamps .ots) · SHA256SUMS
The record page for this paper (in Japanese, with the PDFs in each language and the date proof): YOI F005. This paper is a preprint and has not been peer reviewed.