Abstract
This paper asks whether the %K of stochastics carries anything beyond "the position in the range" — the answer is that it carries almost nothing beyond it. It claims neither a new mathematical theorem nor a new law.
First, %K and "(close − recent low) ÷ (recent high − recent low)" differ by at most 0.00e+00 across 144,463 comparisons in four series. Not one differs. They are the same expression under two names (Section 3).
Second, and this is the core of the paper, in the bin where %K is 80 or above, the share touching the recent high before the recent low is 94.0897%. But the mean position in that bin is 90.3830%. The touch rate is a restatement of the position, and 94% is not a surprising number (Section 4).
Third, across all twenty bins the median gap between touch rate and position is +1.0445 points (minimum −4.0244, maximum +6.2701). Against a position that itself runs from 9.6382% to 90.3830%, the remainder is more than an order of magnitude smaller (Section 4).
Fourth, that small remainder is not reproduced by a synthetic random walk, where the gap is 0.1001 to 0.1946 points. The remainder is real — and more than an order of magnitude smaller than the position itself (Sections 4 and 7).
Fifth, on the directional side the daily t reaches 2 in absolute value in 2 of the 4 cells (chance gives about 0.2), and 0 of 4 once the overlap is removed (Sections 5 and 7).
Sixth, moving the thresholds from 70 to 90 and the period from 5 to 21 moves the share selected, but both are quantities set by the person choosing (Section 6).
Scope of this paper (scope note): No new mathematical theorem and no new law is claimed — the definition of stochastics, the optional stopping theorem and random walks are all known. That %K is an expression for the position also follows from the definition. What this paper adds is to confirm it by count, to place the touch rate beside the position, and to compare with a random walk. No particular product or proponent is discussed — no real course, author, or vendor is the subject here, and none is named. What is treated is the public indicator itself. Trading is not discussed — what is measured is directional information, not trading performance including commissions, fills and money management. The scope is intraday and a small number of instruments — four series, six years, one-hour bars. This paper does not contradict results documented at longer holding periods, such as monthly time-series momentum. Crosses of %D and %K are not treated — a cross of two lines is not a question about position and lies outside this paper. No forecast is claimed. Relation to earlier papers: Paper 423 showed that a touch-probability table can be right while the trade still loses, and that a touch rate must always be read beside the position — this paper applies that reading to another indicator. Paper 264 showed that a threshold belongs to its lattice. F005 of this series showed that the zero cross of MACD is the same expression as a moving-average cross — this paper measures the same shape on another indicator, %K. What is added here is confirming the identity of %K and position by count, placing the touch rate beside the position and reporting the gap bin by bin, and measuring the same gap on a synthetic random walk, so that the reality of the remainder and its size are separated.
1. Notation and the question
Stochastics is built as follows.
| Line | Definition |
|---|---|
| %K | 100 × (close − lowest low of the last n bars) ÷ (highest high of the last n bars − lowest low of the last n bars) |
| %D | 3-bar simple moving average of %K |
A period of 14 is widely used. The common reading is "80 or above is overbought, 20 or below is oversold".
Observation 1.1: the expression for %K writes down directly where the close sits inside the span of the recent high and low. This follows from the definition.
Observation 1.2: something must be watched here. The position carries a meaning that comes from the optional stopping theorem. In a process without drift, the closer one is to the upper edge, the higher the probability of touching the upper edge first. And that probability equals the position itself.
Observation 1.3: so "when %K is 90, the probability of touching the upper edge first is 90%" is not surprising. When a rate is reported, what it would be by chance must always be reported alongside. Here that "by chance" figure is the position.
Question: does %K carry anything beyond a restatement of the position?
2. Writing the quantity and the design in advance
Three quantities are measured.
① the touch rate — the share touching the highest high of the last n bars before the lowest low.
② the position — %K itself, the thing to compare ① against.
③ directional information —
```
D = mean( sign of the signal × the price move over the next h bars ) in pips
```
The signal is −1 (sell) when %K is 80 or above, +1 (buy) when 20 or below, and 0 between them. This is the mean-reverting reading. The trend-following reading is its sign flipped and is not measured.
Design (declared before running and unchanged at run time)
| Item | Decision |
|---|---|
| Indicator | %K, period 14 |
| Bars | one hour, mid price, closing value of completed bars only |
| Instruments | USDJPY, EURUSD, GBPUSD, XAUUSD |
| Period | 2019–2024. Selection 2019–2021 / evaluation 2022–2024 |
| Horizon | h = 14 (one period) |
| Separator | whether the touch rate is read beside the position |
| Deciding a touch | within the 14 bars after the bar, whether the highest high of the last 14 bars or the lowest low is touched first. If neither is touched, the case is "undecided" and dropped |
| Thresholds | 30/70, 20/80, 10/90 (standard is 20/80) |
| Period n | 5, 14, 21 (standard is 14) |
Observation 2.1: dropping the undecided cases can bias the result. The nearer edge is touched first more easily, so among the decided cases the nearer side is over-represented. This bias is handled by the baseline of Section 7: the same truncation is applied to the random walk.
The bar counts are 36,534 for USDJPY, 36,554 for EURUSD, 36,535 for GBPUSD and 34,892 for XAUUSD.
3. Is %K the same expression as the position?
Calculation 3.1 The difference between %K and the position
| Instrument | Compared | Maximum difference | Cases above 1e-9 |
|---|---|---|---|
| USDJPY | 36,521 | 0.00e+00 | 0 |
| EURUSD | 36,541 | 0.00e+00 | 0 |
| GBPUSD | 36,522 | 0.00e+00 | 0 |
| XAUUSD | 34,879 | 0.00e+00 | 0 |
Observation 3.2: across 144,463 comparisons in four series, the maximum difference is 0.00e+00. Not one differs.
Observation 3.3: this is not a discovery; it follows from the definition. What this paper adds is only to confirm it by count. Confirming it is still worth doing — everything that follows stands on the premise that %K is the position.
4. Reading the touch rate beside the position — this is the separator
Calculation 4.1 Touch rate and position by %K bin (evaluation period)
| Instrument | %K bin | Count | Touch rate | Mean position | Gap (points) |
|---|---|---|---|---|---|
| USDJPY | 0–20 | 2,412 | 7.5456% | 10.4455% | −2.8999 |
| USDJPY | 20–40 | 2,511 | 25.7268% | 29.7512% | −4.0244 |
| USDJPY | 40–60 | 2,399 | 50.1042% | 50.1165% | −0.0123 |
| USDJPY | 60–80 | 3,060 | 76.8954% | 70.6253% | +6.2701 |
| USDJPY | 80–100 | 4,636 | 94.0897% | 90.3830% | +3.7068 |
| EURUSD | 0–20 | 3,527 | 7.1732% | 9.6480% | −2.4747 |
| EURUSD | 20–40 | 2,582 | 27.2270% | 29.5001% | −2.2732 |
| EURUSD | 40–60 | 2,516 | 50.5167% | 49.9601% | +0.5566 |
| EURUSD | 60–80 | 2,620 | 74.5420% | 70.4964% | +4.0456 |
| EURUSD | 80–100 | 3,470 | 92.8818% | 90.2339% | +2.6480 |
| GBPUSD | 0–20 | 3,414 | 6.9420% | 9.6382% | −2.6962 |
| GBPUSD | 20–40 | 2,650 | 26.6038% | 29.6512% | −3.0475 |
| GBPUSD | 40–60 | 2,447 | 51.6551% | 50.1226% | +1.5325 |
| GBPUSD | 60–80 | 2,774 | 73.2877% | 70.4117% | +2.8759 |
| GBPUSD | 80–100 | 3,568 | 92.9372% | 90.3706% | +2.5667 |
| XAUUSD | 0–20 | 2,879 | 6.4953% | 10.3655% | −3.8702 |
| XAUUSD | 20–40 | 2,585 | 27.1180% | 29.5490% | −2.4310 |
| XAUUSD | 40–60 | 2,352 | 52.3810% | 50.0242% | +2.3568 |
| XAUUSD | 60–80 | 2,818 | 73.7048% | 70.2498% | +3.4550 |
| XAUUSD | 80–100 | 3,623 | 93.4309% | 89.9499% | +3.4810 |
Observation 4.2: in the bin where %K is 80 or above, the touch rate reaches 94.0897%. Stopping here reads as "stochastics is right nine times in ten".
Observation 4.3: but the mean position in that bin is 90.3830%. The touch rate simply sits on the position, and the gap is only 3.7068 points.
Observation 4.4: a touch rate of 94.0897% must not be compared with 50%. The thing to compare it with is the position, 90.3830%. Against 50% it looks like a gap of 44 points; against the position it is 3.7068 points. Which denominator is chosen changes the story more than tenfold.
Observation 4.5: across all twenty bins the median gap is +1.0445 points (minimum −4.0244, maximum +6.2701). The position itself runs from 9.6382% to 90.3830%, so the remainder is more than an order of magnitude smaller.
Observation 4.6: the gap has a shape. The two lower bins (0–20 and 20–40) are negative in all four series, and the two upper bins (60–80 and 80–100) are positive in all four. The higher the position, the further above what the position says price goes. That is the trend-following direction.
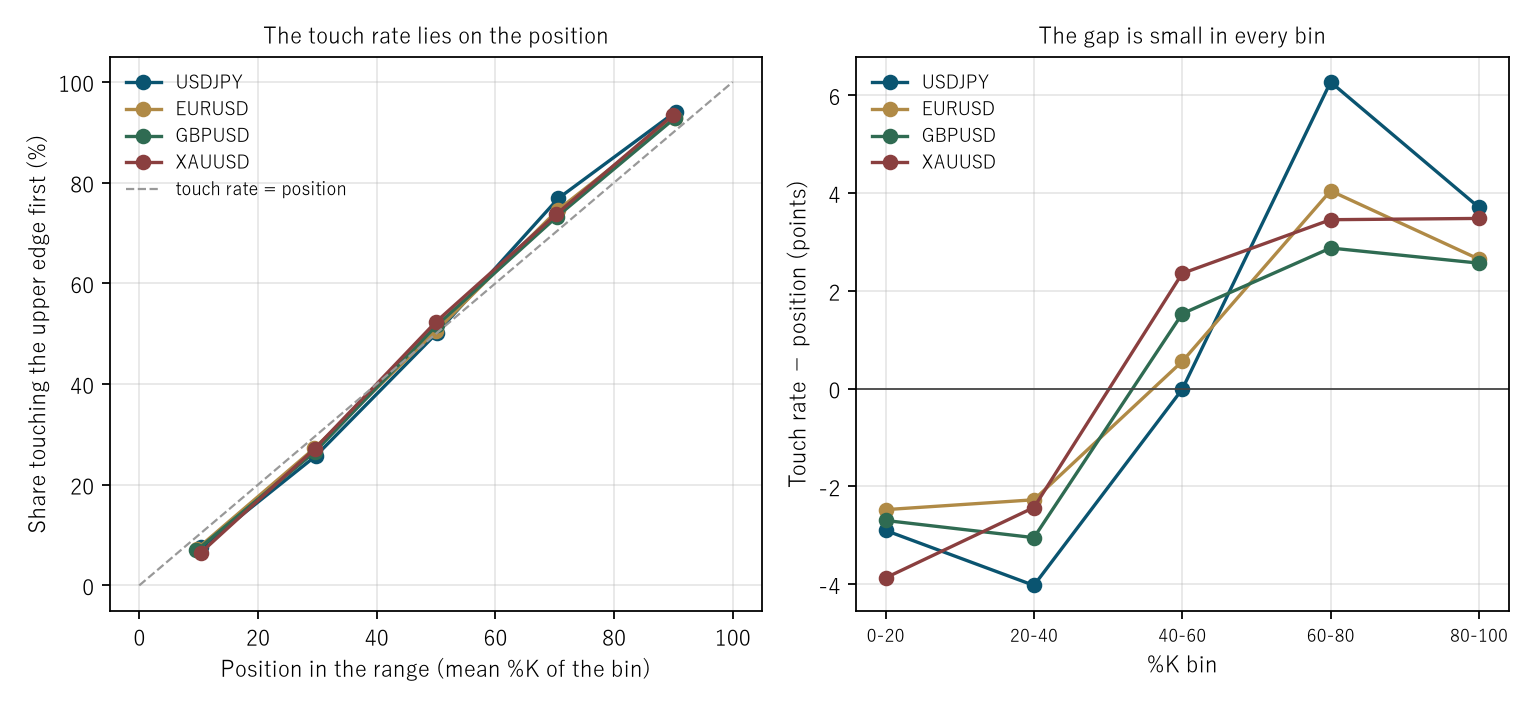
Figure 1: on the left the touch rate against the position (the dashed line marks "touch rate = position"); on the right the gap. The points lie almost on the dashed line and the gap stays within a band from −4 to +6 points.
5. Directional information
Calculation 5.1 Measuring with the mean-reverting signal (h = 14)
| Instrument | Period | Count | D (overall) | Dd (daily) | Daily t | Per day | spr |
|---|---|---|---|---|---|---|---|
| USDJPY | selection | 7,566 | −1.4198 | 1.3609 | 1.71 | 9.0 | 0.30 |
| USDJPY | evaluation | 7,857 | −4.3700 | −0.8046 | −0.46 | 9.0 | 0.60 |
| EURUSD | selection | 8,029 | 1.2200 | 2.8119 | 4.15 | 9.0 | 0.30 |
| EURUSD | evaluation | 7,874 | 1.3966 | 3.0813 | 3.65 | 9.0 | 0.30 |
| GBPUSD | selection | 8,247 | −0.4876 | 2.2540 | 2.06 | 10.0 | 0.90 |
| GBPUSD | evaluation | 7,864 | 1.2378 | 3.6650 | 3.26 | 9.0 | 0.90 |
| XAUUSD | selection | 6,882 | −6.4170 | 4.6595 | 1.59 | 8.0 | 3.37 |
| XAUUSD | evaluation | 7,384 | −5.5671 | 3.7955 | 1.23 | 9.0 | 3.57 |
Observation 5.2: in the evaluation period the daily t reaches 2 in absolute value in 2 of the 4 cells. By chance about 0.2 would be expected, so stopping here reads as "it works".
Observation 5.3: the absolute value of the overall mean exceeds the spread in all four series.
Observation 5.4: yet the overall mean and the daily mean disagree in sign in some cells. USDJPY in the selection period is −1.4198 overall and 1.3609 daily; XAUUSD in the evaluation period is −5.5671 and 3.7955. Days with many observations are making the overall mean.
Observation 5.5: and there are 8.0 to 10.0 entries a day against a horizon of 14 bars. The shape that should prompt suspicion of overlap is present (Section 7).
6. Moving the thresholds and the period
Calculation 6.1 Moving the thresholds (evaluation period, n = 14)
| Instrument | 30/70 share | 30/70 D | 20/80 share | 20/80 D | 10/90 share | 10/90 D |
|---|---|---|---|---|---|---|
| USDJPY | 64.1646% | −3.7989 | 44.0302% | −4.3700 | 21.5281% | −5.8229 |
| EURUSD | 63.4118% | 1.1003 | 44.0668% | 1.3966 | 22.3464% | 2.2414 |
| GBPUSD | 63.4833% | 0.7755 | 44.0472% | 1.2378 | 22.3509% | 1.5719 |
| XAUUSD | 63.3095% | −3.3704 | 42.2578% | −5.5671 | 19.6456% | −5.8436 |
Calculation 6.2 Moving the period (evaluation period, thresholds 20/80)
| Instrument | n=5 share | n=5 D | n=14 share | n=14 D | n=21 share | n=21 D |
|---|---|---|---|---|---|---|
| USDJPY | 42.1383% | −0.9813 | 44.0302% | −4.3700 | 45.0434% | −6.6558 |
| EURUSD | 43.5079% | 0.2794 | 44.0668% | 1.3966 | 43.7874% | 0.0611 |
| GBPUSD | 43.5773% | 0.5485 | 44.0472% | 1.2378 | 43.4989% | 1.0924 |
| XAUUSD | 41.2918% | −0.9963 | 42.2578% | −5.5671 | 41.9548% | −3.9114 |
Observation 6.3: moving the thresholds from 70 to 90 cuts the share selected from 64.1646% to 21.5281%, by a third. The threshold decides how far toward the edge a situation must be to be picked up.
Observation 6.4: moving the period from 5 to 21, by contrast, moves the share only between 41.2918% and 45.0434%. Because %K is the position, changing the period barely changes how much of the time price sits near an edge. What moves it is the threshold.
Observation 6.5: yet the directional information moves a great deal with the period (USDJPY from −0.9813 to −6.6558). The share not moving while D does means the contents of what is picked up have changed.
7. Removing the overlap — and the baseline
Calculation 7.1 Measuring again with non-overlapping windows (evaluation period)
| Instrument | Count with overlap | D | Daily t | Count without | D | t |
|---|---|---|---|---|---|---|
| USDJPY | 7,857 | −4.3700 | −0.46 | 544 | −4.4593 | −1.06 |
| EURUSD | 7,874 | 1.3966 | 3.65 | 545 | −0.4854 | −0.32 |
| GBPUSD | 7,864 | 1.2378 | 3.26 | 565 | 2.9485 | 1.07 |
| XAUUSD | 7,384 | −5.5671 | 1.23 | 506 | −9.2515 | −0.70 |
Observation 7.2: the cells with a daily t above 2 in absolute value fall from 2 of 4 to 0 of 4. EURUSD falls from 3.65 to −0.32, and its sign changes as well.
Observation 7.3: the count falls from 7,857 to 544. The power of the test falls sharply. "Down to 0" is not "there is none"; it is not visible at this count.
Calculation 7.4 The baseline — synthetic series whose within-bar movement is also random (20 realisations, evaluation period)
| Instrument | Measured D | Median random D | Random minimum | Random maximum | Inside? | Random touch rate − position |
|---|---|---|---|---|---|---|
| USDJPY | −4.3700 | −0.0935 | −1.7048 | 4.3591 | no | 0.1594 |
| EURUSD | 1.3966 | −0.0437 | −1.1456 | 2.9371 | yes | 0.1946 |
| GBPUSD | 1.2378 | −0.0983 | −1.6868 | 4.3034 | yes | 0.1612 |
| XAUUSD | −5.5671 | −0.7680 | −4.3560 | 10.2720 | no | 0.1001 |
Observation 7.5: on the random walk the gap "touch rate − position" is 0.1001 to 0.1946 points. The measured median was +1.0445. The same truncation (dropping undecided cases) is applied to the random walk, so the gap cannot be explained by that bias. The remainder of Section 4 is real.
Observation 7.6: but look at its size. The position itself runs from 9.6382% to 90.3830%. What sits on top of it has a median of +1.0445 points. Almost all of what is explained is the position; the remainder is a small amount outside it.
Observation 7.7: on the directional side, 2 of the 4 series fall outside the range of the random walk. Both that do (USDJPY −4.3700, XAUUSD −5.5671) are negative. A negative value for the mean-reverting signal concerns the trend-following side — which agrees in direction with Section 4's finding that the higher the position, the further above it price goes.
8. Splitting by session
Design: five non-overlapping bins in Coordinated Universal Time.
Calculation 8.1 Directional information in each of the five bins (evaluation period)
| Instrument | Tokyo 0–7 | London 7–12 | Overlap 12–16 | NY late 16–21 | Night 21–24 |
|---|---|---|---|---|---|
| USDJPY | −4.49 (t 0.43) | −4.57 (t 0.40) | −2.05 (t 1.36) | −3.70 (t −0.11) | −8.73 (t −1.31) |
| EURUSD | 1.39 (t 1.18) | 1.59 (t 1.60) | 2.53 (t 4.44) | 0.97 (t 2.71) | 0.23 (t 0.59) |
| GBPUSD | 0.46 (t 0.86) | 0.77 (t 2.23) | 2.79 (t 3.57) | 2.17 (t 3.13) | 0.22 (t 0.09) |
| XAUUSD | −5.83 (t 0.95) | −8.82 (t −0.07) | −7.58 (t 0.81) | −1.97 (t 2.01) | −1.68 (t −0.03) |
Observation 8.2: the daily t reaches 2 in absolute value in 6 of the 20 cells. By chance about 0.9 would be expected, so the measured figure is far above it.
Observation 8.3: but this table does not remove the overlap. In Section 7, removing it dropped the same kind of t from 2 to 0. The figure of six cannot be read as it stands.
Observation 8.4: five of the six are EURUSD and GBPUSD and cluster in the overlap session (12–16). The directional information itself is 2.53 and 2.79 pips, above the spread (0.30 and 0.90), but no correction for overlap has been applied. Going further requires measuring again with the overlap removed. This paper does not do that.
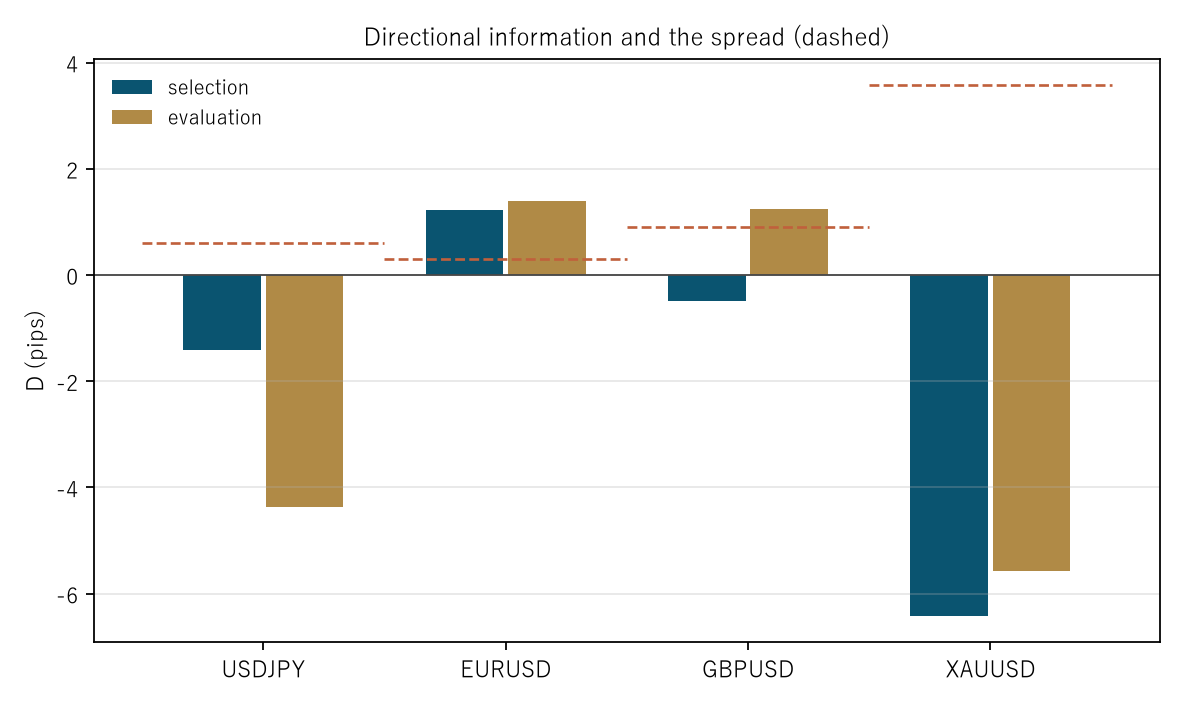
Figure 2: the bars are the directional information in the selection and evaluation periods; the dashed lines mark the spread. The signs do not agree across instruments.
9. Limitations
- Undecided cases are dropped. Situations where neither edge was touched within 14 bars leave the measurement. The bias was handled by the baseline, but the number dropped is not reported.
- Removing the overlap leaves between 506 and 565 observations. At that count even an effect several times the spread would not be visible.
- The session table is not corrected for overlap (Observation 8.3). The figure of six cannot be read as it stands.
- Crosses of %D and %K are not treated. A cross of two lines is not a question about position.
- Only one lattice is used. Bars are fixed at one hour.
- The synthetic baseline uses independent normal increments. Volatility clustering is not included. Part of the remainder of Section 4 may come from there, but that has not been measured.
- Four instruments over six years. Nothing is said about other markets or other periods.
Conclusion
When %K passes 80, the share touching the upper edge first is 94.0897%. More than nine in ten. But the mean position in those situations is 90.3830%, so the gap is only 3.7068 points.
%K and the position did not differ once in 144,463 comparisons. They are the same expression under two names. So a touch rate riding on the position is exactly what should be expected.
On top of that, the amount by which price goes further than the position says was real. The median gap across twenty bins is +1.0445 points, separating from the random walk's 0.1001 to 0.1946. But against a position that itself runs from 9.6382% to 90.3830%, the remainder is more than an order of magnitude smaller.
One thing separates the cases — when a rate is reported, whether the thing it is compared with is 50% or the position. Against 50% it looks like a gap of 44 points; against the position it is 3.7068.
And what this paper could measure is the reading that cuts %K at a threshold. About crosses with %D, nothing is answered here.
Data and reproduction
| Data | Currency ticks from Dukascopy (agreement to the millisecond, bid and ask, verified from 2019 onward). Gold from Dukascopy |
| Period | 2019–2024 (six years). Selection 2019–2021 / evaluation 2022–2024 |
| Instruments | USDJPY, EURUSD, GBPUSD, XAUUSD |
| Bars | One hour, mid price, closing value of completed bars only. Bars with no ticks are not created |
| Verification | 検算/F006.py (with --zu it also writes the figures). Every number in the text is taken from 検算/F006_output.txt |
| Figures | 図/F006_zu1, 図/F006_zu2 (png, svg, English versions) |
| Random seeds | Fixed at 0–19. Re-running gives the same values |
| Audit of the foundation | _ツール/audit_bars.py (look-ahead in the bars, daylight saving, the day boundary). The record is _土台の検査.txt |
References
- Yamagishi, Y. (2026). Inside One Phenomenon Live a Number That Moves with the Lattice and a Number That Does Not [Paper 264]. Zenodo. 10.5281/zenodo.22169720
- Yamagishi, Y. (2026). The Table Is Right and the Trade Still Loses [Paper 423]. Zenodo. 10.5281/zenodo.22700114
- Yamagishi, Y. (2026). The Zero Cross of MACD Is the Same Thing as a Moving-Average Cross [F005]. Zenodo. 10.5281/zenodo.22881227
Reference
Yamagishi, Y. (2026). The %K of Stochastics Is the Position in the Range Itself [F006]. Zenodo.
DOI: 10.5281/zenodo.22881505
YOI: https://www.yamagishiyuuki.com/yoi/F006
ORCID: 0009-0006-8587-3450
PDF (English) · PDF (Japanese) · Date proof of the English PDF (OpenTimestamps .ots) · SHA256SUMS
The record page for this paper (in Japanese, with the PDFs in each language and the date proof): YOI F006. This paper is a preprint and has not been peer reviewed.