Abstract
This paper asks whether ADX can tell which way price will go — the answer is that it cannot, in principle, because it is built from an absolute value. It claims neither a new mathematical theorem nor a new law.
First, ADX is built from the absolute value of the difference between +DI and −DI. A quantity built from an absolute value does not distinguish up from down. So a signal reading "buy because ADX is high" produces not one sell (Section 3).
Second, and this is the core of the paper, the value of that signal scatters from −4.2145 to 5.8880 pips, yet its sign agrees with the sign of the period's drift in all four series. What it picks up is the drift, not the direction (Section 4).
Third, switching to a quantity that does carry a sign (which of +DI and −DI is larger) leaves the directional information between −0.1625 and 0.7556 pips. It exceeds the spread (0.30 to 3.57 pips) in none of the four series (Section 3).
Fourth, raising the ADX threshold from 15 to 40 cuts the count to 0.1391 of itself, yet the directional information spans 2.8887 pips without settling anywhere, and the standard 25 is best in only 1 of the 4 series (Section 5).
Fifth, splitting into quintiles of ADX is not monotone in any of the four series. Splitting by a quantity without direction does not order direction (Section 5).
Sixth, in all eight cases the measurement falls inside the range of the 20 synthetic realisations. Both before and after the overlap is removed, the daily t reaches 2 in absolute value in 0 of the 8 cells (Section 6).
Scope of this paper (scope note): No new mathematical theorem and no new law is claimed — the definition of ADX, Wilder's smoothing and random walks are all known. That ADX is built from an absolute value also follows from the definition. What this paper adds is to measure the consequence. No particular product or proponent is discussed — no real course, author, or vendor is the subject here, and none is named. What is treated is the public indicator itself. Trading is not discussed — what is measured is directional information, not trading performance including commissions, fills and money management. The scope is intraday and a small number of instruments — four series, six years, one-hour bars. This paper does not contradict results documented at longer holding periods, such as monthly time-series momentum. Using ADX for exits or position sizing is not treated — "hold only while the trend is strong" is not a question about entry direction and lies outside this paper. No forecast is claimed. Relation to earlier papers: this series measures direction with D = (expectation of buying − expectation of selling) / 2, which is zero for any quantity symmetric up and down — this paper treats the case where that shape follows from the definition of the indicator itself. Paper 423 showed that comparing a rate with the wrong thing changes the conclusion. F003 showed the width of a Bollinger band and F006 the bins of %K failing to order direction, both being quantities without direction — this is the third such case, differing in that here the absence of direction is predictable from the definition. What is added is measuring what appears when a direction is given to a quantity that has none, placing that value beside the drift and counting the agreements in sign, and placing the version with a signed quantity in the same table.
1. Notation and the question
ADX is built as follows.
| Quantity | Definition |
|---|---|
| +DI | the smoothed upward movement divided by the smoothed true range (×100) |
| −DI | the smoothed downward movement divided by the same (×100) |
| DX | |+DI − −DI| ÷ (+DI + −DI) × 100 |
| ADX | DX smoothed again |
A period of 14 is widely used, and the reading is "ADX above 25 means there is a trend".
Observation 1.1: the numerator of DX is an absolute value. A strong move up and a strong move down give the same value.
Observation 1.2: the quantity this series uses to measure direction is half the difference between the expectation of buying and of selling. That quantity is zero for anything symmetric up and down. ADX has exactly that shape.
Observation 1.3: so a prediction follows. Used on its own as a signal, ADX yields no directional information. This does not mean ADX is meaningless. It means it cannot be used to pick a side.
Question: what appears when a direction is given to a quantity that has none?
2. Writing the quantity and the design in advance
Three signals are measured separately.
| Symbol | Signal | Nature |
|---|---|---|
| S | buy when ADX is 25 or above | a direction given to a quantity that has none |
| V | buy when +DI > −DI, sell otherwise | a quantity that carries a sign |
| SV | the direction of V, only when ADX is 25 or above | direction filtered by strength |
Prediction (written before measuring): S should carry no directional information. V need not be zero. Whether SV improves on V cannot be known without measuring.
```
D = mean( sign of the signal × the price move over the next 24 bars ) in pips
```
Design (declared before running and unchanged at run time)
| Item | Decision |
|---|---|
| Indicator | +DI, −DI, ADX with Wilder's smoothing, period 14 |
| Bars | one hour, mid price, closing value of completed bars only |
| Instruments | USDJPY, EURUSD, GBPUSD, XAUUSD |
| Period | 2019–2024. Selection 2019–2021 / evaluation 2022–2024 |
| Horizon | 24 bars (twenty-four hours) |
| Thresholds | 15, 20, 25, 30, 40 (standard is 25) |
| Cost | the median spread of the same bars is always reported alongside |
The bar counts are 36,534 for USDJPY, 36,554 for EURUSD, 36,535 for GBPUSD and 34,892 for XAUUSD.
3. What appears when a direction is given to a quantity that has none
Calculation 3.1 The three signals (evaluation period)
| Instrument | Signal | Count | D (overall) | Dd (daily) | Daily t | Per day | spr | Buys/sells |
|---|---|---|---|---|---|---|---|---|
| USDJPY | S | 8,443 | 3.3500 | 7.5718 | 2.54 | 12.0 | 0.60 | 8443/0 |
| USDJPY | V | 17,841 | −0.0178 | 0.1297 | 0.07 | 24.0 | 0.60 | 8974/8867 |
| USDJPY | SV | 8,443 | −0.4489 | −0.1695 | −0.06 | 12.0 | 0.60 | 3977/4466 |
| EURUSD | S | 8,434 | −4.2145 | −3.9415 | −2.42 | 13.0 | 0.30 | 8434/0 |
| EURUSD | V | 17,867 | 0.7556 | 1.5534 | 1.41 | 24.0 | 0.30 | 8812/9055 |
| EURUSD | SV | 8,434 | 1.2996 | −0.5684 | −0.38 | 13.0 | 0.30 | 3818/4616 |
| GBPUSD | S | 8,001 | −1.9193 | −1.9903 | −0.83 | 12.0 | 0.90 | 8001/0 |
| GBPUSD | V | 17,850 | −0.1625 | 0.3036 | 0.20 | 24.0 | 0.90 | 8831/9019 |
| GBPUSD | SV | 8,001 | −1.4643 | −3.6395 | −1.63 | 12.0 | 0.90 | 3741/4260 |
| XAUUSD | S | 8,577 | 5.8880 | −0.5653 | −0.09 | 13.0 | 3.54 | 8577/0 |
| XAUUSD | V | 17,471 | −0.1227 | 0.4133 | 0.09 | 23.0 | 3.57 | 9107/8364 |
| XAUUSD | SV | 8,577 | −2.4355 | −9.4737 | −1.67 | 13.0 | 3.54 | 4655/3922 |
Observation 3.2: S produces not one sell (buys/sells of 8443/0, 8434/0, 8001/0, 8577/0). This is as it must be. ADX does not distinguish up from down, so it holds no material for choosing a side.
Observation 3.3: therefore the D of S is not directional information. The mean of a signal that only buys copies whether price rose or fell over the period. Section 4 confirms this.
Observation 3.4: the D of S scatters from −4.2145 to 5.8880 pips. Reading that as "the performance of ADX" produces opposite conclusions in different instruments.
Observation 3.5: with the signed quantity V, D runs from −0.1625 to 0.7556 pips (median −0.0702). It falls below the spread (0.30, 0.30, 0.90, 3.57) in all four series.
Observation 3.6: filtering by strength does not improve on V. GBPUSD moves from −0.1625 to −1.4643 and XAUUSD from −0.1227 to −2.4355. Filtering does not work in the improving direction.
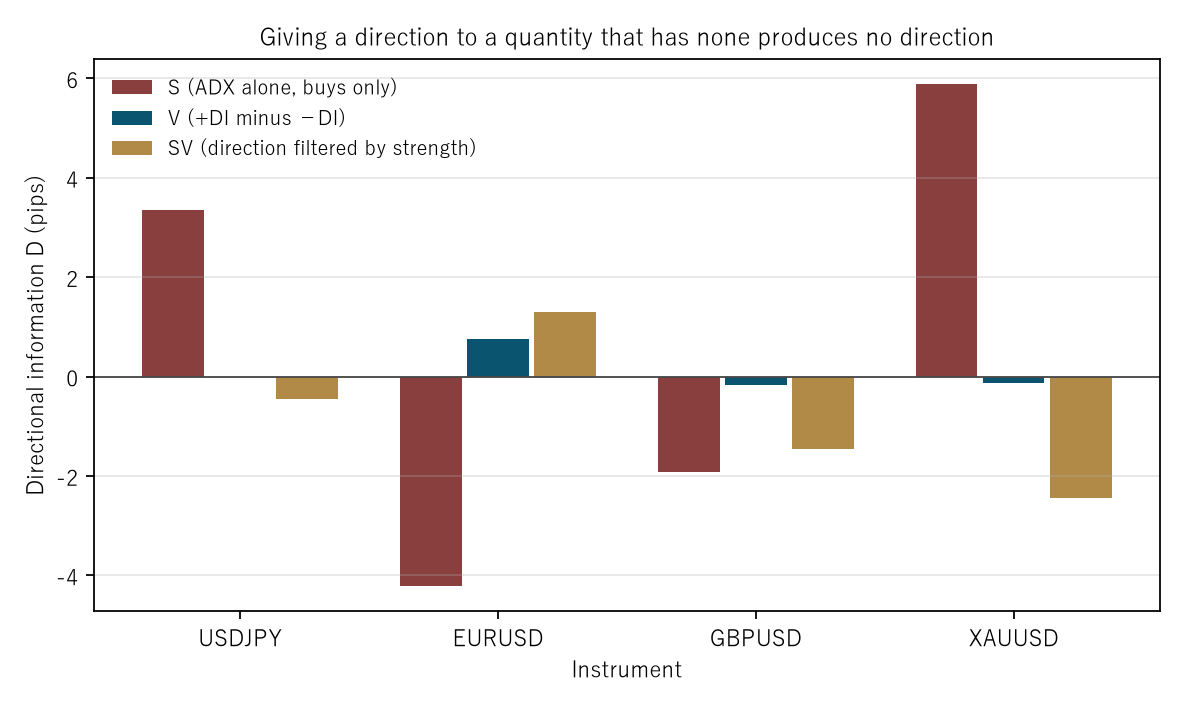
Figure 1: the directional information of the three signals by instrument. Only S (red) swings widely across instruments — because it copies the drift rather than the direction.
4. What S picks up is the drift
Calculation 4.1 The value of S beside the "all buy" mean over the same period
| Instrument | D of S | All-buy mean | Difference |
|---|---|---|---|
| USDJPY | 3.3500 | 5.5899 | −2.2399 |
| EURUSD | −4.2145 | −1.2670 | −2.9475 |
| GBPUSD | −1.9193 | −1.2888 | −0.6305 |
| XAUUSD | 5.8880 | 10.9641 | −5.0761 |
Observation 4.2: the sign of S agrees with the sign of the drift in all four series. USDJPY and XAUUSD are both positive; EURUSD and GBPUSD are both negative.
Observation 4.3: this is the core of the paper. That the value of S turns positive in some instruments and negative in others is not a merit or demerit of the indicator: it is whether that instrument rose or fell over that period.
Observation 4.4: the differences run from −0.6305 to −5.0761 pips and are negative in all four. Where ADX is high, the drift is smaller than the period's average. This is an observation across four series, not a measurement of a mechanism.
Observation 4.5: so any report of "results using ADX" must place the all-buy mean over the same period alongside. Without it, the drift is read as the indicator's achievement.
5. Thresholds and stratification — only the room to choose moves
Calculation 5.1 Moving the ADX threshold (evaluation period, signal SV)
| Instrument | ADX≥15 count | D | ADX≥20 count | D | ADX≥25 count | D | ADX≥30 count | D | ADX≥40 count | D |
|---|---|---|---|---|---|---|---|---|---|---|
| USDJPY | 15,670 | −0.0065 | 12,012 | −0.3650 | 8,443 | −0.4489 | 5,640 | −2.1007 | 2,169 | −3.8579 |
| EURUSD | 15,668 | 0.9069 | 12,038 | 0.6068 | 8,434 | 1.2996 | 5,640 | 1.1597 | 2,190 | 0.0881 |
| GBPUSD | 15,325 | −0.5921 | 11,496 | −0.2957 | 8,001 | −1.4643 | 5,383 | −2.2217 | 2,066 | −1.1321 |
| XAUUSD | 15,622 | −1.4852 | 12,099 | −2.4266 | 8,577 | −2.4355 | 5,719 | −3.4898 | 2,436 | −7.4616 |
Observation 5.2: raising the threshold from 15 to 40 cuts the count to a median of 0.1391 of itself. The reduction happens reliably.
Observation 5.3: over that move the directional information spans a median of 2.8887 pips. The standard 25 is best in only 1 of the 4 series, where chance would give 0.8. The measurement cannot be told apart from chance.
Observation 5.4: moreover XAUUSD and USDJPY get monotonically worse as the threshold rises (−0.0065 to −3.8579, and −1.4852 to −7.4616). A reading in which filtering harder hurts because the filter carries no direction while holding costs grow is available, but this paper has not measured it.
Calculation 5.5 Splitting into quintiles of ADX (evaluation period, signal V)
| Instrument | Q1 (weak) | Q2 | Q3 | Q4 | Q5 (strong) | Monotone? |
|---|---|---|---|---|---|---|
| USDJPY | −1.0615 | 1.8884 | 0.9805 | −1.8224 | −0.0776 | not monotone |
| EURUSD | −1.4931 | 3.5575 | −0.9971 | 1.8804 | 0.8327 | not monotone |
| GBPUSD | 0.5554 | 0.5219 | 0.8193 | −0.9532 | −1.7503 | not monotone |
| XAUUSD | 7.5460 | 6.2838 | −9.5871 | −1.7740 | −3.0798 | not monotone |
Observation 5.6: none of the four series is monotone. ADX is a quantity without direction, so splitting by it cannot, in principle, order direction. This is consistent with the prediction.
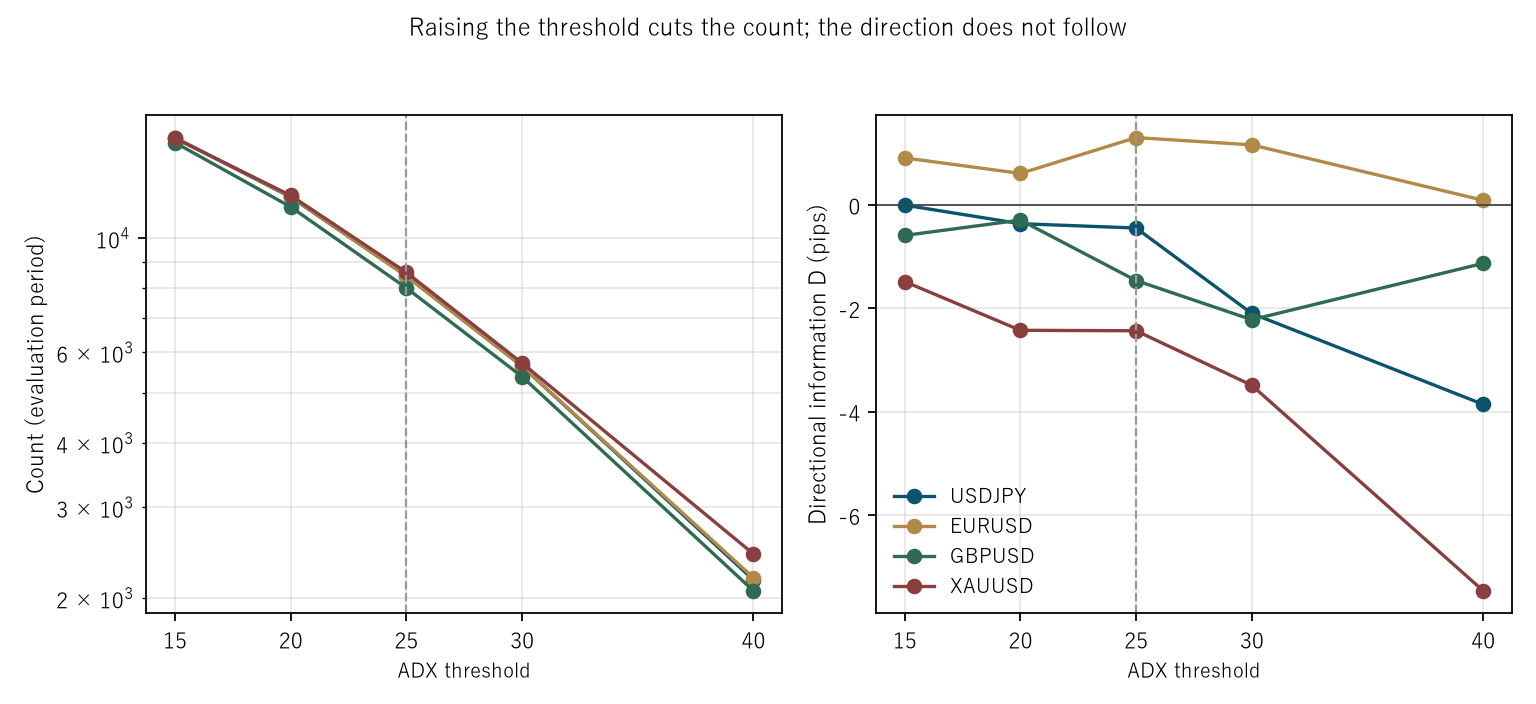
Figure 2: the count on the left (logarithmic) and the directional information on the right, with the dashed line at the standard 25. On the left all four fall with the same slope; on the right they move apart.
6. Removing the overlap — and the baseline
Calculation 6.1 Measuring again with non-overlapping windows (evaluation period)
| Instrument | Signal | Count with overlap | D | Daily t | Count without | D | t |
|---|---|---|---|---|---|---|---|
| USDJPY | V | 17,841 | −0.0178 | 0.07 | 744 | 2.7048 | 0.75 |
| USDJPY | SV | 8,443 | −0.4489 | −0.06 | 346 | 5.2020 | 0.99 |
| EURUSD | V | 17,867 | 0.7556 | 1.41 | 745 | 1.2645 | 0.64 |
| EURUSD | SV | 8,434 | 1.2996 | −0.38 | 342 | −0.2955 | −0.11 |
| GBPUSD | V | 17,850 | −0.1625 | 0.20 | 744 | −1.1464 | −0.44 |
| GBPUSD | SV | 8,001 | −1.4643 | −1.63 | 345 | −0.4280 | −0.11 |
| XAUUSD | V | 17,471 | −0.1227 | 0.09 | 728 | 1.0893 | 0.15 |
| XAUUSD | SV | 8,577 | −2.4355 | −1.67 | 355 | −0.5307 | −0.06 |
Observation 6.2: the cells with a daily t above 2 in absolute value number 0 of 8 both before and after removing the overlap. In this paper the overlap is not making the conclusion.
Observation 6.3: the count nevertheless falls from 17,841 to 744. The power of the test falls sharply. "Zero" is not "there is none"; it is not visible at this count.
Calculation 6.4 The baseline — synthetic series whose within-bar movement is also random (20 realisations, evaluation period)
| Instrument | Signal | Measured D | Median random D | Random minimum | Random maximum | Inside? |
|---|---|---|---|---|---|---|
| USDJPY | V | −0.0178 | −1.0353 | −5.8787 | 2.0835 | yes |
| USDJPY | SV | −0.4489 | −1.0839 | −9.6053 | 7.1516 | yes |
| EURUSD | V | 0.7556 | −0.6858 | −4.0337 | 1.4427 | yes |
| EURUSD | SV | 1.2996 | −0.7730 | −6.5875 | 4.8901 | yes |
| GBPUSD | V | −0.1625 | −1.0110 | −5.8223 | 2.0863 | yes |
| GBPUSD | SV | −1.4643 | −1.0783 | −9.5168 | 7.0622 | yes |
| XAUUSD | V | −0.1227 | −2.9450 | −11.7803 | 4.8095 | yes |
| XAUUSD | SV | −2.4355 | −4.0566 | −19.9387 | 17.0235 | yes |
Observation 6.5: in all eight cases the measurement falls inside the range of the 20 realisations. The +DI and −DI of a market and those of a series with no trend and no news have not been told apart by this way of measuring.
Observation 6.6: the range is wide (for XAUUSD's SV, −19.9387 to 17.0235). "Inside the range" is not "the same"; it is "not separable at this power".
7. Splitting by session
Design: five non-overlapping bins in Coordinated Universal Time. The signal is SV.
Calculation 7.1 Directional information in each of the five bins (evaluation period)
| Instrument | Tokyo 0–7 | London 7–12 | Overlap 12–16 | NY late 16–21 | Night 21–24 |
|---|---|---|---|---|---|
| USDJPY | −0.16 (t 0.23) | 0.85 (t 0.11) | −6.14 (t −1.24) | 2.06 (t 0.75) | −0.16 (t 0.16) |
| EURUSD | 1.46 (t 0.38) | 2.44 (t 0.60) | 0.27 (t −0.10) | 1.08 (t −0.05) | 0.76 (t 0.22) |
| GBPUSD | −2.34 (t 0.13) | −0.96 (t −0.98) | 1.04 (t −0.43) | −3.06 (t −1.07) | −0.60 (t −0.40) |
| XAUUSD | −1.46 (t −0.62) | 6.50 (t 0.34) | −3.30 (t −0.41) | −9.13 (t −1.26) | −8.17 (t −1.16) |
Observation 7.2: the daily t reaches 2 in absolute value in 0 of the 20 cells. By chance about 0.9 would be expected, so the measured figure is below it.
Observation 7.3: the reading "it works once the sessions are separated" is not supported here. This table too does not remove the overlap; since the figure was 0 both before and after in this paper, the direction of the conclusion does not change.
8. Limitations
- Only entry direction is measured. Uses such as "hold only while the trend is strong" or sizing positions by ADX are not questions about entry direction and are not treated. The claim is not that ADX is useless, but that it cannot be used to pick a side.
- Removing the overlap leaves between 342 and 745 observations. At that count even an effect several times the spread would not be visible.
- Only one lattice is used. Bars are fixed at one hour.
- The moment of a +DI/−DI crossing is not treated. V here is a relation of magnitude, not the instant after a cross.
- The mechanism behind Observation 4.4 is not measured. Why the drift is smaller where ADX is high is not investigated here.
- The synthetic baseline uses independent normal increments. Volatility clustering is not included.
- Four instruments over six years. Nothing is said about other markets or other periods.
Conclusion
ADX is built from the absolute value of the difference between +DI and −DI. Take an absolute value and the distinction between up and down disappears. So using ADX as a signal produces not one sell.
Numbers still appear, scattering from −4.2145 to 5.8880 pips. But their signs agreed with the sign of the period's drift in all four series. The indicator did not get it right; it copied the direction price happened to move.
Switching to a signed quantity left the directional information between −0.1625 and 0.7556 pips, exceeding the spread in none of the four. Moving the threshold produced no settled destination, splitting into quintiles was monotone in none of the four, and all eight cases fell inside the range of a random walk.
One thing separates the cases — whether the quantity distinguishes up from down. Give a direction to one that does not, and what comes out is the drift.
And what this paper could measure is entry direction alone. About using ADX for exits or position sizing, nothing is answered here.
Data and reproduction
| Data | Currency ticks from Dukascopy (agreement to the millisecond, bid and ask, verified from 2019 onward). Gold from Dukascopy |
| Period | 2019–2024 (six years). Selection 2019–2021 / evaluation 2022–2024 |
| Instruments | USDJPY, EURUSD, GBPUSD, XAUUSD |
| Bars | One hour, mid price, closing value of completed bars only. Bars with no ticks are not created |
| Verification | 検算/F007.py (with --zu it also writes the figures). Every number in the text is taken from 検算/F007_output.txt |
| Figures | 図/F007_zu1, 図/F007_zu2 (png, svg, English versions) |
| Random seeds | Fixed at 0–19. Re-running gives the same values |
| Audit of the foundation | _ツール/audit_bars.py (look-ahead in the bars, daylight saving, the day boundary). The record is _土台の検査.txt |
References
- Yamagishi, Y. (2026). The Table Is Right and the Trade Still Loses [Paper 423]. Zenodo. 10.5281/zenodo.22700114
- Yamagishi, Y. (2026). The Multiplier of a Bollinger Band Changes How Often Price Leaves It, Not Which Way Price Goes [F003]. Zenodo. 10.5281/zenodo.22881085
- Yamagishi, Y. (2026). The %K of Stochastics Is the Position in the Range Itself [F006]. Zenodo. 10.5281/zenodo.22881505
Reference
Yamagishi, Y. (2026). ADX Carries No Direction, So It Cannot Tell You Which Way [F007]. Zenodo.
DOI: 10.5281/zenodo.22881623
YOI: https://www.yamagishiyuuki.com/yoi/F007
ORCID: 0009-0006-8587-3450
PDF (English) · PDF (Japanese) · Date proof of the English PDF (OpenTimestamps .ots) · SHA256SUMS
The record page for this paper (in Japanese, with the PDFs in each language and the date proof): YOI F007. This paper is a preprint and has not been peer reviewed.