Abstract
This paper asks whether adding conditions adds information, or only removes count — the answer is that it only removes count. It claims neither a new mathematical theorem nor a new law.
First, moving the number of aligned timeframes k from 1 to 4 across five-minute, fifteen-minute, one-hour and four-hour bars cuts the count from 17,841 to 6,798 (USDJPY), a median ratio across the four series of 0.3683. Over the same move, the median directional information runs +0.2548, +0.4347, +0.8606, −0.2449 pips — not monotone (Section 3).
Second, the same happens when three moving averages are required to line up (conditions multiplied 1, 2, 3): the count falls to 0.3413 of itself. The median change in directional information is −1.3877 pips, negative in all four series (Section 4).
Third, and this is the core of the paper, at k = 4 the median absolute daily t reaches 2.4643 and the significant cells become 4 of 4. Chance gives about 0.2, so this reads as "alignment works". But with twenty-four bars of look-forward, neighbouring observations overlap by twenty-three bars. Taking one observation only after the previous one has finished leaves 0.1012 of the count, a median daily t of 0.5923, and 0 of 4 significant cells (Section 5).
Fourth, the same holds for the perfect order. With the overlap the median daily t is 5.2377; removing it gives 0.5286. And the sign reverses in 2 of the 4 series for the aligned family (Section 5).
Fifth, the k that was best in the selection period was also best in the evaluation period in 1 of 4 series. Chance gives 1.0, so the selection-period ordering does not carry over (Section 6).
Sixth, building one synthetic path from independent normal increments down to the movement inside each bar, and aggregating it into the four timeframes, gives a k = 4 count ratio of 0.3895 to 0.3918. That is higher than the measured 0.3630 to 0.3810. Alignment is not a property of the market but a consequence of looking at one price series at four resolutions (Section 7).
Scope of this paper (scope note): No new mathematical theorem and no new law is claimed — moving averages, multi-timeframe alignment, random walks, and the fact that overlapping observations inflate t are all known. No particular product or proponent is discussed — no real course, author, or vendor is the subject here, and none is named. What is treated is the public practice itself. Trading is not discussed — what is measured is counts and directional information, not trading performance including commissions, fills and money management. The scope is intraday and a small number of instruments — four series, six years, on a one-hour base lattice. Monthly time-series momentum (dozens of markets, holding one to twelve months) is documented in the literature, and this paper does not contradict it. One combination of timeframes is fixed — five-minute, fifteen-minute, one-hour and four-hour, with SMA(20). Other combinations give other figures (Section 9). "Aligned" is defined as agreement in sign — agreement in slope or in ordering is not treated. No forecast is claimed. Relation to earlier papers: this series always reports, alongside a rate or a t, what it would be by chance. F004 showed that removing the overlap drops the significant cells from 10 of 16 to 2 of 16 — this paper applies the same move to the practice of adding conditions. What is added here is placing the fall in count beside what independence would give, building a baseline from one path aggregated into four timeframes, and putting the daily t and the sign before and after the overlap into one table.
1. Notation and the question
There is a practice of aligning the direction of a higher and a lower timeframe before entering, and another of waiting for three moving averages to line up.
| Practice | A common form | What is said about it |
|---|---|---|
| Multi-timeframe alignment | four-hour up, one-hour up, then buy the fifteen-minute pullback | do not fight the higher timeframe |
| Alignment of order | short, medium and long averages lined up in order | evidence of a strong trend |
| Adding conditions | multiply the two above together | the accuracy goes up |
Observation 1.1: adding a condition necessarily reduces the count. That says nothing about the market. It is a property of multiplication, independent of the merits of the practice.
Observation 1.2: and a smaller count makes the win rate move more easily. In a small sample both good and bad figures appear more readily. A report that "the win rate is high when aligned" cannot be read unless the win rate when not aligned, the count, and what chance would give are reported beside it.
Observation 1.3: the question settles by placing three things alongside. One is the fall in count — what independence would give. Two is the directional information — did it concentrate by as much as the count fell. Three is the overlap — is the same event being counted many times.
Question: when a condition is added, does information rise, or does only the count fall?
2. Writing the quantity and the design in advance
Design (declared before running and unchanged at run time)
| Item | Decision |
|---|---|
| Family A | the sign of the close against SMA(20) on five-minute, fifteen-minute, one-hour and four-hour bars |
| k in Family A | the number aligned. Trade in that direction when the first k of them all agree |
| Family B | SMA(5), SMA(20), SMA(80) on one-hour bars. Condition 1 is 5 above 20, condition 2 adds 20 above 80, condition 3 adds the close above 5 |
| Base bars | one hour, mid price, completed bars only |
| Horizon | h = 24 (twenty-four hours) |
| Directional information | the mean of the signal's sign times the price move over the next 24 bars (pips) |
| Instruments | USDJPY, EURUSD, GBPUSD, XAUUSD |
| Period | 2019–2024. Selection 2019–2021, evaluation 2022–2024 |
Observation 2.1: only completed higher-timeframe bars are used. Reading the four-hour timeframe at a one-hour timestamp t using the four-hour bar that contains t would look up to four hours into the future. Only bars whose end is at or before t are used.
Observation 2.2: with h = 24 bars of look-forward, neighbouring observations overlap by twenty-three bars. Daily clustering folds only the overlap within a day; the overlap across days remains. Section 5 removes it.
Observation 2.3: "aligned" is defined as agreement in sign. Agreement in slope, or in ordering, is a different definition. Family B is one such.
The bar counts are, for USDJPY, 438,283 five-minute, 146,125 fifteen-minute, 36,534 one-hour and 9,640 four-hour; for EURUSD 438,505, 146,202, 36,554, 9,648; for GBPUSD 438,199, 146,127, 36,535, 9,644; and for XAUUSD 418,478, 139,501, 34,892, 9,442.
3. Family A — moving the number aligned from 1 to 4
Calculation 3.1 Count and directional information by k (evaluation period)
| Instrument | k | Count | D (pips) | Dd (daily mean) | Daily t | Days | Per day | Spread |
|---|---|---|---|---|---|---|---|---|
| USDJPY | 1 | 17,841 | 1.4086 | 1.8664 | 2.05 | 935 | 24.0 | 0.60 |
| USDJPY | 2 | 13,626 | 2.7307 | 3.0784 | 2.33 | 928 | 17.0 | 0.60 |
| USDJPY | 3 | 9,952 | 3.0821 | 2.0426 | 1.07 | 906 | 12.0 | 0.60 |
| USDJPY | 4 | 6,798 | 2.4546 | −5.4733 | −2.15 | 873 | 8.0 | 0.60 |
| EURUSD | 1 | 17,867 | −0.6399 | −0.2000 | −0.38 | 936 | 24.0 | 0.30 |
| EURUSD | 2 | 13,658 | −1.0408 | −0.1921 | −0.27 | 926 | 17.0 | 0.30 |
| EURUSD | 3 | 9,756 | −0.4116 | 0.0633 | 0.06 | 898 | 12.0 | 0.30 |
| EURUSD | 4 | 6,485 | −0.8412 | −3.4725 | −2.56 | 860 | 8.0 | 0.30 |
| GBPUSD | 1 | 17,850 | 0.1094 | 0.5404 | 0.76 | 935 | 24.0 | 0.90 |
| GBPUSD | 2 | 13,728 | −0.1583 | 0.8609 | 0.90 | 923 | 17.0 | 0.90 |
| GBPUSD | 3 | 9,863 | −0.0066 | −0.0130 | −0.01 | 885 | 12.0 | 0.90 |
| GBPUSD | 4 | 6,584 | 0.3513 | −4.4598 | −2.37 | 862 | 8.0 | 0.90 |
| XAUUSD | 1 | 17,471 | 0.4002 | 0.4684 | 0.19 | 918 | 23.0 | 3.57 |
| XAUUSD | 2 | 13,432 | 1.0277 | 0.3503 | 0.12 | 896 | 17.0 | 3.57 |
| XAUUSD | 3 | 9,704 | 1.7277 | −1.8574 | −0.46 | 863 | 12.0 | 3.56 |
| XAUUSD | 4 | 6,424 | −1.5865 | −18.4721 | −3.57 | 832 | 8.0 | 3.58 |
Calculation 3.2 How the count falls
| Instrument | k=1 | k=2 | k=3 | k=4 | k=4 ÷ k=1 | If independent |
|---|---|---|---|---|---|---|
| USDJPY | 17,841 | 13,626 | 9,952 | 6,798 | 0.3810 | 0.1250 |
| EURUSD | 17,867 | 13,658 | 9,756 | 6,485 | 0.3630 | 0.1250 |
| GBPUSD | 17,850 | 13,728 | 9,863 | 6,584 | 0.3689 | 0.1250 |
| XAUUSD | 17,471 | 13,432 | 9,704 | 6,424 | 0.3677 | 0.1250 |
Calculation 3.3 Medians by k
| k | Median D (pips) | Median absolute daily t | Cells with absolute value 2 or more |
|---|---|---|---|
| 1 | +0.2548 | 0.5670 | 1 / 4 |
| 2 | +0.4347 | 0.5865 | 1 / 4 |
| 3 | +0.8606 | 0.2610 | 0 / 4 |
| 4 | −0.2449 | 2.4643 | 4 / 4 |
Observation 3.4: the median count ratio is 0.3683. Were the four independent it would be 0.1250, so about three times as much survives. The four timeframes are not independent; they are one price series seen at four resolutions.
Observation 3.5: the median directional information runs +0.2548, +0.4347, +0.8606, −0.2449 pips. It rises through k = 3 and changes sign at k = 4. It is not monotone.
Observation 3.6: at k = 4 the median absolute daily t reaches 2.4643 and the significant cells become 4 of 4. Chance gives about 0.2, so read alone this says "aligning all four works".
Observation 3.7: but look at the sign: Dd is negative in all four series (−5.4733, −3.4725, −4.4598, −18.4721). That reads as "entering in the aligned direction loses". It runs against what the practice claims, which is reason enough to stop here.
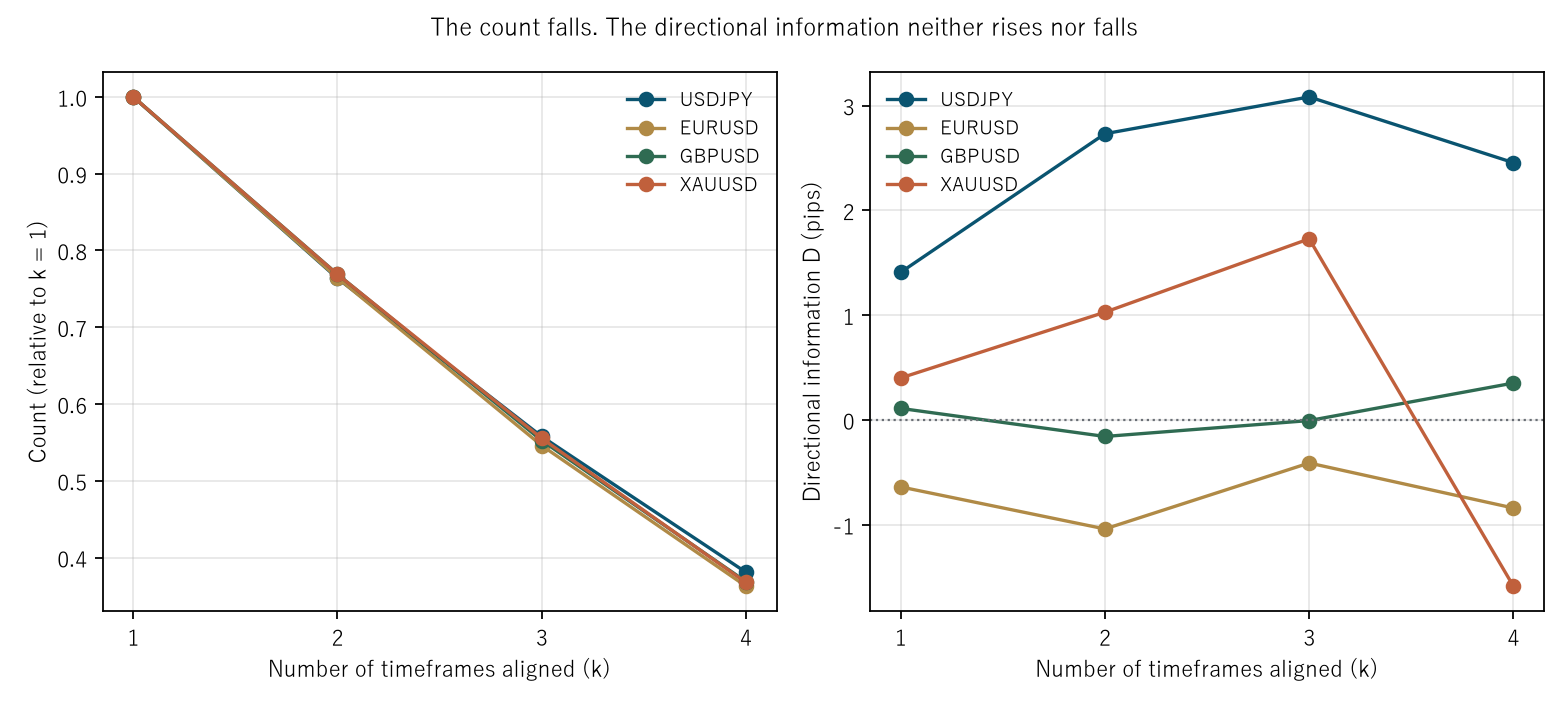
Figure 1: on the left the count (relative to k = 1), on the right the directional information. The left falls the same way in all four series; the right is flat and scattered.
4. Family B — multiplying the perfect-order conditions 1, 2, 3
Calculation 4.1 Count and directional information by number of conditions (evaluation period)
| Instrument | Conditions | Count | D (pips) | Dd (daily mean) | Daily t | Days | Per day |
|---|---|---|---|---|---|---|---|
| USDJPY | 1 | 17,841 | 1.6576 | 2.2002 | 1.14 | 935 | 24.0 |
| USDJPY | 2 | 10,858 | −0.3119 | −8.4592 | −3.08 | 868 | 12.0 |
| USDJPY | 3 | 6,368 | 0.8151 | −14.7604 | −4.94 | 815 | 7.0 |
| EURUSD | 1 | 17,867 | 0.5151 | 1.3911 | 1.30 | 936 | 24.0 |
| EURUSD | 2 | 10,592 | −0.3452 | −3.5403 | −2.41 | 867 | 12.0 |
| EURUSD | 3 | 6,084 | −1.1296 | −7.5709 | −4.72 | 803 | 7.0 |
| GBPUSD | 1 | 17,850 | −0.0960 | 0.5722 | 0.40 | 935 | 24.0 |
| GBPUSD | 2 | 10,582 | −0.4649 | −6.7779 | −3.44 | 877 | 12.0 |
| GBPUSD | 3 | 6,040 | −1.2266 | −11.9795 | −5.53 | 815 | 7.0 |
| XAUUSD | 1 | 17,471 | 2.2325 | 0.2547 | 0.06 | 918 | 23.0 |
| XAUUSD | 2 | 10,389 | −1.0276 | −24.7170 | −4.33 | 852 | 12.0 |
| XAUUSD | 3 | 5,978 | −0.1845 | −38.7500 | −6.33 | 772 | 7.0 |
Calculation 4.2 The effect of multiplying conditions
| Instrument | Condition 3 ÷ condition 1 (count) | D condition 1 | D condition 3 | Change in D |
|---|---|---|---|---|
| USDJPY | 0.3569 | 1.6576 | 0.8151 | −0.8425 |
| EURUSD | 0.3405 | 0.5151 | −1.1296 | −1.6447 |
| GBPUSD | 0.3384 | −0.0960 | −1.2266 | −1.1306 |
| XAUUSD | 0.3422 | 2.2325 | −0.1845 | −2.4170 |
Observation 4.3: the median count ratio is 0.3413. Multiplying three conditions leaves a third of the count.
Observation 4.4: the median change in directional information is −1.3877 pips, ranging from −2.4170 to −0.8425. It is negative in all four series — adding conditions made it worse.
Observation 4.5: the median spread is 0.7500 pips. The size of the change is of the same order as the spread, but the sign is wrong, so there is no case for adding the conditions at all.
Observation 4.6: here too Dd deteriorates monotonically as conditions are added, reaching a daily t of −6.33 (XAUUSD). This is the same shape as Section 3. The next section identifies it.
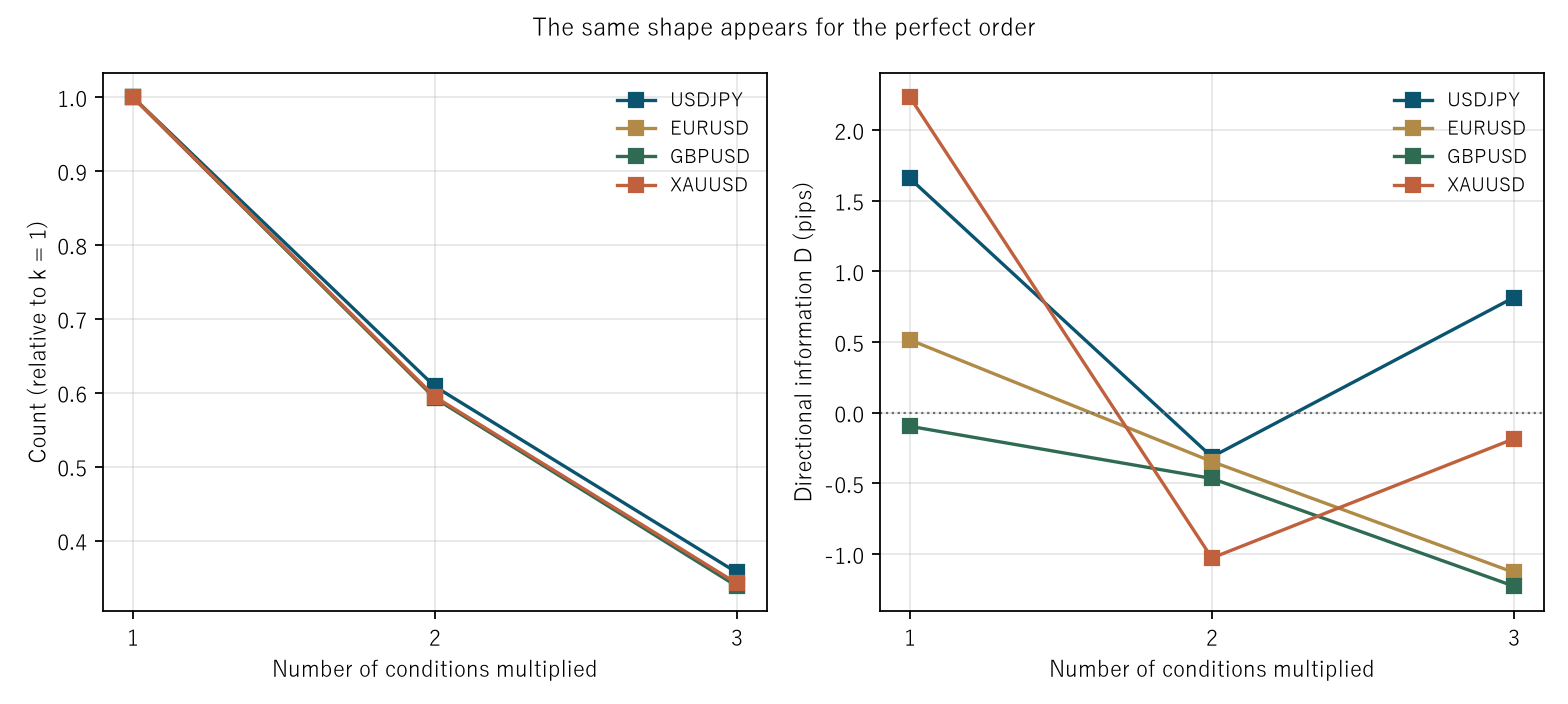
Figure 2: on the left the count (relative to condition 1), on the right the directional information. The same shape as Family A appears.
5. Removing the overlap — this is the separator
Design: do not open the next observation until the previous one has finished. With h = 24 that leaves one observation every 24 bars.
Calculation 5.1 Before and after the overlap (evaluation period)
| Instrument | Condition | Count | D (pips) | Dd (daily mean) | Daily t | Per day |
|---|---|---|---|---|---|---|
| USDJPY | Family A k=4, with overlap | 6,798 | 2.4546 | −5.4733 | −2.15 | 8.0 |
| USDJPY | Family A k=4, without | 663 | 2.9468 | 2.9468 | 0.75 | 1.0 |
| USDJPY | Family B cond. 3, with overlap | 6,368 | 0.8151 | −14.7604 | −4.94 | 7.0 |
| USDJPY | Family B cond. 3, without | 592 | 0.6837 | 0.6837 | 0.16 | 1.0 |
| EURUSD | Family A k=4, with overlap | 6,485 | −0.8412 | −3.4725 | −2.56 | 8.0 |
| EURUSD | Family A k=4, without | 657 | −0.9322 | −0.9322 | −0.43 | 1.0 |
| EURUSD | Family B cond. 3, with overlap | 6,084 | −1.1296 | −7.5709 | −4.72 | 7.0 |
| EURUSD | Family B cond. 3, without | 587 | −0.8419 | −0.8419 | −0.37 | 1.0 |
| GBPUSD | Family A k=4, with overlap | 6,584 | 0.3513 | −4.4598 | −2.37 | 8.0 |
| GBPUSD | Family A k=4, without | 665 | −5.4644 | −5.4644 | −1.94 | 1.0 |
| GBPUSD | Family B cond. 3, with overlap | 6,040 | −1.2266 | −11.9795 | −5.53 | 7.0 |
| GBPUSD | Family B cond. 3, without | 601 | −2.0435 | −2.0435 | −0.69 | 1.0 |
| XAUUSD | Family A k=4, with overlap | 6,424 | −1.5865 | −18.4721 | −3.57 | 8.0 |
| XAUUSD | Family A k=4, without | 651 | 0.1210 | 0.1210 | 0.02 | 1.0 |
| XAUUSD | Family B cond. 3, with overlap | 5,978 | −0.1845 | −38.7500 | −6.33 | 7.0 |
| XAUUSD | Family B cond. 3, without | 584 | −6.8297 | −6.8297 | −0.82 | 1.0 |
Calculation 5.2 Before and after, summarised (medians of four series)
| Condition | Count ratio | D with overlap | D without | Median absolute daily t, with | Without | Sign reversed |
|---|---|---|---|---|---|---|
| Family A k=4 | 0.1012 | −0.2449 | −0.4056 | 2.4643 | 0.5923 | 2 / 4 |
| Family B cond. 3 | 0.0971 | −0.6570 | −1.4427 | 5.2377 | 0.5286 | 0 / 4 |
Observation 5.3: the median absolute daily t falls from 2.4643 to 0.5923 for Family A and from 5.2377 to 0.5286 for Family B. After removing the overlap, the cells with absolute value 2 or more number 0 of 4 for Family A and 0 of 4 for Family B. Chance gives about 0.2, so the measurement is below chance.
Observation 5.4: the count ratios are 0.1012 and 0.0971. Nine observations in ten were counted while the previous one had not yet finished.
Observation 5.5: for Family A the sign reverses in 2 of the 4 series. XAUUSD moves from −1.5865 to +0.1210 and GBPUSD from +0.3513 to −5.4644. Removing the overlap is not an operation that improves precision; it is one that changes the quantity.
Observation 5.6: what read in Sections 3 and 4 as "aligning makes it significantly negative" was made by the overlap. Counting the same event eight times pulls the daily mean toward that event. Daily clustering folds only the overlap within a day; the overlap across days remains.
Observation 5.7: ★ the answer of this paper is therefore double. Adding conditions does not raise the directional information (Sections 3 and 4). And what looked like "adding works, or fails, significantly" also disappears once the overlap is removed (this section). What remains is only the fact that the count fell.
6. Is the k that was best in the selection period best in the evaluation period?
Calculation 6.1 Ordering across periods (Family A)
| Instrument | Best k in selection | That k's evaluation D | Best k in evaluation | Match |
|---|---|---|---|---|
| USDJPY | 4 | 2.4546 | 3 | no |
| EURUSD | 4 | −0.8412 | 3 | no |
| GBPUSD | 4 | 0.3513 | 4 | yes |
| XAUUSD | 4 | −1.5865 | 3 | no |
Observation 6.2: in the selection period k = 4 was best in all four series. Read alone, that says "the more aligned the better".
Observation 6.3: in the evaluation period the best was k = 3 in 3 of the 4 series. The match is 1 of 4 against 1.0 by chance, so the selection-period ordering does not carry over.
Observation 6.4: this does not mean "k = 3 is correct". It means that the act of picking the best from four values of k gives a different answer in each period.
7. The baseline — does a random walk "align" too?
Calculation 7.1 One path, aggregated into four timeframes (10 realisations, evaluation period)
| Instrument | Measured k=4 ÷ k=1 | Random walk k=4 ÷ k=1 | Difference |
|---|---|---|---|
| USDJPY | 0.3810 | 0.3918 | −0.0107 |
| EURUSD | 0.3630 | 0.3895 | −0.0266 |
| GBPUSD | 0.3689 | 0.3910 | −0.0221 |
| XAUUSD | 0.3677 | 0.3912 | −0.0235 |
Observation 7.2: the random walk's count ratio runs from 0.3895 to 0.3918 — higher than the measured 0.3630 to 0.3810. The median difference is −0.0228.
Observation 7.3: a synthetic random walk has no uptrend, no downtrend, no support and no resistance. The four timeframes align at the same rate anyway. Alignment is not a property of the market but a consequence of looking at one price series at four resolutions.
Observation 7.4: one error was made here and corrected. The first version drew a separate random series for each timeframe. Those are four independent paths, which is not the situation in question — one series seen at four resolutions. That version gave count ratios almost exactly equal to the independent value of 0.1250. ★ When a baseline agrees too well with the theoretical value, suspect the baseline. In the corrected version one path is built on five-minute bars and aggregated into fifteen-minute, one-hour and four-hour.
8. Splitting by session
Design: five non-overlapping bins in Coordinated Universal Time. The signal is Family A at k = 4.
Calculation 8.1 Directional information in each of the five bins (evaluation period)
| Instrument | Tokyo 0–7 | London 7–12 | Overlap 12–16 | NY late 16–21 | Night 21–24 |
|---|---|---|---|---|---|
| USDJPY | 1.90 (t −0.36) | 6.69 (t 0.37) | −5.49 (t −2.05) | 3.62 (t −0.57) | 7.00 (t 1.54) |
| EURUSD | −0.67 (t −0.13) | −0.20 (t −0.98) | −1.51 (t −2.17) | −1.63 (t −1.79) | 0.17 (t −0.17) |
| GBPUSD | 1.00 (t −0.08) | −2.20 (t −2.30) | −0.09 (t −1.59) | 1.14 (t −0.81) | 2.90 (t 0.51) |
| XAUUSD | −3.47 (t −1.02) | 7.95 (t 0.24) | −1.08 (t −1.03) | −11.37 (t −1.33) | 6.94 (t 0.33) |
Observation 8.2: the daily t reaches 2 in absolute value in 3 of 20 cells. Chance gives about 0.9, so the measurement is above it.
Observation 8.3: but these three are measured on a signal that still carries the overlap. As Section 5 showed, the daily t with the overlap is inflated. What looked like more than chance in the session split must not be read as a property of the market.
Observation 8.4: the three that look significant are two in Overlap 12–16 and one in London 7–12, and all three are negative. This paper does not claim them. Removing the overlap leaves only 584 to 665 observations, and splitting that into five bins is not enough precision to measure.
9. Limitations
- ★ One combination of timeframes is fixed. Five-minute, fifteen-minute, one-hour and four-hour, with SMA(20). Other combinations give other figures. The conclusion of Section 5 (removing the overlap drops t) follows from h and the counts rather than from the combination.
- "Aligned" is defined as agreement in sign. Agreement in slope, or in ordering, is a different definition. Family B is one example, and it gave the same shape.
- The order in which timeframes are added is fixed from the front: five-minute, fifteen-minute, one-hour, four-hour. Another order changes the intermediate values of k. k = 1 and k = 4 do not depend on the order.
- After removing the overlap the counts are 584 to 665. At that count an effect of the same order as the spread is not visible. "Not significant" means "not visible at this count", not "not there".
- Section 8 still carries the overlap. Removing it leaves too few observations per bin.
- The synthetic baseline uses independent normal increments. Volatility clustering is not included.
- Four instruments over six years. Nothing is said about other markets or other periods.
Conclusion
Aligning four timeframes leaves 0.3683 of the count. Lining up three moving averages leaves 0.3413. Both follow from having multiplied conditions.
Had what remained concentrated by as much as the count fell, the directional information would have risen. It did not. The medians for Family A run +0.2548, +0.4347, +0.8606, −0.2449 pips, not monotone, and the median change for Family B is −1.3877 pips, negative in all four series.
And what looked like "aligning makes it significant" was made by the overlap. Opening the next observation only after the previous one has finished leaves 0.1012 of the count, drops the median daily t from 2.4643 to 0.5923, and takes the significant cells from 4 of 4 to 0 of 4. For Family A the sign reverses in 2 of the 4 series.
Building one synthetic path and aggregating it into the four timeframes gives an alignment share of 0.3895 to 0.3918 — higher than the measurement.
Alignment is not a property of the market. It is one price series, seen at four resolutions.
Data and reproduction
| Data | Currency ticks from Dukascopy (agreement to the millisecond, bid and ask, verified from 2019 onward). Gold from Dukascopy |
| Period | 2019–2024 (six years). Selection 2019–2021, evaluation 2022–2024 |
| Instruments | USDJPY, EURUSD, GBPUSD, XAUUSD |
| Bars | Five-minute, fifteen-minute, one-hour, four-hour. Mid price, closing value of completed bars only. Bars with no ticks are not created |
| Higher-timeframe reference | Only bars whose end is at or before the base timestamp (never a bar still in progress) |
| Verification | 検算/F010.py (with --zu it also writes the figures). Every number in the text is taken from 検算/F010_output.txt |
| Figures | 図/F010_zu1, 図/F010_zu2 (png, svg, English versions) |
| Random seeds | Fixed at 0–9. Re-running gives the same values |
| Audit of the foundation | _ツール/audit_bars.py (look-ahead in the bars, daylight saving, the day boundary). The record is _土台の検査.txt |
References
- Yamagishi, Y. (2026). The "Overbought 70" of RSI Belongs to the Bar Size You Chose [F004]. Zenodo. 10.5281/zenodo.22881156
Reference
Yamagishi, Y. (2026). Aligning Timeframes Only Reduces the Count by as Much as You Aligned [F010]. Zenodo.
DOI: 10.5281/zenodo.22891380
YOI: https://www.yamagishiyuuki.com/yoi/F010
ORCID: 0009-0006-8587-3450
PDF (English) · PDF (Japanese) · Date proof of the English PDF (OpenTimestamps .ots) · SHA256SUMS
The record page for this paper (in Japanese, with the PDFs in each language and the date proof): YOI F010. This paper is a preprint and has not been peer reviewed.