Abstract
This paper asks whether a table of pivot touch probabilities says anything about the name of a level — the answer is that it does not. It claims neither a new mathematical theorem nor a new law.
First, measured on one-hour bars for four series, the median touch rates are 76.1317% for P, 44.4306% for R1, 42.6601% for S1, 17.8443% for R2 and 16.7095% for S2. The median distances to those levels are 0.1614, 0.4433, 0.4520, 0.8833 and 0.9054 in units of ATR, and the correlation between distance and touch rate is −0.9791 (Section 3).
Second, and this is the core of the paper, six levels with no name and no derivation were built from the same days and the same previous-day ranges by multiplying by 0.37, 0.73 and 1.13, then all eleven levels were sorted by distance. Three of the nearest six are fakes. The correlation across the eleven is −0.9788, unchanged from the real levels alone (Section 4).
Third, cutting into quintiles of distance and comparing the upper levels (the R side) with the lower ones (the S side) inside each band, the median difference across the 20 bands is −0.7375 points, with a median absolute value of 1.6128 points. At the same distance, up and down are touched at the same rate (Section 5).
Fourth, a touch probability and a trading win rate are different pairs of barriers. The touch rate for P is 76.1317%, but a trade that buys at S1, targets P and stops at S2 has a theoretical win rate of 44.9638% to 49.6298%, measured at 34.3750% to 50.4202%. The median departure from theory is −2.4555 points (Section 6).
Fifth, the directional information from the bar of the touch onward has a median of −0.7965 pips. The median spread is 0.7500 pips, and the daily t reaches 2 in absolute value in 0 of 4 cells (Section 7).
Sixth, repeating the measurement on synthetic series built from independent normal increments down to the movement inside each bar, the median difference in touch rate is −0.3288 points, with a median absolute value of 1.5313 points. A synthetic random walk has no previous day, no highs and lows that mean anything, and no pivots — and the same rates come out anyway (Section 8).
Scope of this paper (scope note): No new mathematical theorem and no new law is claimed — the definition of pivots, the true range, the optional stopping theorem and random walks are all known. No particular product or proponent is discussed — no real course, author, or vendor is the subject here, and none is named. What is treated is the public drawing method itself. Trading is not discussed — what is measured is touch rates, win rates and directional information, not trading performance including commissions, fills and money management. The scope is intraday and a small number of instruments — four series, six years, one-hour bars. Monthly time-series momentum (dozens of markets, holding one to twelve months) is documented in the literature, and this paper does not contradict it. The day boundary is fixed at midnight Coordinated Universal Time — not the boundary brokers use (17:00 New York and so on). Moving the boundary moves the levels themselves, so this is a caveat (Section 10). Equally spaced pivots and other variants are not treated. No forecast is claimed. Relation to earlier papers: this series always reports, alongside a rate, what that rate would be by chance. F006 read a touch rate beside the position and F008 placed fake ratios in the same band — this paper applies both moves to levels that carry names. Paper 423 showed that a probability can be right while only the multiplication is wrong. What is added here is building nameless levels from the same days and the same previous-day ranges and mixing them in, holding distance fixed and comparing up against down, and measuring the gap between one-sided and two-sided barriers directly, on the same days and the same levels.
1. Notation and the question
From the previous trading day's high H, low L and close C, the following levels are drawn.
| Level | How it is made | Usual name |
|---|---|---|
| P | (H + L + C) ÷ 3 | pivot, the centre |
| R1 | 2P − L | first resistance |
| R2 | P + (H − L) | second resistance |
| S1 | 2P − H | first support |
| S2 | P − (H − L) | second support |
Observation 1.1: these are fixed by the previous day's values alone. So they carry no look-ahead. That part is correct.
Observation 1.2: a common practice attaches to these levels a table saying "the probability of touching this today is such and such". The numbers in that table are in fact right (they were right here too). The question is what the right numbers are right about.
Observation 1.3: the question settles by placing two things alongside. One is a nameless level — built from the same days and the same previous-day ranges, with only the ratio changed. The other is distance — comparing the upper and lower levels at the same distance.
Question: does a table of pivot touch probabilities say anything about the name of a level?
2. Writing the quantity and the design in advance
Design (declared before running and unchanged at run time)
| Item | Decision |
|---|---|
| Day boundary | midnight Coordinated Universal Time. Days with fewer than 12 bars are dropped |
| Real levels | P, R1, R2, S1, S2 (from the previous trading day's high, low and close) |
| Fake levels | P ± 0.37(H − L), P ± 0.73(H − L), P ± 1.13(H − L) |
| Distance | absolute value of (level − the day's open) ÷ ATR (mean true range of the previous 14 days) |
| Touch rate | the share of days on which some bar's high and low straddled the level |
| Directional information | the price move in the bounce direction over 24 bars from the bar of the touch (pips) |
| Bars | one hour, mid price, completed bars only |
| Instruments | USDJPY, EURUSD, GBPUSD, XAUUSD |
| Period | 2019–2024. Evaluation 2022–2024 |
Observation 2.1: the ATR does not use the current day. It is built from the previous 14 days. Putting today's range into the denominator of the distance would make the distance itself a look-ahead.
Observation 2.2: the directional signal is placed on the bar of the touch. Placing it before the touch puts "price moved toward the level" into the condition, so betting against that move loses by construction. Measure from after the event used as the condition.
Observation 2.3: the fake ratios are placed away from the real ones and scattered across the same band.
The bar and day counts are 36,534 bars and 1,555 days for USDJPY (778 in evaluation), 36,554 and 1,555 for EURUSD (778), 36,535 and 1,555 for GBPUSD (778), and 34,892 and 1,524 for XAUUSD (764).
3. The touch rate of the five levels, and the distance to each
Calculation 3.1 Touch rate and distance (evaluation period, by instrument)
| Instrument | Level | Days | Distance ÷ ATR | Touch rate |
|---|---|---|---|---|
| USDJPY | S2 | 778 | 0.9042 | 16.8380% |
| USDJPY | S1 | 778 | 0.4519 | 39.7172% |
| USDJPY | P | 778 | 0.1565 | 73.2648% |
| USDJPY | R1 | 778 | 0.4036 | 45.7584% |
| USDJPY | R2 | 778 | 0.8119 | 20.3085% |
| EURUSD | S2 | 778 | 0.9026 | 16.5810% |
| EURUSD | S1 | 778 | 0.4521 | 44.3445% |
| EURUSD | P | 778 | 0.1671 | 77.5064% |
| EURUSD | R1 | 778 | 0.4598 | 43.5733% |
| EURUSD | R2 | 778 | 0.9191 | 16.7095% |
| GBPUSD | S2 | 778 | 0.9148 | 17.8663% |
| GBPUSD | S1 | 778 | 0.4573 | 43.9589% |
| GBPUSD | P | 778 | 0.1662 | 76.4781% |
| GBPUSD | R1 | 778 | 0.4459 | 42.0308% |
| GBPUSD | R2 | 778 | 0.8910 | 16.0668% |
| XAUUSD | S2 | 764 | 0.9066 | 16.4921% |
| XAUUSD | S1 | 764 | 0.4473 | 41.3613% |
| XAUUSD | P | 764 | 0.1534 | 75.7853% |
| XAUUSD | R1 | 764 | 0.4406 | 45.2880% |
| XAUUSD | R2 | 764 | 0.8755 | 18.9791% |
Calculation 3.2 Medians across the four series
| Level | Median touch rate | Median distance |
|---|---|---|
| P | 76.1317% | 0.1614 |
| R1 | 44.4306% | 0.4433 |
| S1 | 42.6601% | 0.4520 |
| R2 | 17.8443% | 0.8833 |
| S2 | 16.7095% | 0.9054 |
Observation 3.3: read on their own, the touch rates say price touches P on three days out of four. They agree well across the four series, from 73.2648% to 77.5064%.
Observation 3.4: but placing the distance beside them, the two orderings match. By touch rate the order is P, R1, S1, R2, S2; by nearness the order is also P, R1, S1, R2, S2. The correlation between distance and touch rate is −0.9791.
Observation 3.5: this is unremarkable in itself. A nearer level is more easily reached. What this paper checks is whether the name adds anything to that unremarkable fact.
4. Mixing in nameless levels built from the same days and the same previous-day ranges
Calculation 4.1 All eleven levels sorted by distance (evaluation period, median of four series)
| Level | Kind | Distance ÷ ATR | Median touch rate |
|---|---|---|---|
| P | real | 0.1614 | 76.1317% |
| +0.37 | fake | 0.3033 | 58.0445% |
| −0.37 | fake | 0.3176 | 55.0376% |
| R1 | real | 0.4433 | 44.4306% |
| S1 | real | 0.4520 | 42.6601% |
| +0.73 | fake | 0.6263 | 30.8179% |
| −0.73 | fake | 0.6628 | 30.3342% |
| R2 | real | 0.8833 | 17.8443% |
| S2 | real | 0.9054 | 16.7095% |
| +1.13 | fake | 1.0063 | 13.9564% |
| −1.13 | fake | 1.0284 | 12.4512% |
Observation 4.2: three of the nearest six are fake levels. The real and the fake do not group by kind; they group by distance.
Observation 4.3: the correlation across the eleven levels is −0.9788. That is no different from the −0.9791 measured on the real levels alone. Mixing in the fakes does not disturb the curve.
Observation 4.4: a touch-probability table can be attached to the fake levels just as well: "the +0.37 level is touched 58.0445% of the time". That number is right too. Being right does not make the level mean anything.
Observation 4.5: had the real levels stood off the curve, the names would have content. None of the five stands off.
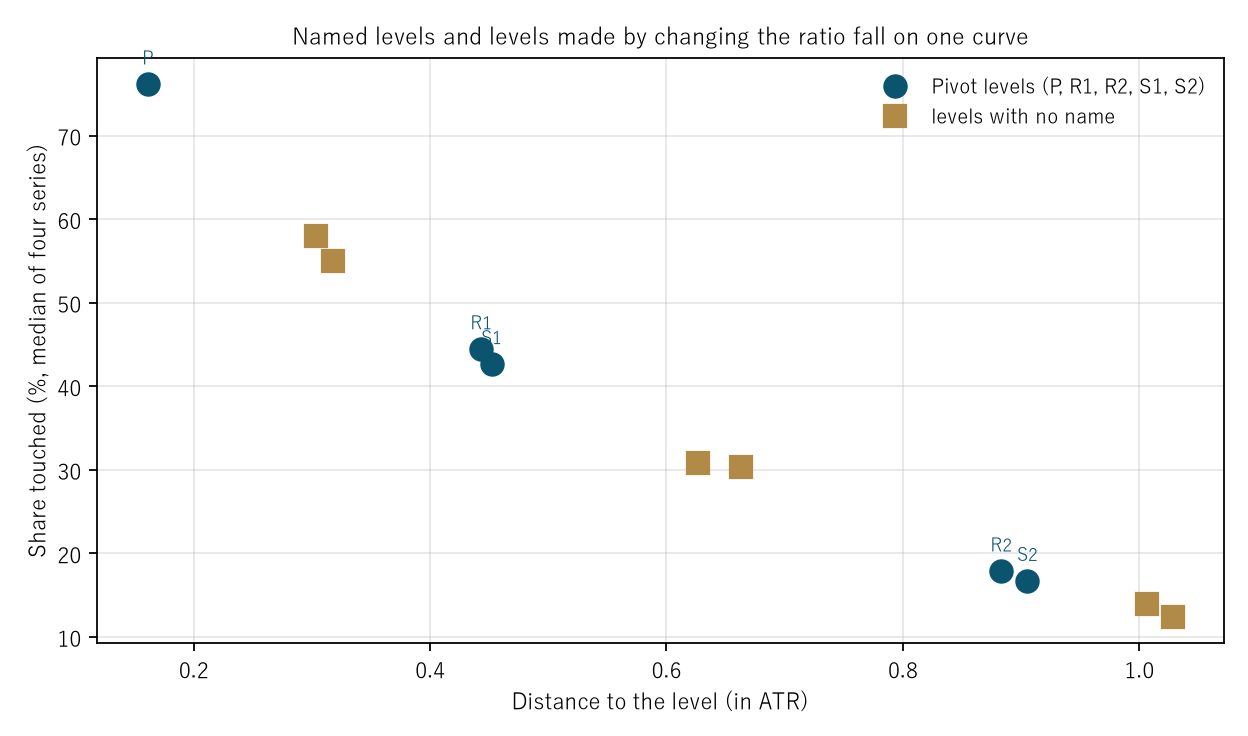
Figure 1: distance across, touch rate up. The dark points (the pivot levels) and the light points (the nameless levels) lie on one and the same curve.
5. Holding the distance fixed and comparing upper against lower levels
Calculation 5.1 Upper (R side) against lower (S side) within quintiles of distance (evaluation period)
| Instrument | Band | Distance ÷ ATR | Upper count | Upper touch rate | Lower count | Lower touch rate | Difference (points) |
|---|---|---|---|---|---|---|---|
| USDJPY | 1 | 0.1582 | 919 | 78.8901% | 793 | 73.7705% | +5.1196 |
| USDJPY | 2 | 0.3740 | 860 | 49.6512% | 851 | 45.0059% | +4.6453 |
| USDJPY | 3 | 0.5774 | 839 | 32.4195% | 873 | 30.0115% | +2.4081 |
| USDJPY | 4 | 0.8395 | 784 | 16.9643% | 927 | 20.4962% | −3.5319 |
| USDJPY | 5 | 1.3959 | 775 | 5.8065% | 937 | 6.8303% | −1.0239 |
| EURUSD | 1 | 0.1766 | 863 | 79.4902% | 849 | 78.7986% | +0.6916 |
| EURUSD | 2 | 0.3972 | 853 | 47.7140% | 858 | 48.6014% | −0.8874 |
| EURUSD | 3 | 0.6023 | 839 | 31.9428% | 873 | 31.7297% | +0.2131 |
| EURUSD | 4 | 0.8554 | 863 | 16.8019% | 848 | 17.8066% | −1.0047 |
| EURUSD | 5 | 1.3085 | 870 | 4.2529% | 842 | 5.2257% | −0.9728 |
| GBPUSD | 1 | 0.1742 | 867 | 77.5087% | 845 | 79.0533% | −1.5446 |
| GBPUSD | 2 | 0.4004 | 863 | 48.0881% | 848 | 48.8208% | −0.7327 |
| GBPUSD | 3 | 0.6051 | 841 | 27.9429% | 871 | 33.1803% | −5.2373 |
| GBPUSD | 4 | 0.8584 | 861 | 15.7956% | 850 | 17.1765% | −1.3809 |
| GBPUSD | 5 | 1.3212 | 841 | 5.1130% | 871 | 5.8553% | −0.7424 |
| XAUUSD | 1 | 0.1717 | 858 | 78.9044% | 823 | 74.4836% | +4.4208 |
| XAUUSD | 2 | 0.3958 | 836 | 52.6316% | 845 | 46.9822% | +5.6493 |
| XAUUSD | 3 | 0.6009 | 875 | 33.0286% | 805 | 30.1863% | +2.8422 |
| XAUUSD | 4 | 0.8510 | 826 | 18.5230% | 855 | 16.8421% | +1.6809 |
| XAUUSD | 5 | 1.3346 | 788 | 4.1878% | 893 | 7.1669% | −2.9790 |
Observation 5.2: the median difference across the 20 bands is −0.7375 points, the median absolute value is 1.6128 points, and the range runs from −5.2373 to +5.6493.
Observation 5.3: the signs do not agree across instruments. USDJPY and XAUUSD have the upper side higher in the near bands, while GBPUSD has the lower side higher. Not agreeing means this is noise, not direction.
Observation 5.4: only the farthest band (the fifth) has the lower side higher in all four series (differences of −1.0239, −0.9728, −0.7424 and −2.9790). That direction reads as "a market falls faster than it rises", but the touch rates in the far band are only 4.1878% to 7.1669%, so the amounts are small. This paper does not claim it. Only 1 of the 5 bands agreed across the four series.
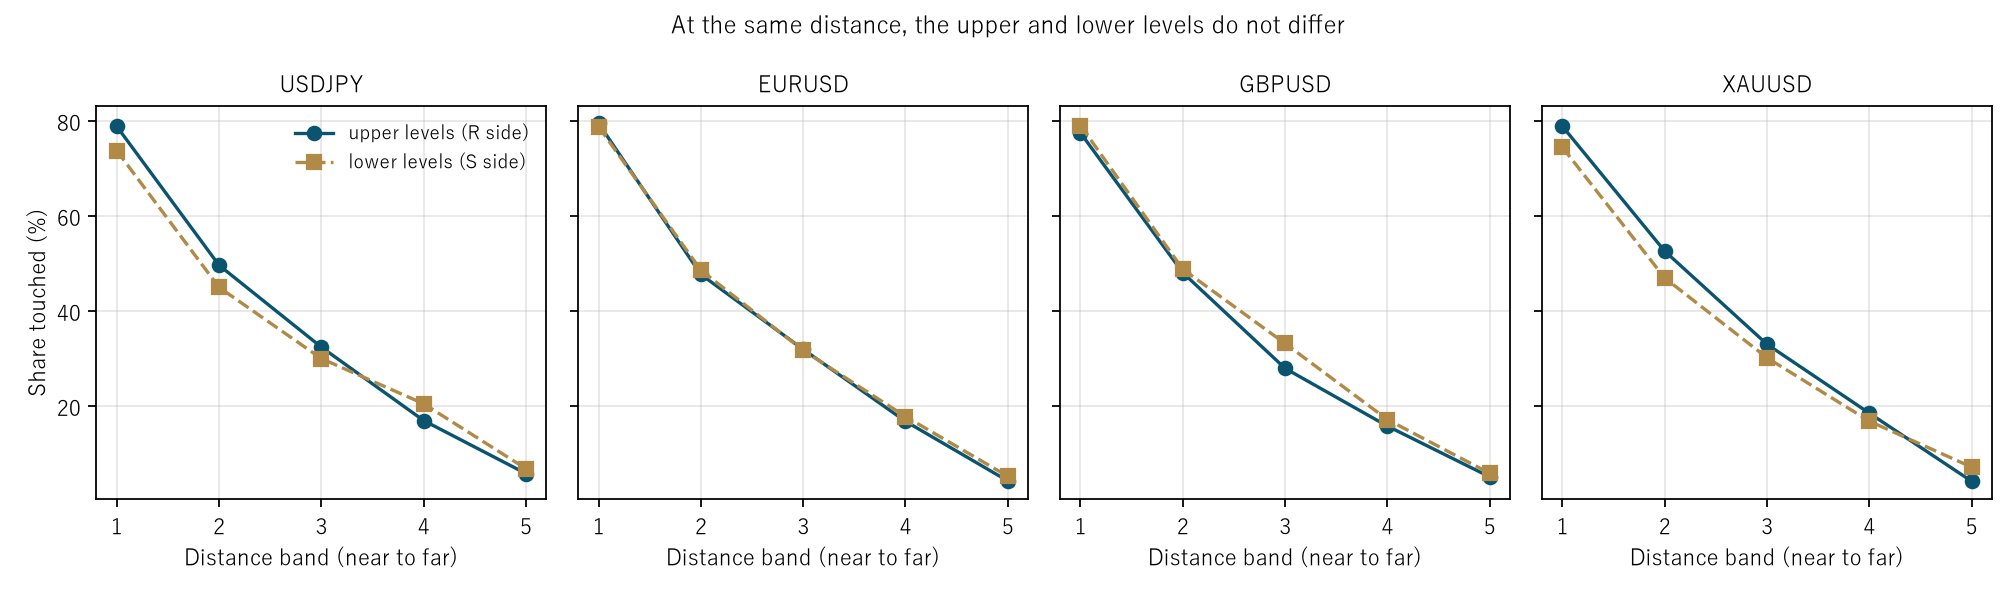
Figure 2: touch rate against distance band (near to far), one panel per instrument. The two lines, upper (R side) and lower (S side), lie on top of each other.
6. A touch probability and a win rate are different pairs of barriers
Design: on touching S1, buy, target P and stop at S2 (mirrored on the upper side). Only days resolved before the day ends are counted. By the optional stopping theorem the theoretical win rate is absolute value (S1 − S2) ÷ absolute value (P − S2).
Calculation 6.1 Theory against measurement (evaluation period)
| Instrument | Side | Count | Theoretical win rate | Measured win rate | Difference (points) | For reference, touch rate |
|---|---|---|---|---|---|---|
| USDJPY | lower | 215 | 49.6298% | 45.5814% | −4.0484 | 39.7172% |
| USDJPY | upper | 224 | 44.9638% | 34.3750% | −10.5888 | 45.7584% |
| EURUSD | lower | 212 | 48.3388% | 44.3396% | −3.9992 | 44.3445% |
| EURUSD | upper | 238 | 47.7006% | 50.4202% | +2.7195 | 43.5733% |
| GBPUSD | lower | 235 | 48.9970% | 48.0851% | −0.9119 | 43.9589% |
| GBPUSD | upper | 215 | 46.7442% | 48.8372% | +2.0930 | 42.0308% |
| XAUUSD | lower | 213 | 47.8966% | 50.2347% | +2.3381 | 41.3613% |
| XAUUSD | upper | 227 | 48.0822% | 41.8502% | −6.2320 | 45.2880% |
Observation 6.2: the median departure from theory is −2.4555 points, with a range from −10.5888 to +2.7195. With only 212 to 238 observations per case, that range is within noise.
Observation 6.3: this is where the confusion happens. The touch rate for P is 76.1317%, while the theoretical win rate of a trade targeting that same P is 44.9638% to 49.6298%. The two numbers differ by thirty points.
Observation 6.4: what differs is the number of barriers. The touch rate is one-sided: does price reach P starting from the open. The trade is two-sided: does price reach P from S1 before reaching S2. Seen from S1, P and S2 are about equally far away, and by the optional stopping theorem the win rate is therefore about one half.
Observation 6.5: the median touch rate is 43.7661% while the median trading win rate is 46.8333%. These two are close in value but they are not the same quantity. Closeness is no evidence of identity. It is precisely when values are close that one must check whether they are the same quantity.
7. Directional information from the bar of the touch onward
Calculation 7.1 A signal placed on the bar that touches any of the five levels (evaluation period)
| Instrument | Count | D (pips) | Dd (daily mean) | Daily t | Days | Per day | Spread | Buy/sell |
|---|---|---|---|---|---|---|---|---|
| USDJPY | 1,422 | −3.1690 | −2.9679 | −1.10 | 735 | 2.0 | 0.60 | 722/700 |
| EURUSD | 1,471 | 3.1891 | 2.2845 | 1.57 | 742 | 2.0 | 0.30 | 738/733 |
| GBPUSD | 1,461 | 1.5760 | 2.1260 | 1.03 | 743 | 2.0 | 0.90 | 759/702 |
| XAUUSD | 1,449 | −5.3562 | −3.8705 | −0.74 | 722 | 2.0 | 3.54 | 698/751 |
Observation 7.2: the median directional information is −0.7965 pips, against a median spread of 0.7500 pips. The sign is negative, so the side betting on the bounce is losing.
Observation 7.3: the daily t reaches 2 in absolute value in 0 of 4 cells. Chance gives about 0.2, so this cannot be told apart from chance.
Observation 7.4: the counts of buys and sells are nearly equal (722/700, 738/733, 759/702, 698/751). Upper and lower levels come up about equally often, which agrees with Section 5.
8. The baseline — a random walk has no previous day and no pivots
Calculation 8.1 Synthetic series whose within-bar movement is also random (10 realisations, evaluation period)
| Instrument | Level | Measured | Random walk | Difference (points) |
|---|---|---|---|---|
| USDJPY | P | 73.2648% | 73.8046% | −0.5398 |
| USDJPY | R1 | 45.7584% | 44.6658% | +1.0925 |
| USDJPY | S1 | 39.7172% | 44.4473% | −4.7301 |
| EURUSD | P | 77.5064% | 74.1774% | +3.3290 |
| EURUSD | R1 | 43.5733% | 45.0129% | −1.4396 |
| EURUSD | S1 | 44.3445% | 44.3059% | +0.0386 |
| GBPUSD | P | 76.4781% | 73.2519% | +3.2262 |
| GBPUSD | R1 | 42.0308% | 44.8972% | −2.8663 |
| GBPUSD | S1 | 43.9589% | 44.7044% | −0.7455 |
| XAUUSD | P | 75.7853% | 74.1623% | +1.6230 |
| XAUUSD | R1 | 45.2880% | 45.4058% | −0.1178 |
| XAUUSD | S1 | 41.3613% | 44.0707% | −2.7094 |
Observation 8.2: the median difference between measurement and random walk is −0.3288 points, with a median absolute value of 1.5313 points.
Observation 8.3: on a synthetic random walk the previous day's high and low mean nothing, and there is no support and no resistance. P is touched anyway, at 73.2519% to 74.1774%, and R1 and S1 at 44.0707% to 45.4058%.
Observation 8.4: the touch rate therefore says nothing about the market. What it says is only how near the level is.
9. Splitting by session
Design: five non-overlapping bins in Coordinated Universal Time. The signal is the one from Section 7 (the bounce on the bar of the touch).
Calculation 9.1 Directional information in each of the five bins (evaluation period)
| Instrument | Tokyo 0–7 | London 7–12 | Overlap 12–16 | NY late 16–21 | Night 21–24 |
|---|---|---|---|---|---|
| USDJPY | −3.09 (t −0.85) | −3.49 (t −0.79) | 0.24 (t −0.18) | −9.73 (t −0.63) | too few |
| EURUSD | 6.20 (t 2.38) | −0.42 (t −0.25) | 3.93 (t 1.76) | 2.24 (t 0.42) | too few |
| GBPUSD | 3.07 (t 0.95) | −0.64 (t 0.60) | 1.71 (t 0.91) | 3.75 (t 0.68) | too few |
| XAUUSD | −7.15 (t −0.62) | −4.79 (t −0.15) | −12.60 (t −0.86) | 34.70 (t 1.79) | too few |
Observation 9.2: the daily t reaches 2 in absolute value in 1 of 16 cells. Chance gives about 0.7, so the measurement is about what chance gives.
Observation 9.3: the one that looks significant is EURUSD in the Tokyo bin (t 2.38). Trying five bins across four series guarantees that one will look like this. What to read is not the individual cell but whether the number of significant cells exceeds chance.
Observation 9.4: the night bin had fewer than 30 signals and could not be measured in any of the four series. Levels are touched mostly while the market is moving, which is itself consistent with touch rates being set by distance.
10. Limitations
- ★ The day boundary is fixed at midnight Coordinated Universal Time. In practice pivots are usually built on a broker's boundary (17:00 New York and so on). Changing the boundary changes the previous day's high and low, and so moves the levels themselves. Only one boundary was tried here. The conclusions of Sections 4 and 5 (distance rather than name) follow from a level being, under any boundary, one line at some distance, so they should not depend on the boundary. But that was not measured.
- Equally spaced pivots and other variants are not treated. Variants exist that multiply the previous day's range by 0.5 or 1.0. The fake levels used here (0.37, 0.73, 1.13) are built the same way. In other words, the variants belong to the side this paper measured as "levels with no name".
- Section 6 counts only days resolved before the day ends. Days that reach neither barrier are dropped. Because of that truncation, the comparison with theory is that much looser.
- Section 6 has 212 to 238 observations per case. Differences of a few points are not visible.
- The distance uses ATR in the denominator. Another scale (the previous day's range itself, say) gives different values. The same scale is used for real and fake, so the comparison stands.
- The synthetic baseline uses independent normal increments. Volatility clustering is not included.
- Four instruments over six years. Nothing is said about other markets or other periods.
Conclusion
A table of pivot touch probabilities is right. P is touched 76.1317% of the time, R1 44.4306%, S2 16.7095%. Right across four series and six years, and in good agreement between them.
But a table of the same accuracy can be built for levels with no name and no derivation, made by multiplying the previous day's range by 0.37, 0.73 and 1.13. Sorting all eleven by distance puts three fakes among the nearest six, with a correlation of −0.9788. Holding distance fixed collapses the difference between up and down to a median of −0.7375 points, and a synthetic random walk gives the same rates.
What is right is the distance to the level, not the name of the level.
And the touch rate of 76.1317% and the theoretical win rate of 44.9638% to 49.6298% for a trade targeting that level belong to different pairs of barriers. A rate measured on one side cannot be used as a win rate on two.
Data and reproduction
| Data | Currency ticks from Dukascopy (agreement to the millisecond, bid and ask, verified from 2019 onward). Gold from Dukascopy |
| Period | 2019–2024 (six years). Evaluation 2022–2024 |
| Instruments | USDJPY, EURUSD, GBPUSD, XAUUSD |
| Bars | One hour, mid price, closing value of completed bars only. Bars with no ticks are not created |
| Day boundary | Midnight Coordinated Universal Time. Days with fewer than 12 bars are dropped |
| Verification | 検算/F009.py (with --zu it also writes the figures). Every number in the text is taken from 検算/F009_output.txt |
| Figures | 図/F009_zu1, 図/F009_zu2 (png, svg, English versions) |
| Random seeds | Fixed at 0–9. Re-running gives the same values |
| Audit of the foundation | _ツール/audit_bars.py (look-ahead in the bars, daylight saving, the day boundary). The record is _土台の検査.txt |
References
- Yamagishi, Y. (2026). The Table Is Right and the Trade Still Loses [Paper 423]. Zenodo. 10.5281/zenodo.22700114
- Yamagishi, Y. (2026). The %K of Stochastics Is the Position in the Range Itself [F006]. Zenodo. 10.5281/zenodo.22881505
- Yamagishi, Y. (2026). The Fibonacci Ratios Carry No Privilege [F008]. Zenodo. 10.5281/zenodo.22881668
Reference
Yamagishi, Y. (2026). The Probability of Touching a Pivot Level Is a Restatement of the Distance to It [F009]. Zenodo.
DOI: 10.5281/zenodo.22881708
YOI: https://www.yamagishiyuuki.com/yoi/F009
ORCID: 0009-0006-8587-3450
PDF (English) · PDF (Japanese) · Date proof of the English PDF (OpenTimestamps .ots) · SHA256SUMS
The record page for this paper (in Japanese, with the PDFs in each language and the date proof): YOI F009. This paper is a preprint and has not been peer reviewed.