Abstract
This paper asks whether round numbers attract price — the answer is that they do not. It claims neither a new mathematical theorem nor a new law.
First, the median share of days on which price touches a round number on a 50 pip grid is 68.1877%. For levels on the same 50 pip grid merely shifted by 25 pips — with no name and no meaning — it is 70.3728%. The difference is −2.1851 points, with the fake higher (Section 3).
Second, and this is the core of the paper, the fake levels were touched more often in all eight cells (four series times up and down). And this although the fake levels sit slightly farther from the open in median distance (0.2142 against 0.2085) (Section 3).
Third, cutting into quintiles of distance and comparing within each band, the round numbers are higher in only 6 of 20 bands. Chance gives 10.0, so the measurement is below chance. The median difference is −1.7972 points (Section 4).
Fourth, the share retracing half a true range in the opposite direction after a touch is 34.1199% for round numbers and 33.9213% for the fakes, a difference of +0.1986 points. "Price bounces at round numbers" does not hold either (Section 3).
Fifth, measuring the distance from the close to the nearest round number, the mean is 0.2186 pips farther than the 12.5 pips chance would give. The distance to the fake levels is 0.2186 pips nearer instead. Attraction of the "it closes on the big figure" kind comes out with the opposite sign (Section 5).
Sixth, repeating the measurement on synthetic series built from independent normal increments down to the movement inside each bar, the median difference in touch rate is −0.5291 points, with a median absolute value of 0.9436 points. A synthetic random walk has no round numbers and no big figures, and gives the same rates anyway (Section 7).
Scope of this paper (scope note): No new mathematical theorem and no new law is claimed — price grids, the true range and random walks are all known. No particular product or proponent is discussed — no real course, author, or vendor is the subject here, and none is named. What is treated is the public turn of phrase itself. Trading is not discussed — what is measured is touch rates, bounce rates, the distance of the close and directional information, not trading performance including commissions, fills and money management. The scope is intraday and a small number of instruments — four series, six years, one-hour bars. Monthly time-series momentum (dozens of markets, holding one to twelve months) is documented in the literature, and this paper does not contradict it. The grid is fixed at 50 and 100 pips — a 10 pip grid, or particular levels said to matter in a particular instrument, are not treated (Section 9). The order book is not observed — whether orders actually rest at a big figure cannot be measured from price bars. What this paper denies is attraction that shows up on the price side, not the contents of the book. No forecast is claimed. Relation to earlier papers: this series always reports, alongside a rate, what that rate would be by chance. F008 placed fake ratios in the same band and F009 built nameless levels from the same days — this paper applies the same move to round numbers. What is added here is shifting by half while keeping the spacing identical, placing the distance of the close beside what chance would give, and counting how many cells the fake won.
1. Notation and the question
There is a way of speaking that says "round figures are watched" and "orders pile up at the big figure".
| Name | How it is drawn |
|---|---|
| Big figure | every 100 pips |
| Round number | every 50 pips |
| The fake level used here | a round number shifted by 25 pips |
Observation 1.1: the observation "price touched a round number" says nothing on its own. Price moves, so it touches levels that are near. A round number exists every 50 pips, so one is always near.
Observation 1.2: the question settles by placing meaningless levels on the same grid. Shifting the round numbers by 25 pips keeps the spacing at 50 pips and removes only the roundness. If no difference appears, round numbers do not attract.
Observation 1.3: what cannot be measured here should be said first. The contents of the order book are not visible in price bars. The claim "orders pile up at the big figure" is itself outside the scope. What is measured here is whether that pile shows up in how price moves.
Question: do round numbers attract price more than levels that are not round?
2. Writing the quantity and the design in advance
Design (declared before running and unchanged at run time)
| Item | Decision |
|---|---|
| Day boundary | midnight Coordinated Universal Time. Days with fewer than 12 bars are dropped |
| Round numbers | a 50 pip grid. Big figures are a 100 pip grid |
| Fake levels | the same 50 pip grid shifted by 25 pips |
| How they are taken | the nearest one above and the nearest one below the day's open |
| Distance | absolute value of (level − the day's open) ÷ ATR (mean true range of the previous 14 days) |
| Touch rate | the share of days on which some bar's high and low straddled the level |
| Bounce rate | the share retracing 0.5 of a true range in the opposite direction after a touch |
| Distance of the close | the distance from the day's close to the nearest level (pips) |
| Directional information | the price move in the bounce direction over 24 bars from the bar of the touch (pips) |
| Bars | one hour, mid price, completed bars only |
| Instruments | USDJPY, EURUSD, GBPUSD, XAUUSD |
| Period | 2019–2024. Evaluation 2022–2024 |
Observation 2.1: the round numbers and the fake levels have identical spacing and are taken in the same way. The only difference is that the fakes sit 25 pips away, and are therefore not round.
Observation 2.2: the ATR does not use the current day. It is built from the previous 14 days.
Observation 2.3: the directional signal is placed on the bar of the touch. Placing it before the touch puts "price moved toward the level" into the condition, so betting against that move loses by construction.
One pip is 0.01 for USDJPY, 0.0001 for EURUSD and GBPUSD, and 0.1 for XAUUSD. The day counts are 1,555 for USDJPY, EURUSD and GBPUSD (778 in evaluation) and 1,524 for XAUUSD (764).
3. Placing round numbers beside levels merely shifted — this is the separator
Calculation 3.1 Touch rate and bounce rate (evaluation period)
| Instrument | Kind | Side | Days | Distance ÷ ATR | Touch rate | Bounce rate |
|---|---|---|---|---|---|---|
| USDJPY | round | above | 778 | 0.1785 | 71.0797% | 30.3797% |
| USDJPY | round | below | 778 | 0.1866 | 69.7943% | 34.0700% |
| USDJPY | fake | above | 778 | 0.1982 | 73.3933% | 32.2242% |
| USDJPY | fake | below | 778 | 0.1846 | 71.3368% | 35.1351% |
| USDJPY | big figure | above | 778 | 0.3861 | 48.9717% | 26.7717% |
| USDJPY | big figure | below | 778 | 0.3727 | 50.7712% | 32.1519% |
| EURUSD | round | above | 778 | 0.3118 | 56.2982% | 34.9315% |
| EURUSD | round | below | 778 | 0.3107 | 58.6118% | 29.3860% |
| EURUSD | fake | above | 778 | 0.3053 | 59.7686% | 33.1183% |
| EURUSD | fake | below | 778 | 0.3229 | 61.5681% | 32.9854% |
| EURUSD | big figure | above | 778 | 0.6498 | 33.1620% | 32.5581% |
| EURUSD | big figure | below | 778 | 0.6208 | 37.5321% | 25.3425% |
| GBPUSD | round | above | 778 | 0.2304 | 66.5810% | 34.1699% |
| GBPUSD | round | below | 778 | 0.2580 | 65.2956% | 33.8583% |
| GBPUSD | fake | above | 778 | 0.2578 | 66.7095% | 36.8015% |
| GBPUSD | fake | below | 778 | 0.2302 | 69.4087% | 32.9630% |
| GBPUSD | big figure | above | 778 | 0.4690 | 44.8586% | 37.8223% |
| GBPUSD | big figure | below | 778 | 0.4823 | 44.3445% | 31.0145% |
| XAUUSD | round | above | 764 | 0.0965 | 86.2565% | 36.1153% |
| XAUUSD | round | below | 764 | 0.0924 | 85.2094% | 37.3272% |
| XAUUSD | fake | above | 764 | 0.0884 | 87.8272% | 34.7243% |
| XAUUSD | fake | below | 764 | 0.0948 | 85.8639% | 39.1768% |
| XAUUSD | big figure | above | 764 | 0.1845 | 73.8220% | 31.9149% |
| XAUUSD | big figure | below | 764 | 0.1848 | 71.0733% | 33.5175% |
Calculation 3.2 Medians by kind
| Kind | Median touch rate | Median bounce rate | Median distance |
|---|---|---|---|
| round | 68.1877% | 34.1199% | 0.2085 |
| fake | 70.3728% | 33.9213% | 0.2142 |
| big figure | 46.9152% | 32.0334% | 0.4275 |
Observation 3.3: the difference in touch rate is −2.1851 points, with the fake higher. And the fake was higher in all eight cells.
Observation 3.4: the fake levels sit farther from the open (median distance 0.2142 against 0.2085). Farther, yet touched more often. Attraction, were it there, would point the other way.
Observation 3.5: the difference in bounce rate is +0.1986 points, that is, the same (34.1199% against 33.9213%). "Price bounces at round numbers" does not hold either.
Observation 3.6: the big figures (a 100 pip grid) are touched 46.9152% of the time, less than the round numbers. Not because big figures are special, but because their median distance is 0.4275, twice as far.
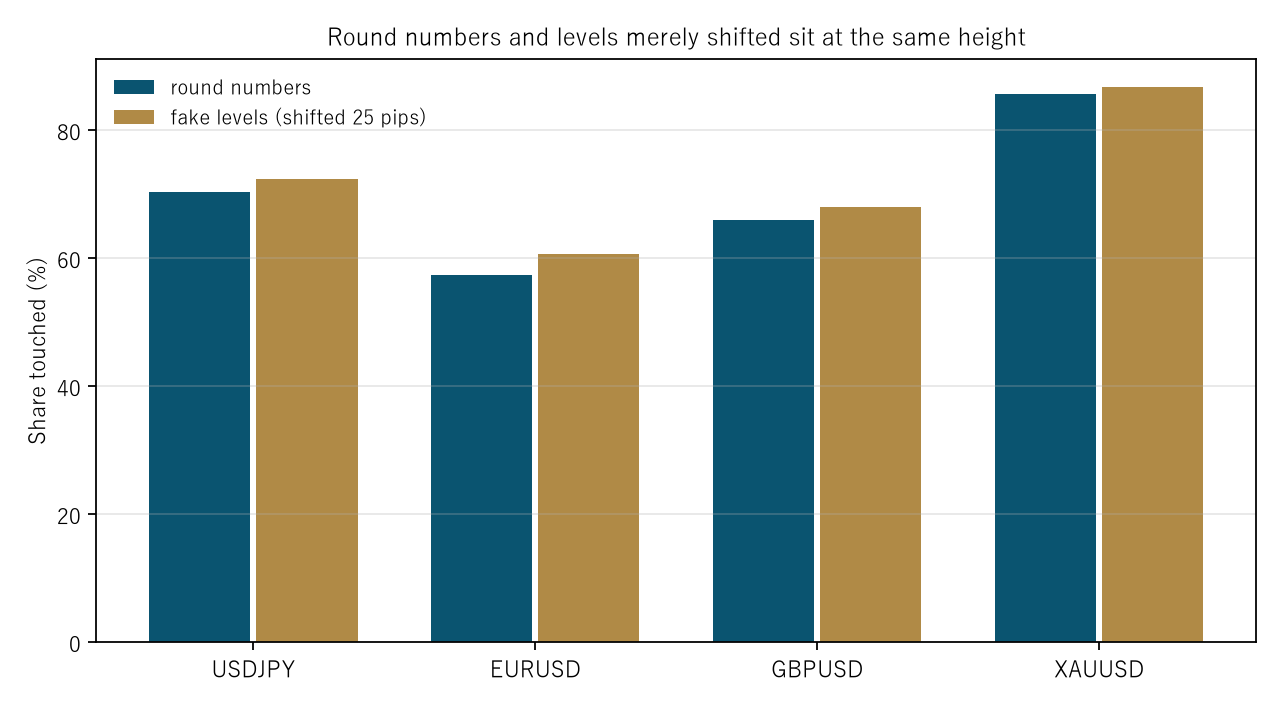
Figure 1: touch rate by instrument (mean of the two sides). The dark bars (round numbers) are lower than the light ones (fakes).
4. Holding the distance fixed
Calculation 4.1 Comparison within quintiles of distance (evaluation period)
| Instrument | Band | Distance ÷ ATR | Round count | Round | Fake count | Fake | Difference (points) |
|---|---|---|---|---|---|---|---|
| USDJPY | 1 | 0.0404 | 311 | 93.8907% | 312 | 95.5128% | −1.6221 |
| USDJPY | 2 | 0.1120 | 314 | 82.8025% | 308 | 82.1429% | +0.6597 |
| USDJPY | 3 | 0.1869 | 319 | 71.4734% | 303 | 70.9571% | +0.5163 |
| USDJPY | 4 | 0.2650 | 300 | 62.0000% | 322 | 65.2174% | −3.2174 |
| USDJPY | 5 | 0.4074 | 312 | 41.6667% | 311 | 48.2315% | −6.5648 |
| EURUSD | 1 | 0.0625 | 291 | 90.0344% | 332 | 93.3735% | −3.3391 |
| EURUSD | 2 | 0.1883 | 331 | 71.9033% | 291 | 76.2887% | −4.3853 |
| EURUSD | 3 | 0.3140 | 330 | 54.8485% | 292 | 59.9315% | −5.0830 |
| EURUSD | 4 | 0.4436 | 302 | 42.7152% | 320 | 44.6875% | −1.9723 |
| EURUSD | 5 | 0.6445 | 302 | 27.8146% | 321 | 29.2835% | −1.4689 |
| GBPUSD | 1 | 0.0515 | 307 | 91.8567% | 316 | 96.2025% | −4.3459 |
| GBPUSD | 2 | 0.1460 | 313 | 82.4281% | 309 | 81.5534% | +0.8747 |
| GBPUSD | 3 | 0.2431 | 317 | 69.4006% | 305 | 68.5246% | +0.8760 |
| GBPUSD | 4 | 0.3601 | 311 | 51.4469% | 311 | 51.7685% | −0.3215 |
| GBPUSD | 5 | 0.5101 | 308 | 34.4156% | 315 | 42.2222% | −7.8066 |
| XAUUSD | 1 | 0.0196 | 306 | 97.0588% | 305 | 95.7377% | +1.3211 |
| XAUUSD | 2 | 0.0552 | 303 | 90.0990% | 308 | 91.5584% | −1.4594 |
| XAUUSD | 3 | 0.0925 | 307 | 84.6906% | 305 | 89.8361% | −5.1455 |
| XAUUSD | 4 | 0.1305 | 309 | 77.6699% | 301 | 83.0565% | −5.3866 |
| XAUUSD | 5 | 0.1894 | 303 | 79.2079% | 309 | 74.1100% | +5.0979 |
Observation 4.2: the median difference is −1.7972 points, the median absolute value is 2.5948 points, and the range runs from −7.8066 to +5.0979.
Observation 4.3: the round numbers are higher in 6 of the 20 bands. Chance gives 10.0, so the measurement is below chance. Attraction would put it above 10.
Observation 4.4: the differences span nearly 13 points and change sign from band to band. That is not an effect but the scatter of about 300 observations per band. When the scatter is larger than the effect, no single band means anything.
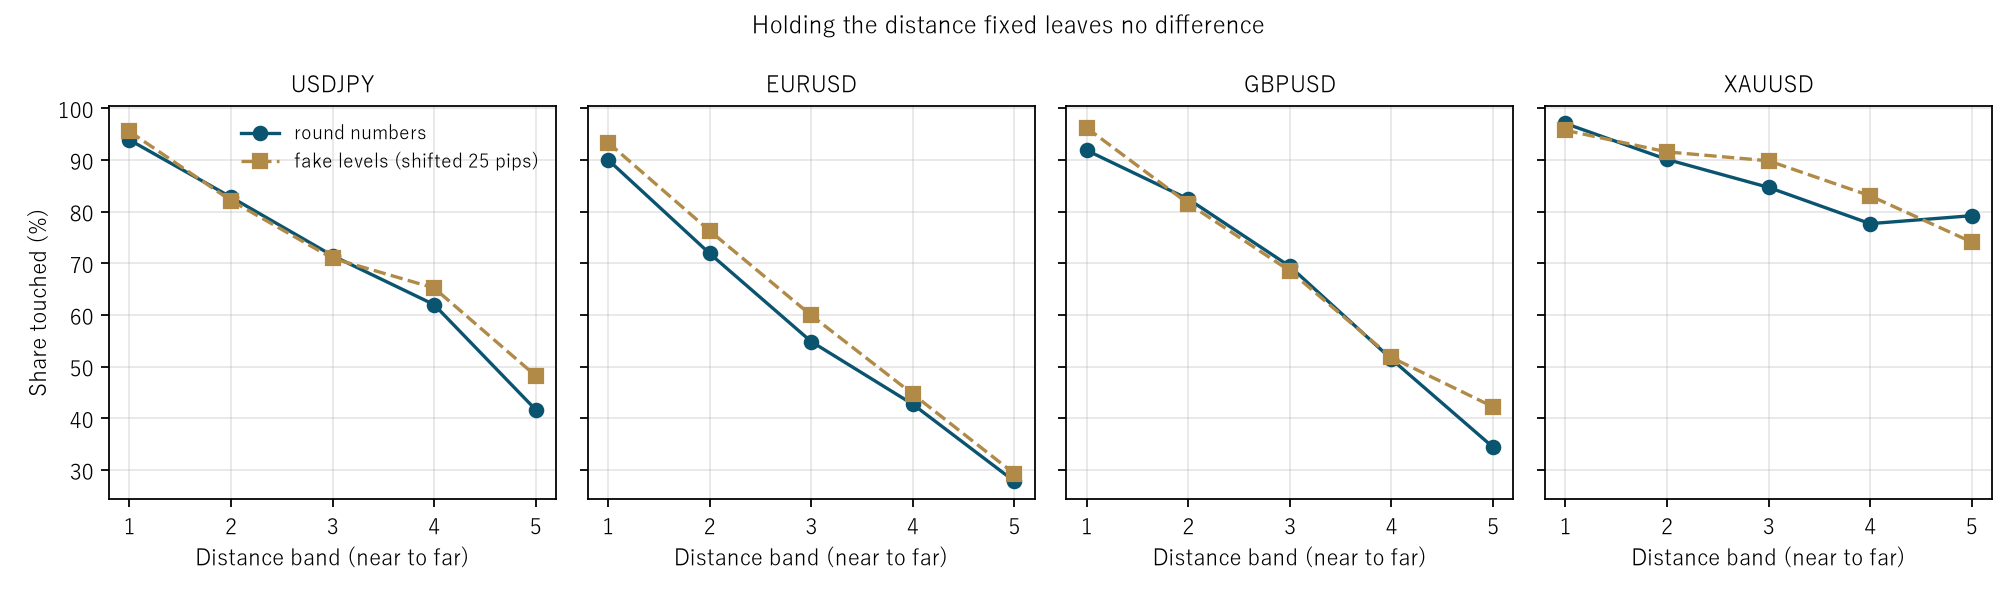
Figure 2: touch rate against distance band (near to far), one panel per instrument. The round numbers (dark solid) and the fakes (light dashed) lie on top of each other.
5. Does price close near a round number?
Calculation 5.1 Distance from the close to the nearest level (evaluation period, pips)
| Instrument | Round, median | Fake, median | Round, mean | Fake, mean | Chance |
|---|---|---|---|---|---|
| USDJPY | 13.2000 | 11.8000 | 13.0005 | 11.9995 | 12.5000 |
| EURUSD | 12.8250 | 12.1750 | 12.7450 | 12.2550 | 12.5000 |
| GBPUSD | 12.5000 | 12.5000 | 12.6923 | 12.3077 | 12.5000 |
| XAUUSD | 12.8675 | 12.1325 | 12.6304 | 12.3696 | 12.5000 |
Observation 5.2: with a 50 pip grid, a close scattered uniformly sits a mean of 12.5 pips from the nearest level. That is the baseline.
Observation 5.3: the mean distance to a round number is 0.2186 pips farther than chance. The distance to the fake levels is 0.2186 pips nearer instead. Attraction would make only the distance to round numbers smaller than 12.5. The sign comes out the other way.
Observation 5.4: but 0.2186 pips is smaller than the spread (0.30 to 3.67 pips). ★ This paper does not read it as "round numbers repel price". What it reads is that no attraction was found, not that repulsion was found.
Observation 5.5: all four series point the same way (round numbers farther). Signs agreeing and being distinguishable from noise are two different things.
6. Directional information from the bar of the touch onward
Calculation 6.1 A signal placed on the bar that touches a level (evaluation period)
| Instrument | Kind | Count | D (pips) | Dd (daily mean) | Daily t | Spread | Buy/sell |
|---|---|---|---|---|---|---|---|
| USDJPY | round | 1,066 | −2.9051 | −14.0399 | −5.32 | 0.70 | 514/552 |
| USDJPY | fake | 1,105 | −0.4553 | −12.5107 | −4.76 | 0.70 | 535/570 |
| EURUSD | round | 891 | 3.2300 | −2.6786 | −1.56 | 0.30 | 453/438 |
| EURUSD | fake | 941 | 1.9870 | −4.1043 | −2.57 | 0.30 | 476/465 |
| GBPUSD | round | 1,022 | −0.5125 | −9.3316 | −4.24 | 0.90 | 505/517 |
| GBPUSD | fake | 1,057 | 3.1725 | −5.3558 | −2.55 | 0.90 | 538/519 |
| XAUUSD | round | 1,269 | −0.8251 | −19.6345 | −4.11 | 3.67 | 611/658 |
| XAUUSD | fake | 1,288 | −1.8262 | −21.2039 | −4.77 | 3.67 | 618/670 |
Observation 6.2: the median directional information is −0.6688 pips for round numbers and +0.7658 pips for the fakes. The fake is better.
Observation 6.3: the daily t reaches 2 in absolute value in 3 of 4 cells for round numbers and 4 of 4 for the fakes. The fake levels are the ones that come out "significant".
Observation 6.4: this does not mean the fake levels carry information. Dd is strongly negative for both, and both produce the same shape: betting on the bounce after a touch loses. That is a property of betting on the bounce, not a distinction between round and not round.
Observation 6.5: this measurement looks h = 24 bars ahead, so observations can overlap. With 1.0 to 2.0 observations per day the overlap across days is limited. Even so, D and Dd disagree in sign in some cells, so neither may be reported alone.
7. The baseline — a random walk has no round numbers and no big figures
Calculation 7.1 Synthetic series whose within-bar movement is also random (10 realisations, evaluation period)
| Instrument | Kind | Measured touch rate | Random walk | Difference (points) |
|---|---|---|---|---|
| USDJPY | round | 70.4370% | 70.9062% | −0.4692 |
| USDJPY | fake | 72.3650% | 71.0668% | +1.2982 |
| EURUSD | round | 57.4550% | 60.7069% | −3.2519 |
| EURUSD | fake | 60.6684% | 60.7712% | −0.1028 |
| GBPUSD | round | 65.9383% | 70.4820% | −4.5437 |
| GBPUSD | fake | 68.0591% | 70.7005% | −2.6414 |
| XAUUSD | round | 85.7330% | 86.3220% | −0.5890 |
| XAUUSD | fake | 86.8455% | 86.3743% | +0.4712 |
Observation 7.2: the median difference between measurement and random walk is −0.5291 points, with a median absolute value of 0.9436 points.
Observation 7.3: a synthetic random walk has no orders, no psychology and no round numbers. The same rates come out anyway. The touch rate therefore says nothing about the market.
Observation 7.4: even on the random walk the gap between round and fake scatters from −0.4692 to +1.2982. That scatter is of the same order as the measured difference of −2.1851. ★ Before reading the measured difference as an effect, look at how wide the same gap is on a random walk.
8. Splitting by session
Design: five non-overlapping bins in Coordinated Universal Time. The signal is the round-number one from Section 6.
Calculation 8.1 Directional information in each of the five bins (evaluation period)
| Instrument | Tokyo 0–7 | London 7–12 | Overlap 12–16 | NY late 16–21 | Night 21–24 |
|---|---|---|---|---|---|
| USDJPY | −0.78 (t −1.49) | 2.88 (t 0.32) | −7.67 (t −0.77) | −42.79 (t −2.46) | too few |
| EURUSD | 1.30 (t 0.38) | 0.92 (t 0.16) | 7.89 (t 1.82) | 12.39 (t 1.79) | too few |
| GBPUSD | −2.08 (t −0.89) | 1.36 (t 0.06) | 3.85 (t 0.72) | −13.09 (t −0.94) | too few |
| XAUUSD | 0.05 (t −1.28) | −13.38 (t −0.86) | 9.51 (t 0.58) | too few | too few |
Observation 8.2: the daily t reaches 2 in absolute value in 1 of 15 cells. Chance gives about 0.7, so the measurement is about what chance gives.
Observation 8.3: the one that looks significant is USDJPY in NY late (−42.79, t −2.46). This paper does not claim it. Trying four series across five bins guarantees that one will look like this.
Observation 8.4: the night bin in all four series, and NY late for XAUUSD, had too few observations to measure. Levels are touched mostly while the market is moving.
9. Limitations
- ★ The grid is fixed at 50 and 100 pips. A 10 pip grid, and particular levels said to matter in a particular instrument (a round number that coincides with a historical high or low, say), are not treated. What is denied is the round number drawn mechanically as a grid.
- ★ The order book is not observed. Whether orders rest at a big figure cannot be measured from price bars. What is denied is whether that pile shows up in how price moves.
- The fake levels are placed one way, shifted by 25 pips. Another shift gives different figures. Section 4 compares at matched distance, so it does not depend on the shift.
- The bounce is judged at 0.5 of a true range. Another width changes the bounce rate. The same width is used for round and fake, so the comparison stands.
- Section 6 looks 24 bars ahead, so observations can overlap. With 1.0 to 2.0 per day the overlap across days is limited, but D and Dd disagree in sign in some cells.
- The synthetic baseline uses independent normal increments. Volatility clustering is not included.
- Four instruments over six years. Nothing is said about other markets or other periods.
Conclusion
Price touches a round number on 68.1877% of days, and after touching it retraces 34.1199% of the time. Numbers that read as "they are being watched".
But levels on the same 50 pip grid merely shifted by 25 pips — with no name and no meaning — gave a touch rate of 70.3728% and a bounce rate of 33.9213%. The fake was touched more often in all eight cells, and it sits farther from the open.
Holding the distance fixed, the round numbers are higher in only 6 of 20 bands (chance gives 10.0). The close sits 0.2186 pips farther from a round number than the 12.5 pips chance would give. A synthetic random walk gives the same rates.
Roundness does not show up on the price side. What is attracted is not the price but us, for whom those digits are easy to see.
And what this paper could measure is only what reaches the price bars. About what rests in the order book, nothing is answered here.
Data and reproduction
| Data | Currency ticks from Dukascopy (agreement to the millisecond, bid and ask, verified from 2019 onward). Gold from Dukascopy |
| Period | 2019–2024 (six years). Evaluation 2022–2024 |
| Instruments | USDJPY, EURUSD, GBPUSD, XAUUSD |
| Bars | One hour, mid price, closing value of completed bars only. Bars with no ticks are not created |
| Day boundary | Midnight Coordinated Universal Time. Days with fewer than 12 bars are dropped |
| Verification | 検算/F011.py (with --zu it also writes the figures). Every number in the text is taken from 検算/F011_output.txt |
| Figures | 図/F011_zu1, 図/F011_zu2 (png, svg, English versions) |
| Random seeds | Fixed at 0–9. Re-running gives the same values |
| Audit of the foundation | _ツール/audit_bars.py (look-ahead in the bars, daylight saving, the day boundary). The record is _土台の検査.txt |
References
- Yamagishi, Y. (2026). The Fibonacci Ratios Carry No Privilege [F008]. Zenodo. 10.5281/zenodo.22881668
- Yamagishi, Y. (2026). The Probability of Touching a Pivot Level Is a Restatement of the Distance to It [F009]. Zenodo. 10.5281/zenodo.22881708
Reference
Yamagishi, Y. (2026). Round Numbers Do Not Attract Price [F011]. Zenodo.
DOI: 10.5281/zenodo.22891487
YOI: https://www.yamagishiyuuki.com/yoi/F011
ORCID: 0009-0006-8587-3450
PDF (English) · PDF (Japanese) · Date proof of the English PDF (OpenTimestamps .ots) · SHA256SUMS
The record page for this paper (in Japanese, with the PDFs in each language and the date proof): YOI F011. This paper is a preprint and has not been peer reviewed.