Abstract
This paper asks what moves and what does not when the brick size of a renko chart is changed — the answer is that the time moves, and the leg length moved too. It claims neither a new mathematical theorem nor a new law.
First, changing the brick size from 1 to 16 times moves the mean clock time per brick from 6.1214 minutes to 397.0326 minutes, a factor of 64.8597 (USDJPY). The count falls from 257,348 to 3,964 bricks (Section 3).
Second, the prediction written in advance failed. If price were a diffusion the time would go as the square of the size, but the log-log slope runs from 1.5074 to 1.5449, with a median of 1.5250. The departure from the prediction is −0.4750 (Section 3).
Third, the second prediction failed too. "The leg length — the number of bricks in a row in the same direction — does not depend on the size" was written down, but the median mean leg falls from 5.1897 at 1 times to 2.3517 at 16 times, a ratio of 0.4357 to 0.4967 (Section 4).
Fourth, and this is the core of the paper, on a synthetic series known to carry zero directional information the slope is 1.5626 to 1.6016. The median difference against the measurement is only −0.0474. Both failures are made not by the market but by the coarseness of the five-minute bars the bricks were built from (Section 5).
Fifth, the share of legs that reversed after a single brick is 20.7604% at 1 times and 42.4257% at 16 times. The coarser the brick, the closer it gets to a walk taken at random on the lattice (Section 4).
Sixth, placing a signal on the direction of each brick and measuring 24 hours ahead, the daily t reaches 2 in absolute value in 0 of 20 cells, against about 0.9 by chance. The median spread is 0.8000 pips (Section 6).
Scope of this paper (scope note): No new mathematical theorem and no new law is claimed — how a renko chart is built, diffusion and random walks are all known. No particular product or proponent is discussed — no real course, author, or vendor is the subject here, and none is named. What is treated is the public bar type itself. Trading is not discussed — what is measured is counts, times, leg lengths and directional information, not trading performance including commissions, fills and money management. The scope is intraday and a small number of instruments — four series over three years. Monthly time-series momentum (dozens of markets, holding one to twelve months) is documented in the literature, and this paper does not contradict it. ★ The source bars are fixed at five-minute closes — the movement inside a bar is not used. That coarseness is the cause of both failures in this paper (Sections 5 and 7). Reversals are not treated specially — a brick is laid whenever price moves one brick away; the convention requiring two is not treated. No forecast is claimed. Relation to earlier papers: this series writes the prediction before measuring and writes it down when it fails. F001 showed that the "period" of a moving-average crossover comes from the ratio of the two periods — this paper asks the same kind of question of a bar type cut by price rather than by time. What is added here is writing two predictions and failing both, and placing those failures beside a synthetic random walk to show that the cause is the lattice.
1. Notation and the question — writing the predictions first
A renko chart is cut by price rather than by time: a brick is laid whenever price moves a fixed distance.
| Bar type | What cuts it | What one bar means |
|---|---|---|
| Clock bars | time | the convention of five minutes or an hour |
| Renko | price movement | that price moved the chosen distance |
| What this paper asks | what moves when the size is changed |
Observation 1.1: it is said that "the noise of time disappears" and "only what matters is left". But a person chooses the size. Change it and the same market yields a different sequence of bars.
Observation 1.2: Prediction A. If price is a diffusion — a process whose increment variance grows with time — the clock time to lay one brick of size k goes as the square of k.
Observation 1.3: Prediction B. The leg length (the number of bricks in a row in the same direction) is a property of a walk on the lattice and should therefore not depend on k.
Observation 1.4: ★ both were written before measuring. In the other order, any result can be read as "as predicted". And in this paper both failed.
Question: when the brick size is changed, what moves and what does not?
2. Writing the quantity and the design in advance
Design (declared before running and unchanged at run time)
| Item | Decision |
|---|---|
| Source bars | closes only of five-minute bars (mid price, completed bars only) |
| Brick | one brick whenever price moves k away from the previous brick's close. Reversals are not treated specially |
| Size k | 1, 2, 4, 8, 16 times the median five-minute move of that instrument |
| Leg | the number of bricks in a row in the same direction |
| Time per brick | the difference in timestamps between consecutive bricks (minutes); 0 when several are laid on one bar |
| Directional information | a signal (the brick's direction) on the bar that laid it, over the next 288 bars (24 hours) |
| Baseline | synthetic series random down to the movement inside each bar (5 realisations) |
| Instruments | USDJPY, EURUSD, GBPUSD, XAUUSD |
| Period | 2019–2024. Evaluation 2022–2024 |
Observation 2.1: ★ the movement inside a bar is not used. Using it would lay several bricks within one bar, and when each was laid would stop being defined. With closes only, the time of each brick is unique.
Observation 2.2: the price is that movement finer than five minutes is invisible. With a small brick, a round trip inside one bar is not seen, and several bricks are laid in the same direction. Section 5 shows this is the cause of both failures.
Observation 2.3: the size is set per instrument. Fixing it in pips would mean something different in each. The median five-minute move is 2.1000 pips for USDJPY, 1.3000 for EURUSD, 1.7500 for GBPUSD and 4.7000 for XAUUSD.
3. The time moves a great deal with the size
Calculation 3.1 Brick counts and time per brick (evaluation period)
| Instrument | Multiple | Size (pips) | Bricks | Minutes per brick (median) | (mean) |
|---|---|---|---|---|---|
| USDJPY | 1 | 2.1000 | 257,348 | 0.0000 | 6.1214 |
| USDJPY | 2 | 4.2000 | 104,245 | 5.0000 | 15.1118 |
| USDJPY | 4 | 8.4000 | 38,124 | 15.0000 | 41.3219 |
| USDJPY | 8 | 16.8000 | 12,711 | 40.0000 | 123.9347 |
| USDJPY | 16 | 33.6000 | 3,964 | 130.0000 | 397.0326 |
| EURUSD | 1 | 1.3000 | 257,722 | 0.0000 | 6.1126 |
| EURUSD | 16 | 20.8000 | 3,791 | 140.0000 | 415.5079 |
| GBPUSD | 1 | 1.7500 | 250,933 | 0.0000 | 6.2780 |
| GBPUSD | 16 | 28.0000 | 3,664 | 135.0000 | 429.9017 |
| XAUUSD | 1 | 4.7000 | 235,535 | 0.0000 | 6.6881 |
| XAUUSD | 16 | 75.2000 | 3,268 | 160.0000 | 481.8090 |
Calculation 3.2 Against Prediction A
| Instrument | Mean minutes at 1× | at 16× | Ratio | Log-log slope | Diffusion prediction |
|---|---|---|---|---|---|
| USDJPY | 6.1214 | 397.0326 | 64.8597 | 1.5074 | 2.0000 |
| EURUSD | 6.1126 | 415.5079 | 67.9752 | 1.5230 | 2.0000 |
| GBPUSD | 6.2780 | 429.9017 | 68.4773 | 1.5269 | 2.0000 |
| XAUUSD | 6.6881 | 481.8090 | 72.0400 | 1.5449 | 2.0000 |
Observation 3.3: making the brick sixteen times larger makes the time per brick 64.8597 to 72.0400 times longer. The count falls from 257,348 to 3,964 (USDJPY).
Observation 3.4: ★ but the log-log slope is 1.5250 (median), short of the predicted 2. The departure is −0.4750. Prediction A failed.
Observation 3.5: the median time per brick at 1 times is 0.0000 minutes. The brick is so small that several are laid within one five-minute bar. That is suspicious. Section 5 checks it.
Observation 3.6: the four slopes run from 1.5074 to 1.5449 — in close agreement. When the failures agree, the cause is the procedure, not the market.
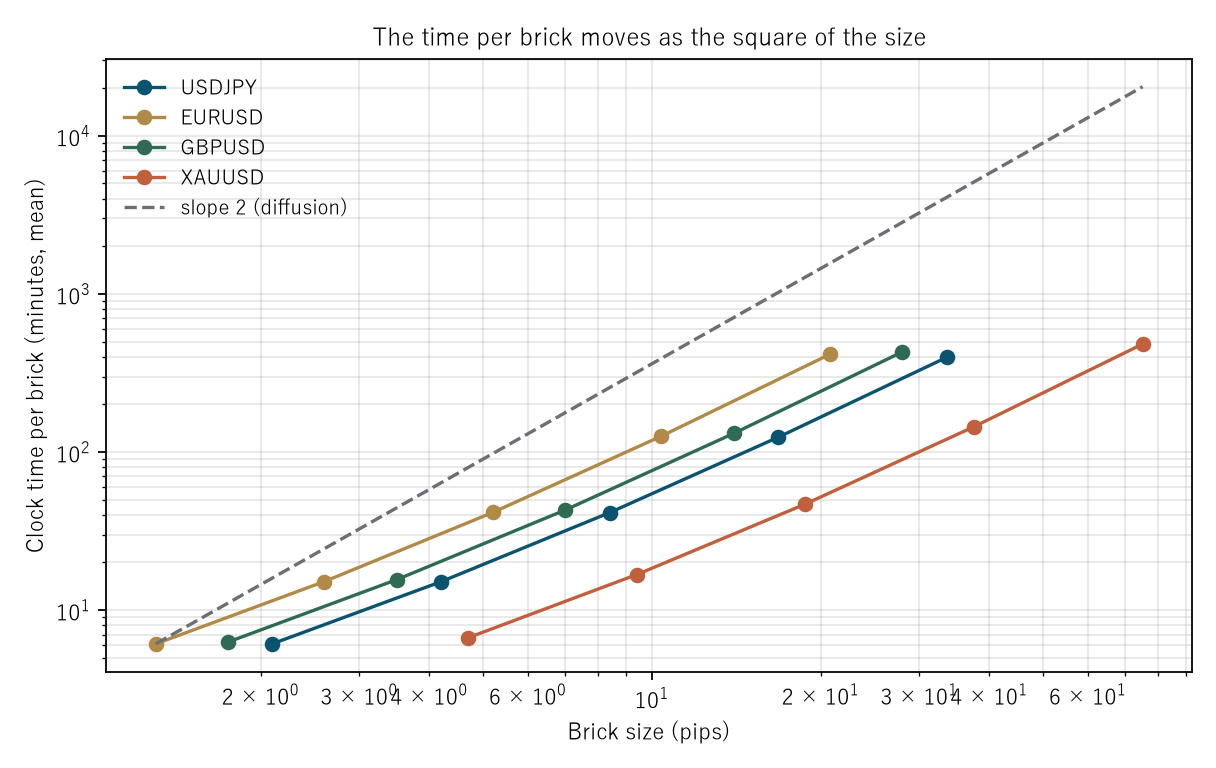
Figure 1: log-log, brick size across, time per brick up. The dashed line is slope 2 (the diffusion prediction); the four lines are flatter.
4. The leg length moved too — Prediction B failed
Calculation 4.1 Leg length (evaluation period)
| Instrument | Multiple | Legs | Median | Mean | Share reversing after one brick |
|---|---|---|---|---|---|
| USDJPY | 1 | 49,242 | 3.0000 | 5.2262 | 20.9862% |
| USDJPY | 2 | 27,866 | 3.0000 | 3.7409 | 28.9959% |
| USDJPY | 4 | 12,520 | 2.0000 | 3.0450 | 34.8003% |
| USDJPY | 8 | 4,716 | 2.0000 | 2.6953 | 39.3130% |
| USDJPY | 16 | 1,527 | 2.0000 | 2.5959 | 40.2750% |
| EURUSD | 1 | 49,456 | 3.0000 | 5.2111 | 20.4303% |
| EURUSD | 16 | 1,633 | 2.0000 | 2.3215 | 43.2333% |
| GBPUSD | 1 | 48,552 | 3.0000 | 5.1683 | 20.5347% |
| GBPUSD | 16 | 1,627 | 2.0000 | 2.2520 | 44.9908% |
| XAUUSD | 1 | 48,241 | 3.0000 | 4.8825 | 21.8922% |
| XAUUSD | 16 | 1,372 | 2.0000 | 2.3819 | 41.6181% |
Calculation 4.2 Medians by size
| Multiple | Median mean leg | Median median leg | Median share reversing after one |
|---|---|---|---|
| 1 | 5.1897 | 3.0000 | 20.7604% |
| 2 | 3.6536 | 3.0000 | 29.1667% |
| 4 | 2.9073 | 2.0000 | 36.1727% |
| 8 | 2.5392 | 2.0000 | 40.3046% |
| 16 | 2.3517 | 2.0000 | 42.4257% |
Observation 4.3: ★ the mean leg falls monotonically from 5.1897 to 2.3517. The ratio of 16 times to 1 times runs from 0.4357 to 0.4967. Prediction B failed.
Observation 4.4: the share reversing after one brick rises from 20.7604% to 42.4257%. For a walk taken at random, that share would approach 50%. The coarser the brick, the closer it gets.
Observation 4.5: legs are long with small bricks because the round trips are invisible. If price goes and comes back inside one five-minute bar, the closes alone lay several bricks in one direction. It looks like a trend continuing, but it is only that nothing else was seen.
Observation 4.6: ★ so "a renko chart shows trends cleanly" gets stronger the finer the brick. And that is made by the coarseness of the source bars.
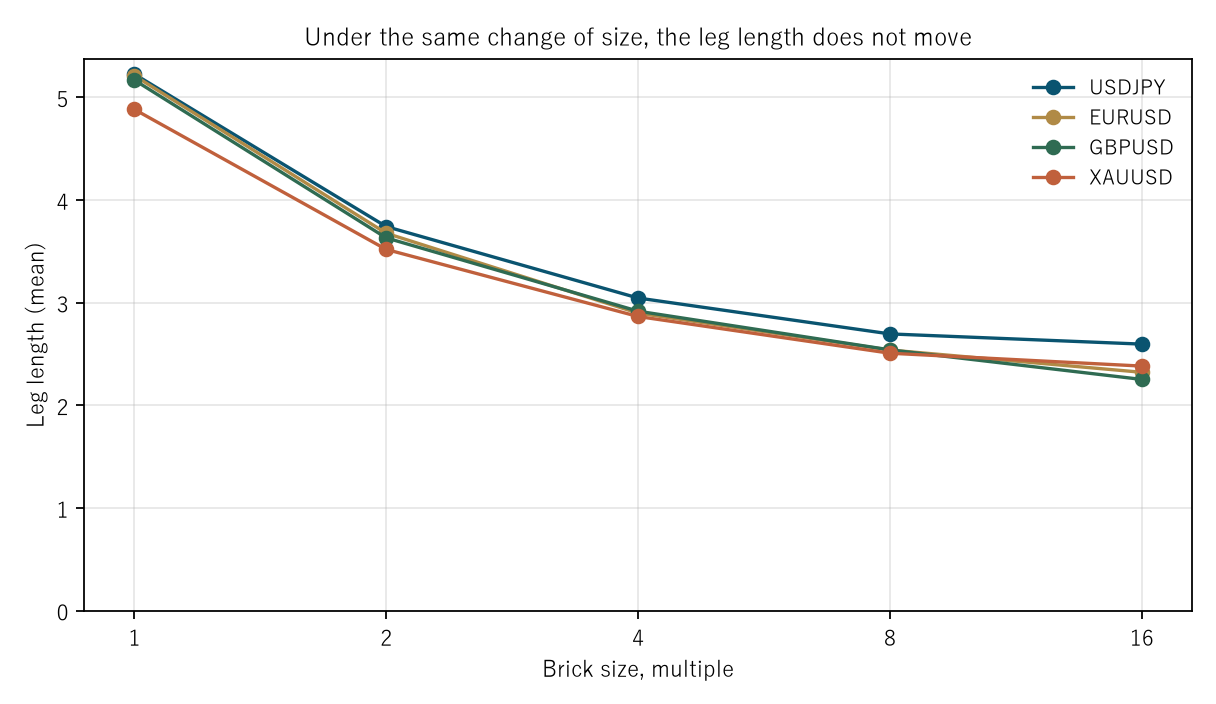
Figure 2: brick-size multiple across, mean leg length up. A flat line was predicted; the line slopes down.
5. The baseline — the cause of the failures is the lattice, not the market
Calculation 5.1 Renko on synthetic series (5 realisations, evaluation period)
| Instrument | Measured slope | Random-walk slope | Measured mean leg | Random-walk mean leg |
|---|---|---|---|---|
| USDJPY | 1.5074 | 1.6016 | 3.0450 | 2.6120 |
| EURUSD | 1.5230 | 1.5762 | 2.8977 | 2.6875 |
| GBPUSD | 1.5269 | 1.5626 | 2.9168 | 2.7360 |
| XAUUSD | 1.5449 | 1.5865 | 2.8649 | 2.6496 |
Observation 5.2: ★ this is the core of the paper. A synthetic random walk is a diffusion by construction and so is the side on which the prediction holds exactly. Yet its slope is 1.5626 to 1.6016, short of 2.
Observation 5.3: the median difference in slope between measurement and random walk is −0.0474. Of the −0.4750 departure from the prediction, only about a tenth can be laid at the market's door.
Observation 5.4: ★ the failure of Prediction A is therefore a product of the lattice. Movement finer than the source bars is invisible, so small bricks appear to be laid too quickly, and the growth of time with size comes out flatter than a square law.
Observation 5.5: the mean leg is 2.8649 to 3.0450 measured against 2.6120 to 2.7360 on the random walk, a median difference of +0.2128. Small next to the failure of Prediction B, which ran from 5.1897 down to 2.3517.
Observation 5.6: ★ both failures point to one and the same cause: the coarseness of the source bars. The coarseness of the instrument appeared in both of the quantities it measured.
Observation 5.7: this paper does not write that as a defect of renko charts. Built from five-minute bars, five-minute coarseness necessarily remains. What should be written is that "how trends continue" as seen on a renko chart depends on the coarseness of the source bars.
6. Is there directional information in the brick's direction?
Calculation 6.1 A signal on the bar that laid the brick (evaluation period, pips)
| Instrument | 1× | 2× | 4× | 8× | 16× |
|---|---|---|---|---|---|
| USDJPY | 0.6585 (t 1.64) | 0.7647 (t 0.76) | 1.1790 (t 0.65) | 1.7997 (t 1.09) | 2.4412 (t 1.96) |
| EURUSD | −0.3464 (t −0.92) | −0.4828 (t −1.21) | −0.5546 (t −0.48) | −0.8529 (t 0.15) | −1.4264 (t −1.17) |
| GBPUSD | −0.3204 (t −0.67) | −0.4659 (t −0.52) | −0.7403 (t −0.65) | −0.7733 (t −0.11) | −0.4669 (t −0.77) |
| XAUUSD | 0.5818 (t 0.18) | 0.4149 (t 0.03) | 0.8262 (t −0.53) | 0.9658 (t −0.79) | 1.6760 (t 0.73) |
Observation 6.2: the median D by size is +0.1307, −0.0255, +0.1358, +0.0963 and +0.6045 pips, against a median spread of 0.8000 pips.
Observation 6.3: the daily t reaches 2 in absolute value in 0 of 20 cells. Chance gives about 0.9, so the measurement is below chance.
Observation 6.4: the sign is fixed by the instrument. USDJPY and XAUUSD are positive at all five sizes, EURUSD and GBPUSD negative at all five. That may be a restatement of which way each instrument moved over the period, not an effect of the size. The drift is not separated here.
Observation 6.5: the absolute D grows with the size (0.6585 to 2.4412 for USDJPY). But the count falls from 257,348 to 3,964 and the t moves only from 1.64 to 1.96. ★ The figure grows because each brick grew.
7. Limitations
- ★ The source bars are fixed at five-minute closes, with the movement inside a bar unused. That coarseness is the cause of both failures (Section 5). Built tick by tick, the slope should approach 2 and the mean leg should stop depending on the size. This paper did not measure that. It is the chief limitation.
- Reversals are not treated specially. A brick is laid whenever price moves one brick away; the convention requiring two — which is common — is not treated.
- Only five sizes are used, from 1 to 16 times. Coarser bricks would show whether the mean leg approaches 2, but the counts would run out.
- ★ The drift is not separated. The signs of D in Section 6 include which way each instrument moved over the period.
- Time per brick counts 0 when several bricks are laid on one bar. Another convention (spreading them within the bar, say) changes the slope. The same convention is used for the measurement and the random walk, so the comparison stands.
- The synthetic baseline uses independent normal increments. Volatility clustering is not included.
- Four instruments over three years. Nothing is said about other markets or other periods.
Conclusion
Making the brick sixteen times larger makes the time per brick 64.8597 times longer and cuts the count from 257,348 to 3,964. What a renko chart changes is the clock. That much was as predicted.
But both predictions written in advance failed. Against the diffusion prediction of a square law, the log-log slope was 1.5250. And "the leg length does not depend on the size" failed too, the mean leg falling from 5.1897 to 2.3517.
Both failures pointed to the same cause. On a synthetic series known by construction to carry zero directional information, the slope is 1.5626 to 1.6016, a median difference of only −0.0474 against the measurement.
Movement finer than the source bars is invisible, so small bricks miss the round trips. That makes legs look long and the growth of time look flat.
★ "A renko chart shows trends cleanly" gets stronger the finer the brick — and that is made by the coarseness of the source bars.
As for directional information in the brick's direction, the daily t reaches 2 in absolute value in 0 of 20 cells, against about 0.9 by chance.
And what this paper could measure is renko built from five-minute bars. What happens when it is built from ticks is not answered here.
Data and reproduction
| Data | Currency ticks from Dukascopy (agreement to the millisecond, bid and ask, verified from 2019 onward). Gold from Dukascopy |
| Period | 2019–2024 (six years). Evaluation 2022–2024 |
| Instruments | USDJPY, EURUSD, GBPUSD, XAUUSD |
| Source bars | Five-minute, mid price, closing value of completed bars only. Bars with no ticks are not created |
| Brick | One brick whenever price moves k from the previous brick's close; reversals not treated specially |
| Sizes | 1, 2, 4, 8 and 16 times the median five-minute move |
| Verification | 検算/F017.py (with --zu it also writes the figures). Every number in the text is taken from 検算/F017_output.txt |
| Figures | 図/F017_zu1, 図/F017_zu2 (png, svg, English versions) |
| Random seeds | Fixed at 0–4. Re-running gives the same values |
| Audit of the foundation | _ツール/audit_bars.py (look-ahead in the bars, daylight saving, the day boundary). The record is _土台の検査.txt |
References
- Yamagishi, Y. (2026). The Period a Moving-Average Crossover Finds Is Made by the Ratio of the Two Periods [F001]. Zenodo. 10.5281/zenodo.22880428
Reference
Yamagishi, Y. (2026). A Renko Chart Is a Different Clock [F017]. Zenodo.
DOI: 10.5281/zenodo.22891823
YOI: https://www.yamagishiyuuki.com/yoi/F017
ORCID: 0009-0006-8587-3450
PDF (English) · PDF (Japanese) · Date proof of the English PDF (OpenTimestamps .ots) · SHA256SUMS
The record page for this paper (in Japanese, with the PDFs in each language and the date proof): YOI F017. This paper is a preprint and has not been peer reviewed.