Abstract
This paper asks what becomes uniform when bars are cut by tick count — the answer is that the size of the move does, and the directional information does not. It claims neither a new mathematical theorem nor a new law.
First, tick bars (one bar per N ticks) were placed beside clock bars matched on the median time per bar. The median differs by 0.0000 minutes. Without that matching, the comparison would only be "the finer bars differ" (Section 3).
Second, the scatter of the move per bar (coefficient of variation) is 0.9966 for tick bars and 1.2359 for clock bars. The median difference is −0.2419, ranging from −0.3026 to −0.1278, and tick bars are smaller in all 20 cells (Section 4).
Third, and this is the core of the paper, taking the median move per bar in each session and dividing the largest by the smallest gives 1.7390 for tick bars and 3.5268 for clock bars. Tick bars are smaller in all 8 cells (Section 5).
Fourth, ★ so the claim that tick bars make the move uniform was true. Rarely for this series, a public claim was supported by the measurement (Sections 4 and 5).
Fifth, but what became uniform is the size of the move, not the directional information. Trading with the bar's direction gives a median of +0.0471 pips for tick bars and +0.1154 pips for clock bars, below the median spread of 0.7500 pips. The daily t reaches 2 in absolute value in 2 of 20 and 0 of 20 cells, against about 0.9 by chance (Section 6).
Sixth, the scatter of the time per bar is 5.0837 for tick bars and 5.4319 for clock bars, neither of them zero. Bars with no ticks are not created, so even a clock bar can span a weekend (Section 4).
Scope of this paper (scope note): No new mathematical theorem and no new law is claimed — the idea of bars cut by events (information-driven bars) is known. No particular product or proponent is discussed — no real course, author, or vendor is the subject here, and none is named. What is treated is the public bar type itself. Trading is not discussed — what is measured is the scatter of the move and directional information, not trading performance including commissions, fills and money management. The scope is intraday and a small number of instruments — four series over three years. Monthly time-series momentum (dozens of markets, holding one to twelve months) is documented in the literature, and this paper does not contradict it. ★ The source bars are fixed at five minutes — tick counts are summed from what five-minute bars carry, so bar boundaries fall on five-minute marks (Section 7). Ticks are counted, not volume — currencies have no volume, so the number of quote updates stands in for the number of trades. The scatter of the time per bar is dominated by weekends — bars with no ticks are not created, which affects both. No forecast is claimed. Relation to earlier papers: this series measures to separate, not to deny. F017 failed two predictions on renko charts — this paper, in the same part, produces a case where a public claim is supported. What is added here is matching the median time per bar before comparing, taking the session-to-session ratio, and putting what became uniform and what did not into the same paper.
1. Notation and the question
It is said that "tick bars make the size of the move uniform" and that "cutting by time wastes bars on quiet hours".
| Bar type | What cuts it | What one bar means |
|---|---|---|
| Clock bars | time | the convention of five minutes or an hour |
| Tick bars | the number of price updates | N trades (quote updates) |
| What this paper asks | what becomes uniform when the cut changes |
Observation 1.1: "tick bars are better" says nothing on its own, because it does not say what becomes uniform.
Observation 1.2: and there is a trap in how they are compared. If tick bars are finer, of course their moves are smaller. A comparison requires matching the median time per bar.
Observation 1.3: with that matched, three things are measured: the scatter of the move, the move by session, and the directional information. If the first two become uniform and the third does not, what tick bars changed is the ruler, not the content.
Question: what becomes uniform when bars are cut by tick count?
2. Writing the quantity and the design in advance
Design (declared before running and unchanged at run time)
| Item | Decision |
|---|---|
| Source bars | five-minute bars (mid price, completed bars only); each carries a tick count |
| Tick bars | one bar once the tick count sums to N or more. N = 500, 1000, 2000, 4000, 8000 |
| Clock bars | five-minute bars grouped a fixed number at a time, matched to the median time per bar of the tick bars at the same N |
| Time per bar | minutes from the end of the previous bar to the end of this one |
| Move | absolute difference from the previous bar's close (pips) |
| Scatter | coefficient of variation (standard deviation ÷ mean) |
| Sessions | five non-overlapping bins in Coordinated Universal Time |
| Directional information | the bar's direction (close above or below the previous close), over the next 288 bars (24 hours) |
| Instruments | USDJPY, EURUSD, GBPUSD, XAUUSD |
| Period | 2019–2024. Evaluation 2022–2024 |
Observation 2.1: ★ the move is measured from the previous bar's close. Measuring from the close of the first bar of the interval means that, when a single five-minute bar alone reaches N, start and end are the same bar and the move comes out zero. That was in fact the first version, and gold's median of 0.0000 revealed it.
Observation 2.2: currencies have no volume. With no exchange, nobody holds the total count of trades. A tick count is the number of quote updates, standing in for the number of trades.
Observation 2.3: because the source bars are five minutes, tick-bar boundaries also fall on five-minute marks. A bar is cut not exactly at N but at the end of the first five-minute bar at which the sum reached N.
The median tick count per five-minute bar is 464.0 for USDJPY, 284.0 for EURUSD, 323.0 for GBPUSD and 550.0 for XAUUSD.
3. Matching the median time per bar
Calculation 3.1 Tick bars and time-matched clock bars (evaluation period)
| Instrument | N | Tick bars | Clock bars | Tick bars, minutes (median) | Clock bars, minutes (median) | Five-minute bars each |
|---|---|---|---|---|---|---|
| USDJPY | 500 | 138,663 | 214,290 | 5.0000 | 5.0000 | 1 |
| USDJPY | 1,000 | 86,174 | 107,145 | 10.0000 | 10.0000 | 2 |
| USDJPY | 2,000 | 49,183 | 53,572 | 20.0000 | 20.0000 | 4 |
| USDJPY | 4,000 | 26,741 | 30,612 | 35.0000 | 35.0000 | 7 |
| USDJPY | 8,000 | 14,011 | 16,483 | 65.0000 | 65.0000 | 13 |
| EURUSD | 500 | 105,345 | 107,302 | 10.0000 | 10.0000 | 2 |
| EURUSD | 8,000 | 9,757 | 11,922 | 90.0000 | 90.0000 | 18 |
| GBPUSD | 500 | 113,374 | 107,184 | 10.0000 | 10.0000 | 2 |
| GBPUSD | 8,000 | 10,845 | 13,398 | 80.0000 | 80.0000 | 16 |
| XAUUSD | 500 | 149,188 | 209,798 | 5.0000 | 5.0000 | 1 |
| XAUUSD | 8,000 | 16,934 | 20,979 | 50.0000 | 50.0000 | 10 |
Observation 3.2: the median time per bar differs by 0.0000 minutes in all 20 cells. The ground for comparison is level.
Observation 3.3: the counts do not match. At N = 500 for USDJPY there are 138,663 tick bars against 214,290 clock bars. The medians agree while the shapes of the distributions differ.
Observation 3.4: the same N means a different length of time in each instrument. N = 8,000 is 65.0000 minutes for USDJPY and 90.0000 for EURUSD. Ticks arrive differently.
4. What became uniform — the scatter of the move
Calculation 4.1 Scatter of the time and of the move per bar (evaluation period)
| Instrument | N | Time CV, tick | Time CV, clock | Median move, tick | Median move, clock | Move CV, tick | Move CV, clock |
|---|---|---|---|---|---|---|---|
| USDJPY | 500 | 8.7448 | 10.7195 | 3.2000 | 2.1000 | 1.2191 | 1.3872 |
| USDJPY | 1,000 | 6.9175 | 7.5767 | 4.3500 | 3.0500 | 1.1442 | 1.3642 |
| USDJPY | 2,000 | 5.2599 | 5.3528 | 5.8500 | 4.3500 | 1.1054 | 1.3384 |
| USDJPY | 4,000 | 3.9200 | 4.0410 | 8.0500 | 5.7000 | 1.0584 | 1.3276 |
| USDJPY | 8,000 | 2.8822 | 2.9591 | 11.3500 | 8.0500 | 1.0481 | 1.3507 |
| EURUSD | 4,000 | 3.3054 | 3.5591 | 6.2500 | 3.9500 | 0.9325 | 1.2150 |
| EURUSD | 8,000 | 2.4352 | 2.5111 | 8.8000 | 5.6500 | 0.8981 | 1.1943 |
| GBPUSD | 4,000 | 3.4777 | 3.7808 | 7.7500 | 4.9500 | 0.9580 | 1.2181 |
| GBPUSD | 8,000 | 2.5610 | 2.6678 | 10.9000 | 6.9500 | 0.9081 | 1.2079 |
| XAUUSD | 4,000 | 4.9075 | 5.5076 | 15.5850 | 10.4100 | 0.9501 | 1.1933 |
| XAUUSD | 8,000 | 3.6115 | 3.8874 | 21.7000 | 14.7850 | 0.9472 | 1.1879 |
Calculation 4.2 Summary (medians over 20 cells)
| Quantity | Tick bars | Clock bars | Difference |
|---|---|---|---|
| CV of the time per bar | 5.0837 | 5.4319 | — |
| CV of the move | 0.9966 | 1.2359 | −0.2419 |
Observation 4.3: ★ the scatter of the move is 0.9966 for tick bars and 1.2359 for clock bars. The median difference is −0.2419, ranging from −0.3026 to −0.1278, and tick bars are smaller in all 20 cells.
Observation 4.4: ★ so the claim that tick bars make the move uniform was true. This series has run to denials so far; this is a case that was supported.
Observation 4.5: the scatter of the time per bar is 5.0837 and 5.4319, neither of them zero. For clock bars it should be zero by definition, but bars with no ticks are not created, so a bar can span a weekend. This quantity is set almost entirely by weekends and cannot be used to compare the cuts.
Observation 4.6: the median move is larger for tick bars (11.3500 against 8.0500 pips at N = 8,000 for USDJPY). With the median time matched, tick bars still allot a bar to the hours when price is moving, so each bar's move is larger.
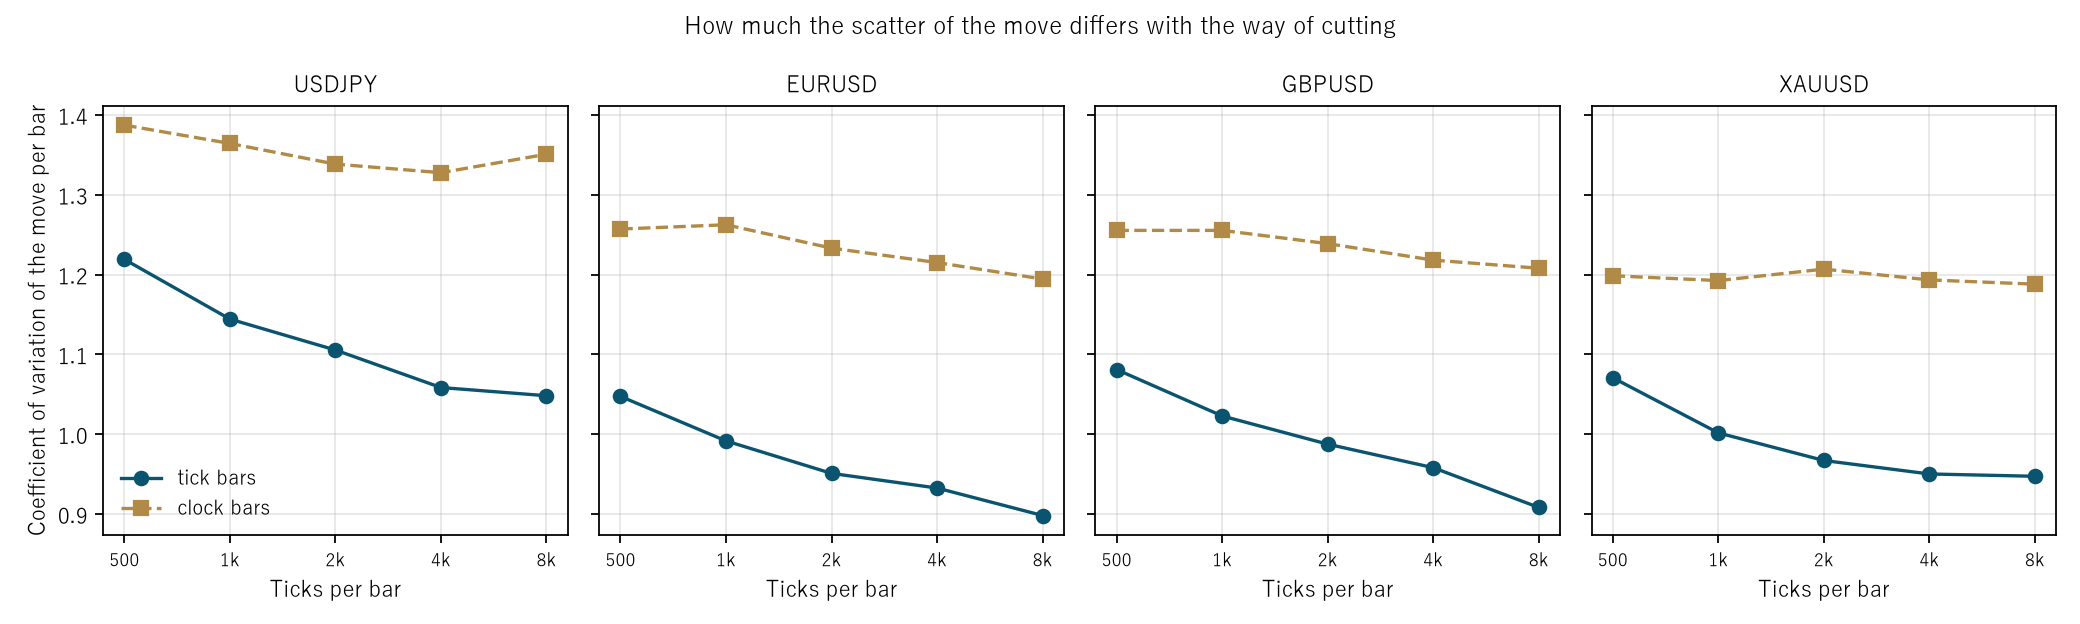
Figure 1: ticks per bar across, coefficient of variation of the move up, one panel per instrument. The dark line (tick bars) sits below the light one (clock bars).
5. The move by session — this is the core
Calculation 5.1 Median move per bar by session (evaluation period, pips)
| Instrument | N | Cut | Tokyo 0–7 | London 7–12 | Overlap 12–16 | NY late 16–21 | Night 21–24 | Largest ÷ smallest |
|---|---|---|---|---|---|---|---|---|
| USDJPY | 1,000 | tick | 4.4500 | 4.3000 | 4.9000 | 3.7500 | 3.7500 | 1.3067 |
| USDJPY | 1,000 | clock | 3.1500 | 3.4500 | 4.5500 | 2.4000 | 1.9000 | 2.3947 |
| USDJPY | 4,000 | tick | 8.3000 | 7.8000 | 9.1500 | 7.1500 | 7.0000 | 1.3071 |
| USDJPY | 4,000 | clock | 5.9000 | 6.4000 | 8.5500 | 4.6000 | 3.6500 | 2.3425 |
| EURUSD | 1,000 | tick | 2.7000 | 3.6500 | 4.1000 | 3.1500 | 2.0000 | 2.0500 |
| EURUSD | 1,000 | clock | 1.7500 | 3.3000 | 4.2500 | 2.3500 | 1.0500 | 4.0476 |
| EURUSD | 4,000 | tick | 5.0500 | 6.7000 | 7.6500 | 6.1500 | 3.7000 | 2.0676 |
| EURUSD | 4,000 | clock | 3.0000 | 5.6500 | 7.6500 | 4.2000 | 1.8000 | 4.2500 |
| GBPUSD | 1,000 | tick | 3.1500 | 4.8000 | 5.1500 | 3.9500 | 2.2500 | 2.2889 |
| GBPUSD | 1,000 | clock | 1.9000 | 3.6500 | 4.4500 | 2.4000 | 1.2000 | 3.7083 |
| GBPUSD | 4,000 | tick | 5.8500 | 8.9000 | 9.6000 | 7.8500 | 4.8000 | 2.0000 |
| GBPUSD | 4,000 | clock | 3.7500 | 7.4500 | 9.0500 | 5.3000 | 2.2500 | 4.0222 |
| XAUUSD | 1,000 | tick | 7.6050 | 8.1500 | 10.6500 | 7.8650 | 7.5950 | 1.4022 |
| XAUUSD | 1,000 | clock | 5.6500 | 7.2500 | 12.2100 | 6.3950 | 3.6500 | 3.3452 |
| XAUUSD | 4,000 | tick | 14.2500 | 14.3500 | 18.9250 | 14.5150 | 12.8050 | 1.4779 |
| XAUUSD | 4,000 | clock | 8.8500 | 11.3250 | 18.8350 | 10.1875 | 5.8000 | 3.2474 |
Observation 5.2: ★ the largest divided by the smallest is 1.7390 for tick bars and 3.5268 for clock bars (medians). The median difference is −1.8562, and tick bars are smaller in all 8 cells.
Observation 5.3: ★ this is the core of the paper. With clock bars, a night bar moves 1.0500 pips and an overlap bar 4.2500 pips — four times (EURUSD at N = 1,000). Called by the same name, their contents differ fourfold by session.
Observation 5.4: with tick bars that gap narrows to 2.0500 times. It does not vanish. In the hours with many quote updates, each update also moves further.
Observation 5.5: for USDJPY and XAUUSD the ratio falls to 1.3067 and 1.4779. The more ticks an instrument has, the better it levels out.
Observation 5.6: under either cut, the overlap session (12–16) is the largest. ★ Tick bars narrow the difference between sessions; they do not remove it.
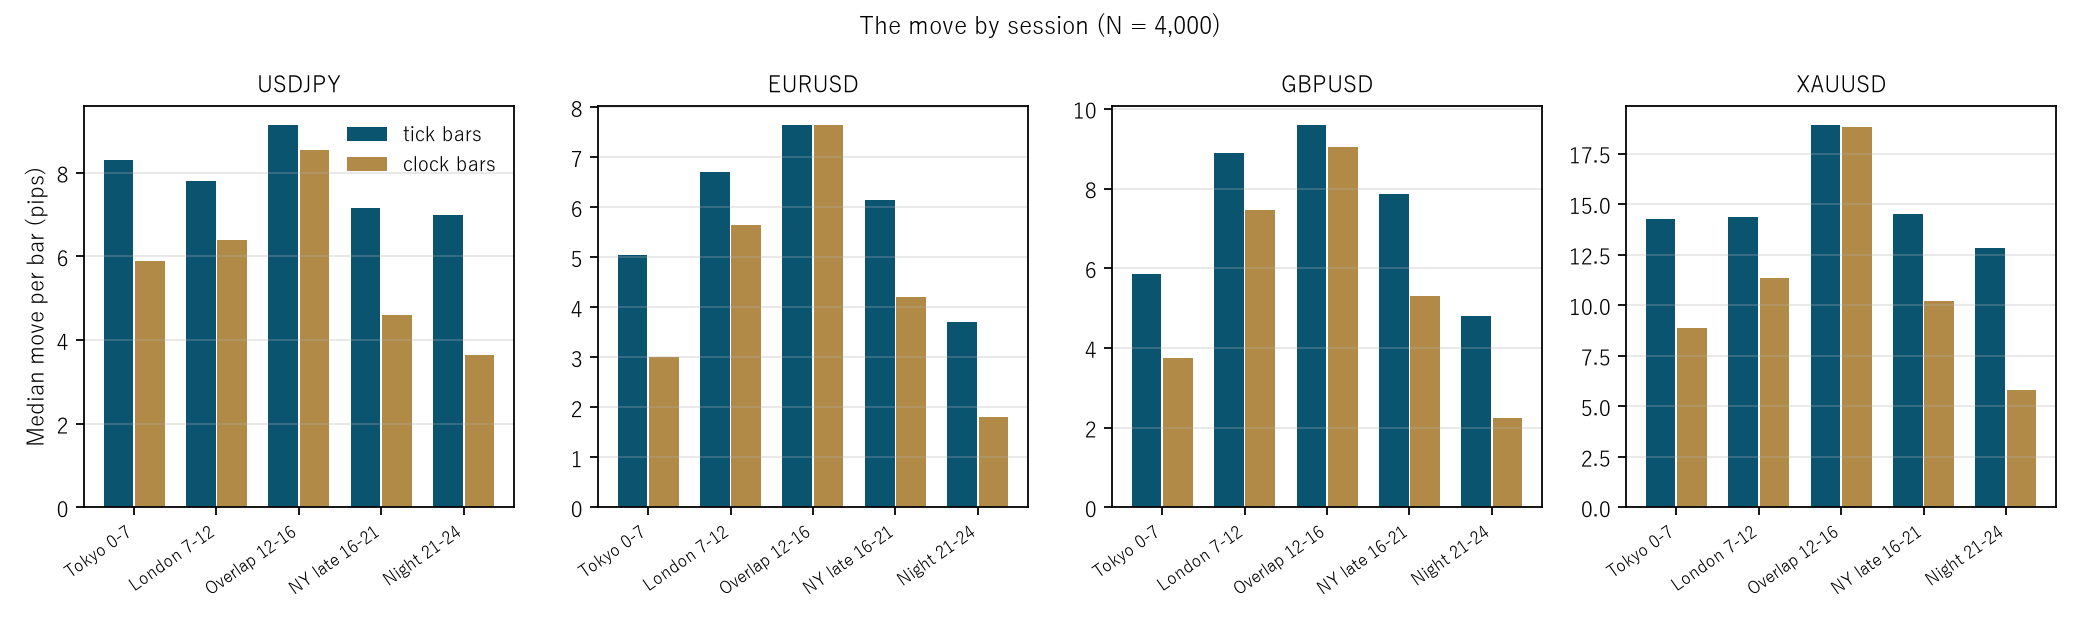
Figure 2: median move per bar in each of the five bins, one panel per instrument. The dark bars (tick) stand at more even heights than the light ones (clock).
6. Does the directional information change with the cut?
Calculation 6.1 Trading with the bar's direction, 24 hours ahead (evaluation period, pips)
| Instrument | N | Tick bars D | Daily t | Clock bars D | Daily t |
|---|---|---|---|---|---|
| USDJPY | 500 | 0.4153 | 1.33 | 0.4023 | 1.00 |
| USDJPY | 2,000 | 0.8525 | 2.01 | 0.9004 | 1.75 |
| USDJPY | 8,000 | 1.4057 | 0.38 | 1.3848 | 1.20 |
| EURUSD | 500 | −0.2040 | 0.90 | −0.4185 | −1.51 |
| EURUSD | 2,000 | −0.3704 | −0.25 | −0.4956 | −0.21 |
| EURUSD | 8,000 | −0.8374 | 0.26 | −0.2679 | 0.21 |
| GBPUSD | 500 | −0.2971 | 0.14 | −0.3136 | −1.07 |
| GBPUSD | 4,000 | 0.1975 | 2.24 | −0.4287 | 0.42 |
| GBPUSD | 8,000 | −0.9309 | 0.67 | −0.2339 | 0.60 |
| XAUUSD | 500 | 1.0208 | 1.23 | 0.7888 | 0.41 |
| XAUUSD | 4,000 | −0.1033 | −1.09 | 0.6677 | −0.32 |
| XAUUSD | 8,000 | 0.2794 | −0.71 | 1.0122 | 0.88 |
Observation 6.2: the median D is +0.0471 pips for tick bars and +0.1154 pips for clock bars, against a median spread of 0.7500 pips. Neither reaches it.
Observation 6.3: the daily t reaches 2 in absolute value in 2 of 20 tick cells and 0 of 20 clock cells. Chance gives about 0.9, so neither differs from chance.
Observation 6.4: ★ so what became uniform is the size of the move, not the directional information. What Sections 4 and 5 supported was a claim about a quantity symmetric up and down (a size).
Observation 6.5: the sign is fixed by the instrument. USDJPY is positive at all five N, EURUSD negative at all five. That may be a restatement of which way each moved over the period rather than an effect of the cut. The drift is not separated here.
7. Limitations
- ★ The source bars are fixed at five minutes. Tick counts are summed from what five-minute bars carry, so tick-bar boundaries also fall on five-minute marks. These are not true tick bars cut exactly at the Nth tick. The smaller the N, the more that coarseness matters.
- ★ Currencies have no volume. A tick count is the number of quote updates, not of trades. Whether this is the same as what is called a "volume bar" is not judged here.
- The scatter of the time per bar is dominated by weekends. Bars with no ticks are not created, so even a clock bar can span one. That quantity cannot be used to compare the cuts.
- ★ The drift is not separated. The signs of D in Section 6 include which way each instrument moved over the period.
- The session comparison is limited to N = 1,000 and 4,000. All five would make the table too large. The coefficients of variation in Section 4 were measured at all five and pointed the same way in all 20 cells.
- The move is measured as the absolute difference of closes. Measured as a high-low range it would differ. The same measure is used for both cuts, so the comparison stands.
- Four instruments over three years. Nothing is said about other markets or other periods.
Conclusion
Tick bars were placed beside clock bars matched on the median time per bar.
The scatter of the move was 0.9966 for tick bars and 1.2359 for clock bars, smaller for tick bars in all 20 cells. The session-to-session ratio of largest to smallest was 1.7390 against 3.5268, smaller for tick bars in all 8 cells.
★ The claim that tick bars make the move uniform was true. This series has run to denials so far; this one was supported.
But what became uniform is the size of the move, not the directional information. Trading with the bar's direction gives medians of +0.0471 and +0.1154 pips, short of the median spread of 0.7500 pips, and the daily t reaches 2 in absolute value in 2 of 20 and 0 of 20 cells (chance gives 0.9).
What tick bars changed is the ruler. Levelling the ruler and becoming able to call the direction are two different things.
And what this paper could measure is tick bars assembled from five-minute bars. About true tick bars cut exactly at the Nth tick, nothing is answered here.
Data and reproduction
| Data | Currency ticks from Dukascopy (agreement to the millisecond, bid and ask, verified from 2019 onward). Gold from Dukascopy |
| Period | 2019–2024 (six years). Evaluation 2022–2024 |
| Instruments | USDJPY, EURUSD, GBPUSD, XAUUSD |
| Source bars | Five-minute, mid price, closing value of completed bars only; each carries a tick count. Bars with no ticks are not created |
| Tick bars | One bar at the end of the first five-minute bar at which the tick count sums to N or more |
| Clock bars | Five-minute bars grouped a fixed number at a time, matched to the median time per bar of the tick bars at the same N |
| Verification | 検算/F018.py (with --zu it also writes the figures). Every number in the text is taken from 検算/F018_output.txt |
| Figures | 図/F018_zu1, 図/F018_zu2 (png, svg, English versions) |
| Audit of the foundation | _ツール/audit_bars.py (look-ahead in the bars, daylight saving, the day boundary). The record is _土台の検査.txt |
References
- Yamagishi, Y. (2026). A Renko Chart Is a Different Clock [F017]. Zenodo. 10.5281/zenodo.22891823
Reference
Yamagishi, Y. (2026). Bars Cut by Tick Count Are a Different Clock from Bars Cut by the Clock [F018]. Zenodo.
DOI: 10.5281/zenodo.22891916
YOI: https://www.yamagishiyuuki.com/yoi/F018
ORCID: 0009-0006-8587-3450
PDF (English) · PDF (Japanese) · Date proof of the English PDF (OpenTimestamps .ots) · SHA256SUMS
The record page for this paper (in Japanese, with the PDFs in each language and the date proof): YOI F018. This paper is a preprint and has not been peer reviewed.