Abstract
This paper asks whether chart patterns appear because of the market — the answer is that they appear because of the zigzag. It claims neither a new mathematical theorem nor a new law.
First, a zigzag was drawn on one-hour bars (a reversal is confirmed when price retraces 1.00 ATR from the latest extreme) and three patterns were counted. The medians per thousand bars are 37.2886 for the double top, 4.0011 for the triple top and 11.1283 for head and shoulders (Section 3).
Second, and this is the core of the paper, doing the same on synthetic series built from independent normal increments down to the movement inside each bar gives 46.2858 double tops per thousand bars. More than the measurement (Section 4).
Third, the measured-to-random ratio has a median of 0.8042, ranging from 0.5963 to 0.8783, and is below one in all twelve cells (three patterns times four series). The patterns appear more often on a random walk (Section 4).
Fourth, the directional information over 24 bars from the completing bar (the close beyond the neckline) is +2.8352 pips for the double top, +10.6255 pips for the triple top and +3.7470 pips for head and shoulders. But 0 of 12 cells reach a daily t of 2 in absolute value (chance gives about 0.5) (Section 5).
Fifth, the difference between the pattern's move and the move over all bars in the same period has a median of +3.6078 pips, ranging from −13.2119 to +16.7383 pips. The scatter is larger than the difference (Section 6).
Sixth, splitting into five non-overlapping sessions, the daily t reaches 2 in absolute value in 0 of 17 cells, against about 0.8 by chance (Section 7).
Scope of this paper (scope note): No new mathematical theorem and no new law is claimed — how a zigzag is drawn, the true range and random walks are all known. No particular product or proponent is discussed — no real course, author, or vendor is the subject here, and none is named. What is treated is the public patterns themselves. Trading is not discussed — what is measured is occurrence rates and directional information, not trading performance including commissions, fills and money management. The scope is intraday and a small number of instruments — four series, three years, one-hour bars. Monthly time-series momentum (dozens of markets, holding one to twelve months) is documented in the literature, and this paper does not contradict it. ★ Finding the patterns is mechanised one way — a 1.00 ATR retracement for the zigzag and 0.25 ATR for "the same height". That is not the pattern a person finds by eye. This is the chief limitation (Section 8). Three patterns only — triangles, flags and cup-with-handle are not treated. The overlap is not removed — the horizon is 24 bars (with about one observation a day, the overlap is limited). No forecast is claimed. Relation to earlier papers: this series always reports, alongside a rate, what it would be by chance. F011 placed fake levels and F015 placed fake definitions — this paper places a fake series (a synthetic random walk). What is added here is comparing the occurrence rate itself against a random walk, writing the pattern-finding procedure so that it carries no look-ahead, and placing the pattern's move beside the move over all bars.
1. Notation and the question
There is a way of speaking that says "a double top means the ceiling" and "head and shoulders is the reversal pattern".
| Pattern | Shape | What is said about it |
|---|---|---|
| Double top | two peaks of the same height | a ceiling; sell on the break of the neckline |
| Triple top | three peaks of the same height | a stronger ceiling |
| Head and shoulders | three peaks with the middle highest | the classic reversal |
Observation 1.1: "price fell sixty percent of the time after the pattern" says nothing on its own, because it does not say what share fell when the pattern was absent.
Observation 1.2: and there is something to ask first. Does that pattern appear because of the market at all? Draw a zigzag and peaks and troughs necessarily line up. Two peaks of the same height in a row happen without anything making them happen.
Observation 1.3: the question settles by placing a fake series alongside. Count the same patterns, by the same procedure, on a synthetic series known by construction to carry zero directional information. If they appear as often, the patterns are a property of the zigzag, not of the market.
Question: do chart patterns appear because of the market?
2. Writing the quantity and the design in advance
Design (declared before running and unchanged at run time)
| Item | Decision |
|---|---|
| Lattice | one-hour bars, mid price, completed bars only |
| Zigzag | a reversal is confirmed when price retraces 1.00 ATR from the latest extreme |
| Double top | the two consecutive peaks differ by at most 0.25 ATR |
| Triple top | three consecutive peaks all within 0.25 ATR |
| Head and shoulders | the middle of three peaks is highest and the outer two differ by at most 0.25 ATR |
| Neckline | the opposite extreme immediately before the last peak |
| Completion | the bar whose close crosses the neckline; the signal sits there |
| Directional information | the move over the next 24 bars in the direction the pattern predicts (pips) |
| Baseline | synthetic series random down to the movement inside each bar (10 realisations) |
| Instruments | USDJPY, EURUSD, GBPUSD, XAUUSD |
| Period | 2019–2024. Evaluation 2022–2024 |
Observation 2.1: ★ a reversal is confirmed on the bar that retraces, not on the extreme itself. At the extreme it is not yet known to be an extreme. Treating the extreme's bar as the confirmation would be a look-ahead. The neckline crossing is searched for only after the bar on which the last peak was confirmed.
Observation 2.2: the trough side (double bottoms and so on) is counted by the same procedure and combined with signs reversed. Counting only peaks would be dragged by which way the period happened to go.
Observation 2.3: the synthetic series has zero directional information by construction. That is what makes "do the patterns appear anyway" answerable.
In the evaluation period the bar counts are 17,865 for USDJPY, 17,891 for EURUSD, 17,874 for GBPUSD and 17,495 for XAUUSD, with 11,104, 10,467, 10,417 and 10,252 zigzag turning points.
3. How often the patterns appear
Calculation 3.1 Occurrences (evaluation period)
| Instrument | Pattern | Count | Per 1,000 bars |
|---|---|---|---|
| USDJPY | double top | 637 | 35.6563 |
| USDJPY | triple top | 65 | 3.6384 |
| USDJPY | head and shoulders | 203 | 11.3630 |
| EURUSD | double top | 675 | 37.7285 |
| EURUSD | triple top | 96 | 5.3658 |
| EURUSD | head and shoulders | 195 | 10.8993 |
| GBPUSD | double top | 673 | 37.6525 |
| GBPUSD | triple top | 78 | 4.3639 |
| GBPUSD | head and shoulders | 203 | 11.3573 |
| XAUUSD | double top | 646 | 36.9248 |
| XAUUSD | triple top | 63 | 3.6010 |
| XAUUSD | head and shoulders | 184 | 10.5173 |
Observation 3.2: the medians per thousand bars are 37.2886 for the double top, 4.0011 for the triple top and 11.1283 for head and shoulders.
Observation 3.3: the four series agree well. The double top falls between 35.6563 and 37.7285. Different markets and different volatilities, and the same frequency.
Observation 3.4: ★ that agreement is itself a clue. If patterns came from the market's circumstances (sellers making a ceiling, buyers picking a bottom), the frequency could differ from market to market.
4. The baseline — how often the patterns appear on a random walk
Calculation 4.1 Synthetic series whose within-bar movement is also random (10 realisations, evaluation period, per 1,000 bars)
| Instrument | Pattern | Measured | Random walk | Ratio |
|---|---|---|---|---|
| USDJPY | double top | 35.6563 | 46.2804 | 0.7704 |
| USDJPY | triple top | 3.6384 | 6.1013 | 0.5963 |
| USDJPY | head and shoulders | 11.3630 | 13.4845 | 0.8427 |
| EURUSD | double top | 37.7285 | 46.2858 | 0.8151 |
| EURUSD | triple top | 5.3658 | 6.1092 | 0.8783 |
| EURUSD | head and shoulders | 10.8993 | 13.4816 | 0.8085 |
| GBPUSD | double top | 37.6525 | 46.2907 | 0.8134 |
| GBPUSD | triple top | 4.3639 | 6.0982 | 0.7156 |
| GBPUSD | head and shoulders | 11.3573 | 13.4833 | 0.8423 |
| XAUUSD | double top | 36.9248 | 46.1560 | 0.8000 |
| XAUUSD | triple top | 3.6010 | 6.0131 | 0.5989 |
| XAUUSD | head and shoulders | 10.5173 | 13.3181 | 0.7897 |
Observation 4.2: ★ a synthetic random walk has no ceiling, no floor, no sellers, no buyers and no psychology. Double tops appear anyway, 46.1560 to 46.2907 times per thousand bars.
Observation 4.3: the measured-to-random ratio has a median of 0.8042, ranging from 0.5963 to 0.8783. It is below one in all twelve cells. The patterns appear more often on a random walk.
Observation 4.4: the random-walk values are almost identical across the four series (46.1560 to 46.2907 for the double top). They are built the same way, so that is to be expected. ★ And the measurement also agreed well, from 35.6563 to 37.7285. The frequency of the patterns is set by the procedure, not by the market.
Observation 4.5: that the measurement is lower is not read here as "markets produce fewer patterns". The synthetic series uses independent normal increments and its volatility changes more simply than a real market's. That difference may act on how the zigzag is drawn, and this paper does not separate it.
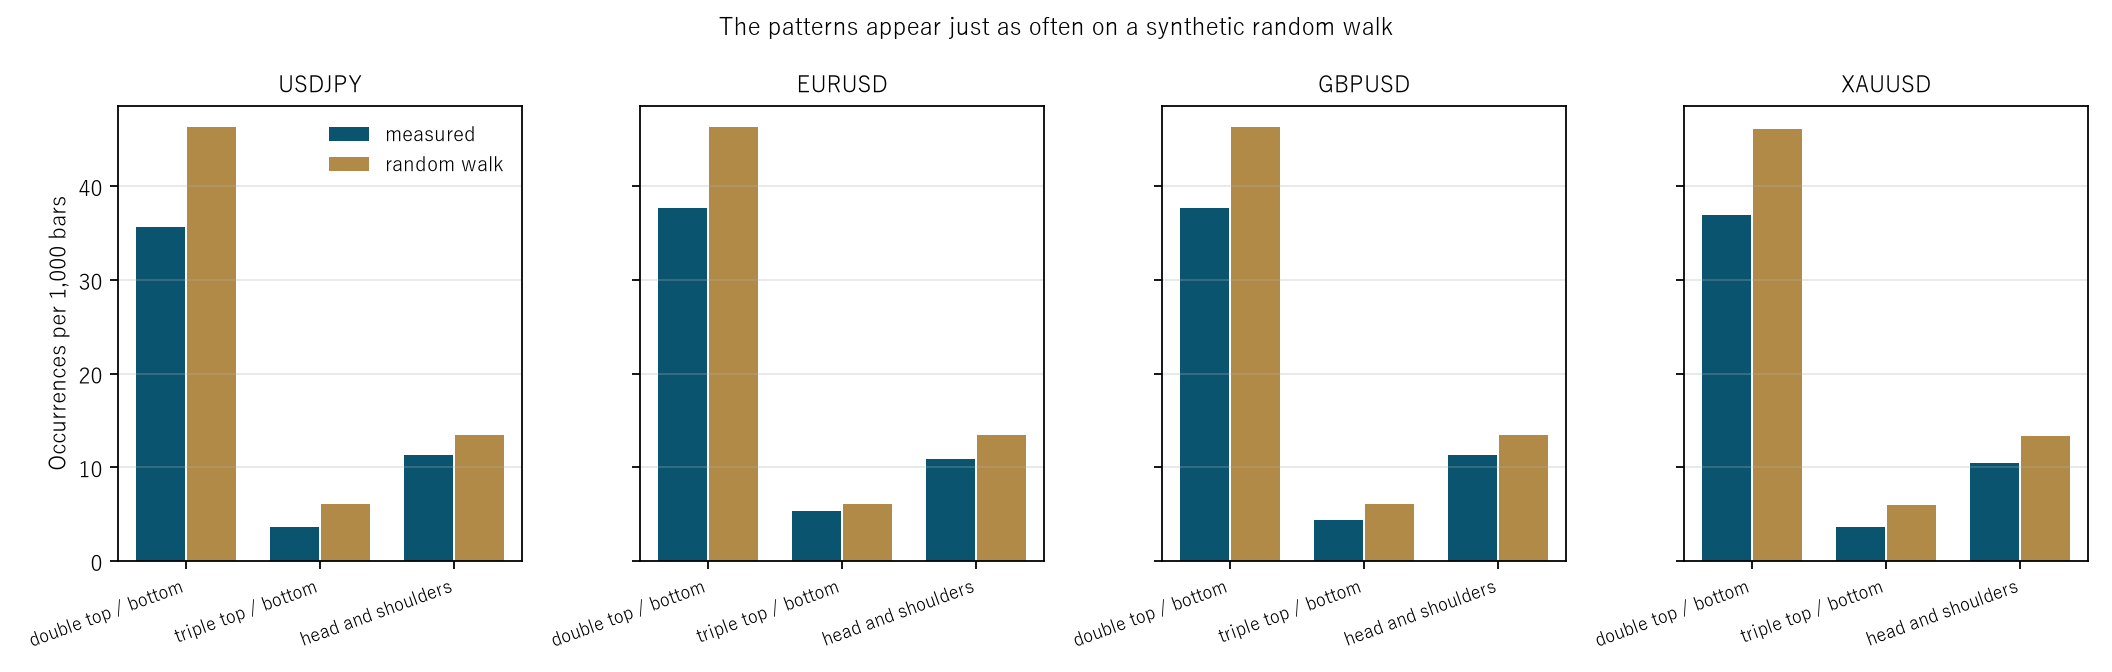
Figure 1: occurrences per thousand bars for the three patterns, one panel per instrument. The dark bars (measured) and the light ones (random walk) stand at similar heights.
5. The move after a pattern completes
Calculation 5.1 A signal on the bar that crosses the neckline (evaluation period)
| Pattern | Instrument | Count | D (pips) | Dd (daily mean) | Daily t | Days | Spread |
|---|---|---|---|---|---|---|---|
| Double top | USDJPY | 637 | 4.1593 | 4.0934 | 0.95 | 465 | 0.60 |
| Double top | EURUSD | 675 | 2.4576 | 3.1719 | 1.50 | 479 | 0.30 |
| Double top | GBPUSD | 670 | 3.2128 | 4.3185 | 1.49 | 485 | 0.90 |
| Double top | XAUUSD | 645 | 1.2112 | 5.9935 | 0.77 | 454 | 3.44 |
| Triple top | USDJPY | 65 | −13.8138 | −12.9463 | −1.03 | 61 | 0.60 |
| Triple top | EURUSD | 96 | 6.0266 | 7.9015 | 1.63 | 85 | 0.30 |
| Triple top | GBPUSD | 78 | 16.9365 | 13.9086 | 1.89 | 71 | 0.90 |
| Triple top | XAUUSD | 63 | 15.2244 | 8.0038 | 0.38 | 58 | 3.41 |
| Head and shoulders | USDJPY | 203 | 6.8601 | 9.5475 | 1.18 | 178 | 0.60 |
| Head and shoulders | EURUSD | 195 | 2.2064 | 2.2950 | 0.66 | 176 | 0.30 |
| Head and shoulders | GBPUSD | 203 | 5.2877 | 6.8219 | 1.53 | 184 | 0.90 |
| Head and shoulders | XAUUSD | 184 | −3.9471 | 1.0177 | 0.07 | 168 | 3.47 |
Observation 5.2: the median D is +2.8352 for the double top, +10.6255 for the triple top and +3.7470 pips for head and shoulders, against a median spread of 0.7500 pips. The signs are as the patterns predict (positive).
Observation 5.3: ★ but the daily t reaches 2 in absolute value in 0 of 12 cells. Chance gives about 0.5, so the measurement is below chance.
Observation 5.4: the triple top has the largest D (+10.6255 pips) and the fewest observations, 63 to 96. Its daily t runs from −1.03 to +1.89. The size is large because the count is small.
Observation 5.5: only USDJPY's triple top is strongly negative (−13.8138 pips), a value inside 65 observations. The other three series are positive, so the signs do not agree either.
Observation 5.6: with about 1.0 observation a day, looking 24 bars ahead leaves limited overlap across days. It is not zero.
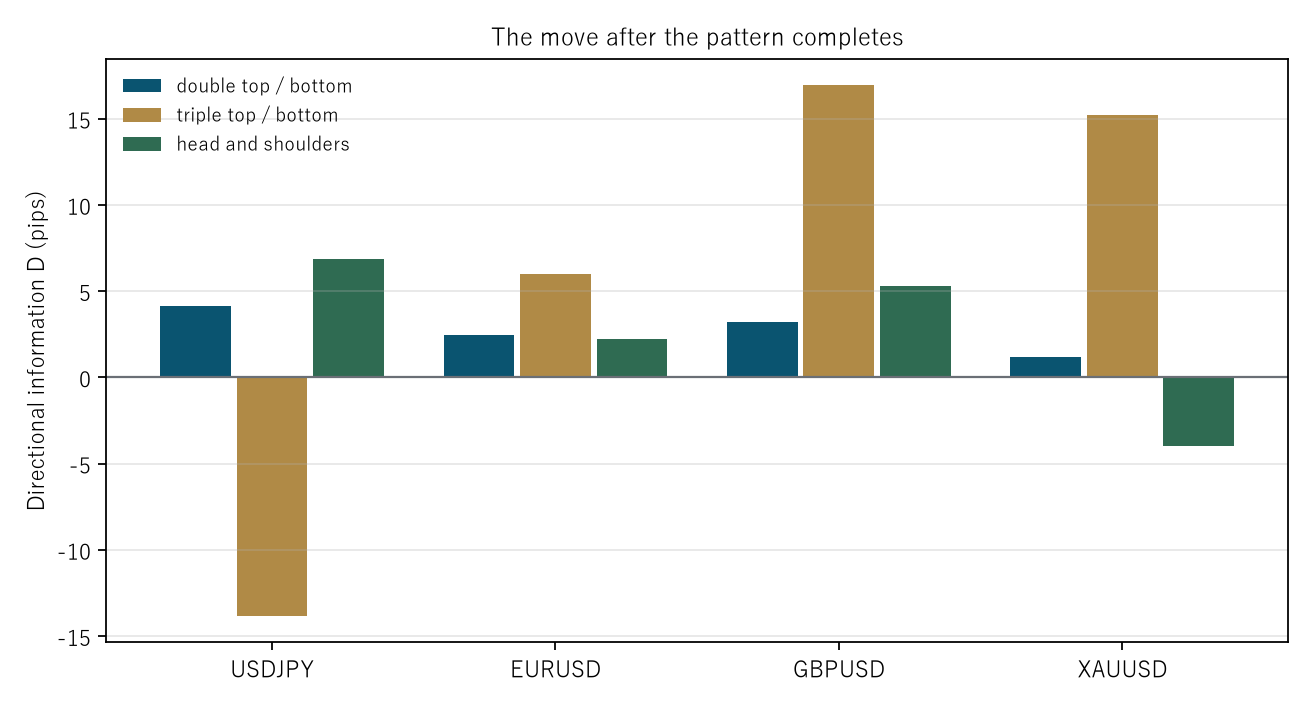
Figure 2: directional information for the three patterns, by instrument. The signs do not agree and the heights are not stable.
6. Comparison with bars where no pattern appeared
Design: over all bars in the same period, form a mean reflecting only the same buy-sell imbalance as the pattern, and take that as the baseline.
Calculation 6.1 The pattern's move against the move over all bars (evaluation period, pips)
| Instrument | Pattern | Pattern's D | All bars, same imbalance | Difference |
|---|---|---|---|---|
| USDJPY | double top | 4.1593 | 0.1141 | +4.0452 |
| USDJPY | triple top | −13.8138 | −0.6020 | −13.2119 |
| USDJPY | head and shoulders | 6.8601 | 0.4130 | +6.4470 |
| EURUSD | double top | 2.4576 | −0.0357 | +2.4932 |
| EURUSD | triple top | 6.0266 | 0.0264 | +6.0002 |
| EURUSD | head and shoulders | 2.2064 | 0.1234 | +2.0830 |
| GBPUSD | double top | 3.2128 | 0.0423 | +3.1704 |
| GBPUSD | triple top | 16.9365 | 0.1983 | +16.7383 |
| GBPUSD | head and shoulders | 5.2877 | 0.1079 | +5.1798 |
| XAUUSD | double top | 1.2112 | −0.3570 | +1.5681 |
| XAUUSD | triple top | 15.2244 | 0.1740 | +15.0504 |
| XAUUSD | head and shoulders | −3.9471 | 0.5959 | −4.5430 |
Observation 6.2: the median difference is +3.6078 pips, with a median absolute value of 4.8614 pips and a range from −13.2119 to +16.7383 pips.
Observation 6.3: ten of the twelve differences are positive. That reads as "price moves more after a pattern than without one".
Observation 6.4: ★ but the scatter is larger than the difference. Against a median of +3.6078 the range spans 30 pips. And as Section 5 showed, by daily t it is 0 of 12.
Observation 6.5: this baseline carries no error band. The all-bar mean has many observations and little error, but the pattern side has 63 to 675. The significance of the difference should be read from the t in Section 5.
7. Splitting by session
Design: five non-overlapping bins in Coordinated Universal Time. The signal is the double top.
Calculation 7.1 Directional information in each of the five bins (evaluation period)
| Instrument | Tokyo 0–7 | London 7–12 | Overlap 12–16 | NY late 16–21 | Night 21–24 |
|---|---|---|---|---|---|
| USDJPY | 0.68 (t 0.42) | 8.44 (t 0.79) | 7.63 (t 0.97) | −0.37 (t −0.27) | −3.40 (t −0.26) |
| EURUSD | 1.55 (t 0.37) | 1.75 (t 0.56) | 4.93 (t 1.24) | −4.70 (t −1.08) | too few |
| GBPUSD | 9.99 (t 1.63) | 2.39 (t 0.03) | 1.94 (t 0.50) | −3.38 (t −0.43) | too few |
| XAUUSD | −1.64 (t −0.02) | −5.89 (t −0.11) | −1.61 (t 0.11) | 38.16 (t 1.06) | too few |
Observation 7.2: the daily t reaches 2 in absolute value in 0 of 17 cells, against about 0.8 by chance — below chance.
Observation 7.3: the night bin had too few observations in three series. Patterns complete mostly while the market is moving.
Observation 7.4: XAUUSD in NY late shows a large 38.16 pips, but its t is 1.06. The size comes from the size of gold's moves.
8. Limitations
- ★ Finding the patterns is mechanised one way, a 1.00 ATR retracement for the zigzag and 0.25 ATR for "the same height". That is not the pattern a person finds by eye; in practice a person decides which peaks to take. What is denied is the claim that the patterns themselves have a special frequency, not a practice that includes choosing the peaks. This is the chief limitation.
- Three patterns only. Triangles, flags and cup-with-handle are not treated.
- ★ Why the measurement produces fewer patterns is not explained. The synthetic series uses independent normal increments and its volatility changes more simply than a real market's. That difference may act on the zigzag, and this paper does not separate it.
- The baseline in Section 6 carries no error band. The significance should be read from the t in Section 5.
- The overlap is not removed. The horizon is 24 bars; with about one observation a day the overlap is limited, but not zero.
- The synthetic baseline uses independent normal increments. Volatility clustering is not included.
- Four instruments over three years. Nothing is said about other markets or other periods.
Conclusion
A double top appears 37.2886 times per thousand bars and head and shoulders 11.1283 times, agreeing well across four series.
But on a synthetic series known by construction to carry zero directional information, a double top appears 46.2858 times per thousand bars. More than in the measurement. The ratio has a median of 0.8042 and is below one in all twelve cells.
A synthetic random walk has no ceiling, no floor, no sellers, no buyers and no psychology. The patterns appear anyway.
The move after a pattern completes is +2.8352 pips for the double top, +10.6255 pips for the triple top and +3.7470 pips for head and shoulders, with signs as predicted. But 0 of 12 cells reach a daily t of 2 in absolute value (chance gives 0.5), and splitting into sessions gives 0 of 17.
The patterns appear not because of the market but because of the zigzag.
And what this paper could measure is only the patterns on a mechanically drawn zigzag. About a practice in which a person chooses which peaks to take, nothing is answered here.
Data and reproduction
| Data | Currency ticks from Dukascopy (agreement to the millisecond, bid and ask, verified from 2019 onward). Gold from Dukascopy |
| Period | 2019–2024 (six years). Evaluation 2022–2024 |
| Instruments | USDJPY, EURUSD, GBPUSD, XAUUSD |
| Bars | One-hour, mid price, closing value of completed bars only. Bars with no ticks are not created |
| Zigzag | A reversal is confirmed on the bar that retraces 1.00 ATR from the latest extreme (never on the extreme's own bar) |
| Verification | 検算/F016.py (with --zu it also writes the figures). Every number in the text is taken from 検算/F016_output.txt |
| Figures | 図/F016_zu1, 図/F016_zu2 (png, svg, English versions) |
| Random seeds | Fixed at 0–9. Re-running gives the same values |
| Audit of the foundation | _ツール/audit_bars.py (look-ahead in the bars, daylight saving, the day boundary). The record is _土台の検査.txt |
References
- Yamagishi, Y. (2026). Round Numbers Do Not Attract Price [F011]. Zenodo. 10.5281/zenodo.22891487
- Yamagishi, Y. (2026). The Failure Rate of a "Fakeout" Is Set by the Definition [F015]. Zenodo. 10.5281/zenodo.22891741
Reference
Yamagishi, Y. (2026). Chart Patterns Appear Just as Often on a Synthetic Random Walk [F016]. Zenodo.
DOI: 10.5281/zenodo.22891793
YOI: https://www.yamagishiyuuki.com/yoi/F016
ORCID: 0009-0006-8587-3450
PDF (English) · PDF (Japanese) · Date proof of the English PDF (OpenTimestamps .ots) · SHA256SUMS
The record page for this paper (in Japanese, with the PDFs in each language and the date proof): YOI F016. This paper is a preprint and has not been peer reviewed.