Abstract
This paper asks what agrees and what does not when one rule is run on four clocks — the answer is that what the rule sets agrees and what the cut sets does not. It claims neither a new mathematical theorem nor a new law.
First, four ways of cutting bars (clock, event count, displacement, path length) were built with their scales chosen so that the median time per bar comes closest to 60 minutes. The departure from 60 minutes is 5.0000 minutes at the median and 5.0000 at the maximum (Section 3).
Second, and this is the core of the paper, running the same moving-average crossover (5 and 20) on all four puts the interval between crossings between 12.0000 and 14.0000 bars. The median largest-to-smallest ratio by instrument is 1.0833 (Section 5).
Third, across the same four, other quantities do not agree. The largest-to-smallest ratio is 3.0434 times for the median move per bar, 3.3746 times for its scatter and 3.2248 times for the session spread (Sections 4 and 7).
Fourth, the session spread (largest ÷ smallest) is 3.5561 for the clock, 1.6429 for the event count, 1.0837 for displacement and 2.0177 for path length. Cutting by displacement all but removes the difference between sessions (Section 4).
Fifth, as for directional information, the daily t reaches 2 in absolute value in 0 of 16 cells on all four clocks, against about 0.7 by chance. The median D is −0.0150 pips against a median spread of 0.8000 pips (Section 6).
Sixth, putting five quantities on one page, only the interval between crossings agrees. Taking "agrees" to mean a ratio below 1.5 is a convention this paper adopted (Section 7).
Scope of this paper (scope note): No new mathematical theorem and no new law is claimed — the four ways of cutting and the moving-average crossover are known. No particular product or proponent is discussed — no real course, author, or vendor is the subject here, and none is named. What is treated is the public bar types themselves. Trading is not discussed — what is measured is intervals, moves and directional information, not trading performance including commissions, fills and money management. The scope is intraday and a small number of instruments — four series over three years. Monthly time-series momentum (dozens of markets, holding one to twelve months) is documented in the literature, and this paper does not contradict it. ★ The source bars are fixed at five minutes — all four clocks are assembled from five-minute bars, so every boundary falls on a five-minute mark (Section 8). One rule only — the crossover of moving averages 5 and 20. "Agrees" was set at a ratio below 1.5 — this is the paper's convention, not something the measurement produced (Section 7). No forecast is claimed. Relation to earlier papers: F001 showed that the interval of a moving-average crossover comes from the two periods, F017 measured what changes on a renko chart and F018 on tick bars — this paper closes the sixth part by putting all four on one footing. What is added here is matching the median time per bar, putting what agrees and what does not into one table, and writing the convention behind that judgement into the text.
1. Notation and the question — writing the predictions first
There are four ways of cutting bars.
| Clock | What cuts it | What one bar means |
|---|---|---|
| Clock | time | the convention of an hour |
| Event count | the number of quote updates | N updates |
| Displacement | distance from the previous bar | that price moved the chosen distance |
| Path length | the accumulated amount moved | that this much was travelled, round trips included |
Observation 1.1: these are four different clocks. From one market they produce four different sequences of bars.
Observation 1.2: Prediction. The interval between moving-average crossings (in bars) is set by the two periods (F001 of this series). If that is so, the number of bars should agree even when the clock changes.
Observation 1.3: A second prediction. The size of the move per bar is the definition of the cut itself, so it should not agree.
Observation 1.4: ★ any comparison requires matching the median time per bar. Without that, it is only a comparison of "the finer bars differ".
Question: when one rule is run on four clocks, what agrees and what does not?
2. Writing the quantity and the design in advance
Design (declared before running and unchanged at run time)
| Item | Decision |
|---|---|
| Source bars | five-minute bars (mid price, completed bars only) |
| ① Clock | five-minute bars grouped a fixed number at a time |
| ② Event count | one bar once the tick count sums to N or more |
| ③ Displacement | one bar once price moves k or more from the previous bar's close (renko) |
| ④ Path length | one bar once the absolute differences of five-minute closes sum to L or more |
| Matching | the scales for ②③④ are chosen so that the median time per bar comes closest to 60 minutes |
| Rule | the crossover of moving averages 5 and 20 (buy when the fast is above) |
| Directional information | 288 bars ahead (24 hours) |
| Sessions | five non-overlapping bins in Coordinated Universal Time |
| Instruments | USDJPY, EURUSD, GBPUSD, XAUUSD |
| Period | 2019–2024. Evaluation 2022–2024 |
Observation 2.1: ★ the scales are chosen by "closest to 60 minutes", not by results. Choosing by results would be the act of picking the best of four.
Observation 2.2: all four are assembled from five-minute bars. So every clock has boundaries on five-minute marks, and the finer the scale the more that coarseness matters.
Observation 2.3: the threshold for "agrees" is not decided afterwards; it is set at a ratio below 1.5 and written in Section 7. ★ It is the paper's convention, not something the measurement produced.
The median five-minute move is 2.1000 pips for USDJPY, 1.3000 for EURUSD, 1.7500 for GBPUSD and 4.7000 for XAUUSD.
3. Matching the four clocks on the median time per bar
Calculation 3.1 The chosen scales and the time per bar (evaluation period)
| Instrument | Clock | Scale | Bars | Minutes per bar (median) |
|---|---|---|---|---|
| USDJPY | clock | 12 | 17,857 | 60.0000 |
| USDJPY | event count | 7,201 | 15,482 | 55.0000 |
| USDJPY | displacement | 0.198329 | 8,558 | 65.0000 |
| USDJPY | path length | 0.379989 | 16,823 | 55.0000 |
| EURUSD | clock | 12 | 17,883 | 60.0000 |
| EURUSD | event count | 4,919 | 15,480 | 55.0000 |
| EURUSD | displacement | 0.001228 | 8,585 | 60.0000 |
| EURUSD | path length | 0.002352 | 16,911 | 55.0000 |
| GBPUSD | clock | 12 | 17,864 | 60.0000 |
| GBPUSD | displacement | 0.001653 | 8,228 | 65.0000 |
| XAUUSD | clock | 12 | 17,483 | 60.0000 |
| XAUUSD | event count | 10,540 | 13,047 | 65.0000 |
| XAUUSD | displacement | 3.781029 | 9,741 | 55.0000 |
| XAUUSD | path length | 8.504516 | 15,960 | 60.0000 |
Observation 3.2: the departure from 60 minutes is 5.0000 minutes at the median and 5.0000 at the maximum. With five-minute bars as the building block, matching is only possible in five-minute steps.
Observation 3.3: the counts do not agree. Displacement gives 8,228 to 9,741 bars, the clock 17,483 to 17,883. The medians agree while the shapes of the distributions differ.
Observation 3.4: displacement has half as many bars. Even with the median time per bar at 60 minutes, a distribution with few long bars and many short ones yields fewer bars. ★ Matching medians does not match distributions.
4. What does not agree — the move per bar and the session spread
Calculation 4.1 Move and session spread (evaluation period)
| Instrument | Clock | Median move (pips) | Move CV | Session largest ÷ smallest |
|---|---|---|---|---|
| USDJPY | clock | 7.6500 | 1.2842 | 2.2673 |
| USDJPY | event count | 10.8500 | 1.0361 | 1.4400 |
| USDJPY | displacement | 22.9000 | 0.4539 | 1.0510 |
| USDJPY | path length | 11.3500 | 0.9506 | 1.5132 |
| EURUSD | clock | 4.5500 | 1.1991 | 4.0000 |
| EURUSD | event count | 6.9500 | 0.9226 | 1.8280 |
| EURUSD | displacement | 14.0750 | 0.3498 | 1.1128 |
| EURUSD | path length | 6.7500 | 0.8957 | 2.1446 |
| GBPUSD | clock | 6.1000 | 1.2056 | 4.1509 |
| GBPUSD | event count | 9.3500 | 0.9601 | 1.8719 |
| GBPUSD | displacement | 18.9000 | 0.3630 | 1.0773 |
| GBPUSD | path length | 9.0500 | 0.9086 | 2.0548 |
| XAUUSD | clock | 16.3000 | 1.2125 | 3.1121 |
| XAUUSD | event count | 24.9000 | 0.9277 | 1.4579 |
| XAUUSD | displacement | 43.7500 | 0.3268 | 1.0901 |
| XAUUSD | path length | 23.0200 | 0.8831 | 1.9806 |
Calculation 4.2 Medians by clock
| Clock | Median move CV | Median session ratio |
|---|---|---|
| Clock | 1.2090 | 3.5561 |
| Event count | 0.9439 | 1.6429 |
| Displacement | 0.3564 | 1.0837 |
| Path length | 0.9021 | 2.0177 |
Observation 4.3: the move CV scatters from 0.3268 to 1.2842 (a ratio of 3.9302). The session ratio runs from 1.0510 to 4.1509 (a ratio of 3.9495).
Observation 4.4: ★ cutting by displacement all but removes the difference between sessions (median ratio 1.0837). That is to be expected. Cutting by displacement means "one bar per fixed distance travelled", so the move per bar is nearly constant by definition.
Observation 4.5: so "cutting by displacement makes the move uniform" must not be written up as a benefit. ★ It is not a measurement but a restatement of the definition.
Observation 4.6: the session difference survives in the order clock 3.5561, path length 2.0177, event count 1.6429. Cutting by event count narrows it considerably (consistent with F018).
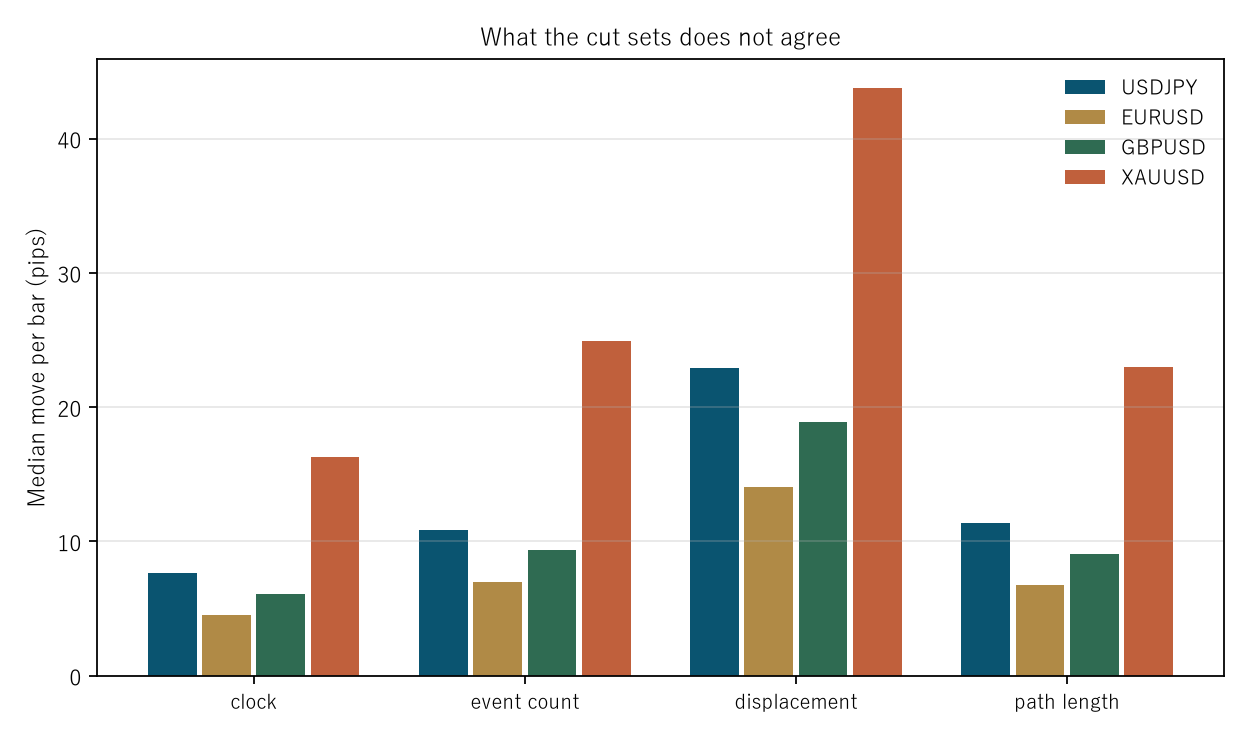
Figure 2: median move per bar on the four clocks. Across different instruments the clocks fall in the same order.
5. What agrees — the interval between crossings
Calculation 5.1 Median bars between moving-average crossings (evaluation period)
| Instrument | Clock | Event count | Displacement | Path length | Largest ÷ smallest |
|---|---|---|---|---|---|
| USDJPY | 13.0000 | 13.0000 | 13.0000 | 13.0000 | 1.0000 |
| EURUSD | 14.0000 | 13.0000 | 12.0000 | 14.0000 | 1.1667 |
| GBPUSD | 12.0000 | 12.0000 | 13.0000 | 12.0000 | 1.0833 |
| XAUUSD | 13.0000 | 13.0000 | 13.0000 | 12.0000 | 1.0833 |
Observation 5.2: ★ the interval falls between 12.0000 and 14.0000 bars in all 16 cells. The largest-to-smallest ratio is 1.1667, with a median by instrument of 1.0833.
Observation 5.3: ★ the medians by clock are 13.0000 for the clock, 13.0000 for the event count, 13.0000 for displacement and 12.5000 for path length. Different cuts and different instruments, and the same number of bars.
Observation 5.4: ★ as predicted. What sets the interval is the two periods of the moving averages — neither the market nor the cut.
Observation 5.5: ★ therefore "on this bar type the crossover captures waves of about 13 bars" is a restatement of the periods one chose. That the number does not change when the bar type changes is the evidence.
Observation 5.6: the count agrees while the time does not. The median time per bar is 60.0000 minutes on the clock and 65.0000 on displacement (USDJPY), so the same 13 bars do not take the same time.
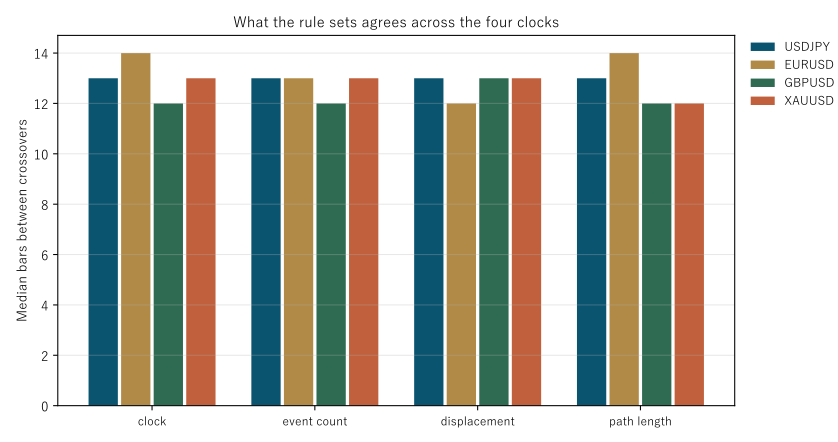
Figure 1: median bars between crossings on the four clocks. In every instrument the four bars stand at nearly the same height.
6. Does the directional information change with the clock?
Calculation 6.1 Same rule, same horizon, only the cut changed (evaluation period)
| Instrument | Clock | Count | D (pips) | Daily t | Spread |
|---|---|---|---|---|---|
| USDJPY | clock | 17,813 | 1.9350 | 1.37 | 0.60 |
| USDJPY | event count | 15,443 | 0.2463 | 1.15 | 0.70 |
| USDJPY | displacement | 8,529 | −3.3003 | 0.59 | 0.70 |
| USDJPY | path length | 16,783 | 0.0621 | 1.63 | 0.70 |
| EURUSD | clock | 17,840 | 0.5482 | 1.36 | 0.30 |
| EURUSD | event count | 15,446 | 0.5852 | 1.14 | 0.30 |
| EURUSD | displacement | 8,559 | −1.5699 | −0.14 | 0.30 |
| EURUSD | path length | 16,872 | 0.2036 | 1.09 | 0.30 |
| GBPUSD | clock | 17,819 | −0.0922 | 0.34 | 0.90 |
| GBPUSD | displacement | 8,201 | −0.3602 | 0.13 | 0.90 |
| XAUUSD | clock | 17,440 | 1.9130 | −0.11 | 3.54 |
| XAUUSD | event count | 13,012 | −1.3384 | −0.61 | 3.61 |
| XAUUSD | displacement | 9,710 | −1.3173 | −0.11 | 3.70 |
| XAUUSD | path length | 15,920 | −0.1511 | −0.21 | 3.61 |
Observation 6.2: the daily t reaches 2 in absolute value in 0 of 16 cells. Chance gives about 0.7, so the measurement is below chance.
Observation 6.3: the overall median D is −0.0150 pips against a median spread of 0.8000 pips. No clock reaches it.
Observation 6.4: the median D by clock scatters: +1.2306 for the clock, +0.2178 for the event count, −1.4436 for displacement and −0.0445 pips for path length, a largest-to-smallest ratio of 7.7727 (Section 7). But no daily t reaches 2, so that scatter is noise.
Observation 6.5: D is negative for displacement in all four series. This paper does not claim it. The counts are half those of the others and the daily t runs from −0.14 to 0.59.
7. Putting what agrees and what does not on one page
Calculation 7.1 Largest ÷ smallest across the four clocks (median of four series)
| Quantity | Largest ÷ smallest | Agrees? |
|---|---|---|
| Bars between crossings | 1.0833 | yes |
| Move per bar | 3.0434 | no |
| Move CV | 3.3746 | no |
| Session largest ÷ smallest | 3.2248 | no |
| Absolute daily t | 7.7727 | no |
Observation 7.2: ★ "agrees" was set at a ratio below 1.5. That is a convention this paper adopted, not something the measurement produced. Another threshold would change the verdict. But the gap between 1.0833 and 3.0434 is wide enough that any threshold from 1.5 to 2.5 gives the same answer.
Observation 7.3: ★ what agreed is only what the rule sets. The interval between crossings is set by the two periods of the moving averages and does not move when the clock changes.
Observation 7.4: ★ what did not agree is what the cut sets. The move per bar, its scatter and the session difference all follow from the definition of the cut.
Observation 7.5: the absolute daily t has the largest ratio at 7.7727, but that is not "disagreement" so much as "all of them near zero". Ratios between small numbers come out large. ★ A ratio must not be read alone.
Observation 7.6: ★ so any discussion of bar types should be read in two parts: is the quantity set by the rule or by the cut? The former cannot be presented as a benefit of the bar type, and the latter cannot be presented as a property of the market.
8. Limitations
- ★ The source bars are fixed at five minutes. All four clocks are assembled from five-minute bars, so every boundary falls on a five-minute mark. The median time per bar can therefore only be matched in five-minute steps, and a departure of 5.0000 minutes from 60 remained.
- One rule only, the crossover of moving averages 5 and 20. Another rule might make other quantities agree.
- ★ "Agrees" was set at a ratio below 1.5. It is the paper's convention, not something the measurement produced.
- Medians were matched; distributions were not. Displacement gives half as many bars. The same median time per bar does not mean the same shape.
- Scales were not chosen by results but by "closest to 60 minutes". Choosing by results would be the act of picking the best of four.
- The drift is not separated. The signs of D in Section 6 include which way each instrument moved over the period.
- Four instruments over three years. Nothing is said about other markets or other periods.
Conclusion
Four ways of cutting — clock, event count, displacement, path length — were built matched to a median of 60 minutes per bar, and the same moving-average crossover was run on all four.
The interval between crossings fell between 12.0000 and 14.0000 bars in all 16 cells, a largest-to-smallest ratio of 1.0833. Different cuts and different instruments, and the same number of bars.
But across the same four, the move per bar differed by 3.0434 times, its scatter by 3.3746 and the session spread by 3.2248.
What the rule sets agrees, and what the cut sets does not.
As for directional information, the daily t reached 2 in absolute value in 0 of 16 cells on all four clocks (chance gives 0.7). The median D is −0.0150 pips against a median spread of 0.8000 pips.
★ Choosing a bar type is choosing a ruler. "On this bar type the crossover captures waves of about 13 bars" is a restatement of the moving-average periods one chose, and that the number does not change when the bar type changes is the evidence.
And what this paper could measure is four clocks assembled from five-minute bars. About four clocks cut directly from ticks, nothing is answered here.
Data and reproduction
| Data | Currency ticks from Dukascopy (agreement to the millisecond, bid and ask, verified from 2019 onward). Gold from Dukascopy |
| Period | 2019–2024 (six years). Evaluation 2022–2024 |
| Instruments | USDJPY, EURUSD, GBPUSD, XAUUSD |
| Source bars | Five-minute, mid price, closing value of completed bars only. Bars with no ticks are not created |
| Four clocks | Clock (a fixed number of bars) / event count (summed tick counts) / displacement (distance from the previous bar) / path length (summed absolute differences) |
| Matching | Scales chosen so that the median time per bar comes closest to 60 minutes (never chosen by results) |
| Rule | Crossover of moving averages 5 and 20; horizon 288 bars (24 hours) |
| Verification | 検算/F019.py (with --zu it also writes the figures). Every number in the text is taken from 検算/F019_output.txt |
| Figures | 図/F019_zu1, 図/F019_zu2 (png, svg, English versions) |
| Audit of the foundation | _ツール/audit_bars.py (look-ahead in the bars, daylight saving, the day boundary). The record is _土台の検査.txt |
References
- Yamagishi, Y. (2026). The Period a Moving-Average Crossover Finds Is Made by the Ratio of the Two Periods [F001]. Zenodo. 10.5281/zenodo.22880428
- Yamagishi, Y. (2026). A Renko Chart Is a Different Clock [F017]. Zenodo. 10.5281/zenodo.22891823
- Yamagishi, Y. (2026). Bars Cut by Tick Count Are a Different Clock from Bars Cut by the Clock [F018]. Zenodo. 10.5281/zenodo.22891916
Reference
Yamagishi, Y. (2026). Running One Rule on Four Clocks: What Agrees and What Does Not [F019]. Zenodo.
DOI: 10.5281/zenodo.22891953
YOI: https://www.yamagishiyuuki.com/yoi/F019
ORCID: 0009-0006-8587-3450
PDF (English) · PDF (Japanese) · Date proof of the English PDF (OpenTimestamps .ots) · SHA256SUMS
The record page for this paper (in Japanese, with the PDFs in each language and the date proof): YOI F019. This paper is a preprint and has not been peer reviewed.