Abstract
This paper asks whether candlestick shapes belong to the market or to the way the bars were cut — the answer is that they belong to the cut. It claims neither a new mathematical theorem nor a new law.
First, the frequency of four shapes (engulfing, inside bar, pin bar, doji) moves from changing the bar size alone. The median largest-to-smallest ratio by instrument and shape is 1.1745, the maximum 1.5721. A pin bar appears 67.6854 times per thousand five-minute bars and 45.7459 times per thousand four-hour bars (Section 3).
Second, and this is the core of the paper, whether a bar engulfs the previous one is decided by whether this open lies inside the previous close. The median absolute distance between those two is 0.1111 of the spread (median), ranging from 0.0417 to 0.1667 (Section 4).
Third, the share where that distance is exactly zero has a median of 1.3732%. So whether a bar engulfs is sorted almost evenly by a quantity about a tenth of the spread (Section 4).
Fourth, the ratio against a synthetic random walk departs systematically by shape: 0.4986 to 0.5107 for engulfing, 1.4474 to 1.6656 for inside bars, 0.5886 to 0.6420 for pin bars and 1.3077 to 1.3894 for dojis. 0 of 16 cells fall between 0.8 and 1.25 (Section 5).
Fifth, ★ the departure for engulfing is explained by how the baseline is built. On a synthetic random walk the open equals the previous close exactly, so the condition is satisfied automatically. That baseline cannot be used for shapes that involve the open. This paper measured that before writing it (Sections 4 and 5).
Sixth, the directional information over 24 hours from the bar carrying the shape reaches a daily t of 2 in absolute value in 2 of 16 cells (chance gives about 0.7). Changing the bar size moves the median D from −1.4472 to +0.5823 pips, sign included (Sections 6 and 7).
Scope of this paper (scope note): No new mathematical theorem and no new law is claimed — the definitions of candlestick shapes and random walks are known. No particular product or proponent is discussed — no real course, author, or vendor is the subject here, and none is named. What is treated is the public shapes themselves. Trading is not discussed — what is measured is occurrence rates and directional information, not trading performance including commissions, fills and money management. The scope is intraday and a small number of instruments — four series over three years. Monthly time-series momentum (dozens of markets, holding one to twelve months) is documented in the literature, and this paper does not contradict it. One set of definitions is fixed — a pin bar's tail is 2.0 times the body or more with the other tail 0.5 times or less, and a doji's body is 10% of the range or less. Other thresholds give other frequencies (Section 9). ★ The synthetic baseline cannot be used for shapes that involve the open — on the synthetic series the open equals the previous close exactly. This paper measured that before writing it (Section 4). The overlap is not removed — the horizon is 24 hours. No forecast is claimed. Relation to earlier papers: F016 compared multi-swing patterns (double tops and so on) against a synthetic random walk — this paper applies the same move to the shapes of one or two bars. What is added here is showing that the frequency moves with the bar size, placing the distance used to judge engulfing beside the spread, and measuring and stating where the baseline cannot be used.
1. Notation and the question
Shapes made of one or two candles carry names.
| Shape | Definition (the buy direction) | What is said about it |
|---|---|---|
| Engulfing | the previous bar is down, this one up, and this body engulfs the previous one | buyers swallowed the sellers |
| Inside bar | this bar's high and low fall inside the previous bar's | the momentum stopped |
| Pin bar | a long lower tail and a short upper one | price was bought up from below |
| Doji | an extremely small body | hesitation, a turn |
Observation 1.1: each can be judged the moment its bar completes. No look-ahead. That part is correct.
Observation 1.2: but a shape depends on how the bars are cut. The same price movement makes different shapes cut at five minutes or at four hours. "The sellers ran out of strength" does not mention the cut.
Observation 1.3: the question settles by measuring three things. Does the frequency move with the bar size? Does it appear on a synthetic random walk? And how small is the difference being used to judge?
Question: do candlestick shapes belong to the market, or to the way the bars were cut?
2. Writing the quantity and the design in advance
Design (declared before running and unchanged at run time)
| Item | Decision |
|---|---|
| Bar sizes | five-minute, one-hour, four-hour (mid price, completed bars only) |
| Engulfing | the previous bar down and this one up, this close at or above the previous open, this open at or below the previous close, and this body larger |
| Inside bar | this bar's high and low fall inside the previous bar's (direction opposite the previous bar's colour) |
| Pin bar | the lower tail is 2.0 times the body or more and the upper tail 0.5 times or less |
| Doji | the body is 10% of the range or less (direction opposite the previous bar's colour) |
| Directional information | a signal on the bar carrying the shape, over the next 24 hours (pips) |
| Baseline | synthetic series random down to the movement inside each bar (10 realisations) |
| Instruments | USDJPY, EURUSD, GBPUSD, XAUUSD |
| Period | 2019–2024. Evaluation 2022–2024 |
Observation 2.1: the sell side uses the same definition with the signs reversed. Counting only buys would be dragged by which way the period went.
Observation 2.2: the horizon is held at 24 hours across bar sizes. Without that, "the shape worked" cannot be separated from "a different span was looked at".
Observation 2.3: ★ the synthetic baseline turns out to have a problem. Section 4 measures it and Section 5 says how far it can be used.
In the evaluation period the bar counts are, for USDJPY, 214,291 five-minute, 17,865 one-hour and 4,812 four-hour; for EURUSD 214,605, 17,891, 4,822; for GBPUSD 214,370, 17,874, 4,818; and for XAUUSD 209,799, 17,495, 4,735.
3. The frequency of the shapes moves with the bar size
Calculation 3.1 Occurrences per thousand bars (evaluation period)
| Instrument | Shape | 5m | 1h | 4h | Largest ÷ smallest |
|---|---|---|---|---|---|
| USDJPY | engulfing | 126.8789 | 127.7918 | 133.0008 | 1.0483 |
| USDJPY | inside bar | 155.0042 | 167.5343 | 193.2668 | 1.2468 |
| USDJPY | pin bar | 67.6277 | 53.6804 | 43.0175 | 1.5721 |
| USDJPY | doji | 100.2095 | 109.0960 | 109.3101 | 1.0908 |
| EURUSD | engulfing | 113.6041 | 125.6498 | 118.4156 | 1.1060 |
| EURUSD | inside bar | 148.0534 | 153.0378 | 181.2526 | 1.2242 |
| EURUSD | pin bar | 67.7431 | 49.1867 | 48.1128 | 1.4080 |
| EURUSD | doji | 96.2419 | 105.3043 | 101.6176 | 1.0942 |
| GBPUSD | engulfing | 114.9694 | 124.7622 | 129.3068 | 1.1247 |
| GBPUSD | inside bar | 145.8740 | 145.5746 | 178.9124 | 1.2290 |
| GBPUSD | pin bar | 67.8966 | 53.4855 | 43.3790 | 1.5652 |
| GBPUSD | doji | 100.7837 | 102.6631 | 103.7775 | 1.0297 |
| XAUUSD | engulfing | 120.8204 | 126.8362 | 118.9018 | 1.0667 |
| XAUUSD | inside bar | 140.4058 | 162.4464 | 206.5470 | 1.4711 |
| XAUUSD | pin bar | 61.7543 | 51.7862 | 48.5744 | 1.2713 |
| XAUUSD | doji | 98.0748 | 105.2301 | 107.7086 | 1.0982 |
Calculation 3.2 Medians by shape and bar size (per thousand bars)
| Shape | 5m | 1h | 4h |
|---|---|---|---|
| Engulfing | 117.8949 | 126.2430 | 124.1043 |
| Inside bar | 146.9637 | 157.7421 | 187.2597 |
| Pin bar | 67.6854 | 52.6359 | 45.7459 |
| Doji | 99.1422 | 105.2672 | 105.7430 |
Observation 3.3: the median largest-to-smallest ratio across bar sizes is 1.1745, ranging from 1.0297 to 1.5721.
Observation 3.4: pin bars move most with the bar size. 67.6854 per thousand five-minute bars against 45.7459 per thousand four-hour bars: the finer the bar, the more of them.
Observation 3.5: inside bars go the other way. 146.9637 on five-minute bars and 187.2597 on four-hour ones: the coarser the bar, the more of them.
Observation 3.6: ★ since the direction reverses between shapes, this cannot be explained by "the market changed". The bars are built from the same period and the same prices. What moves is only the cut.
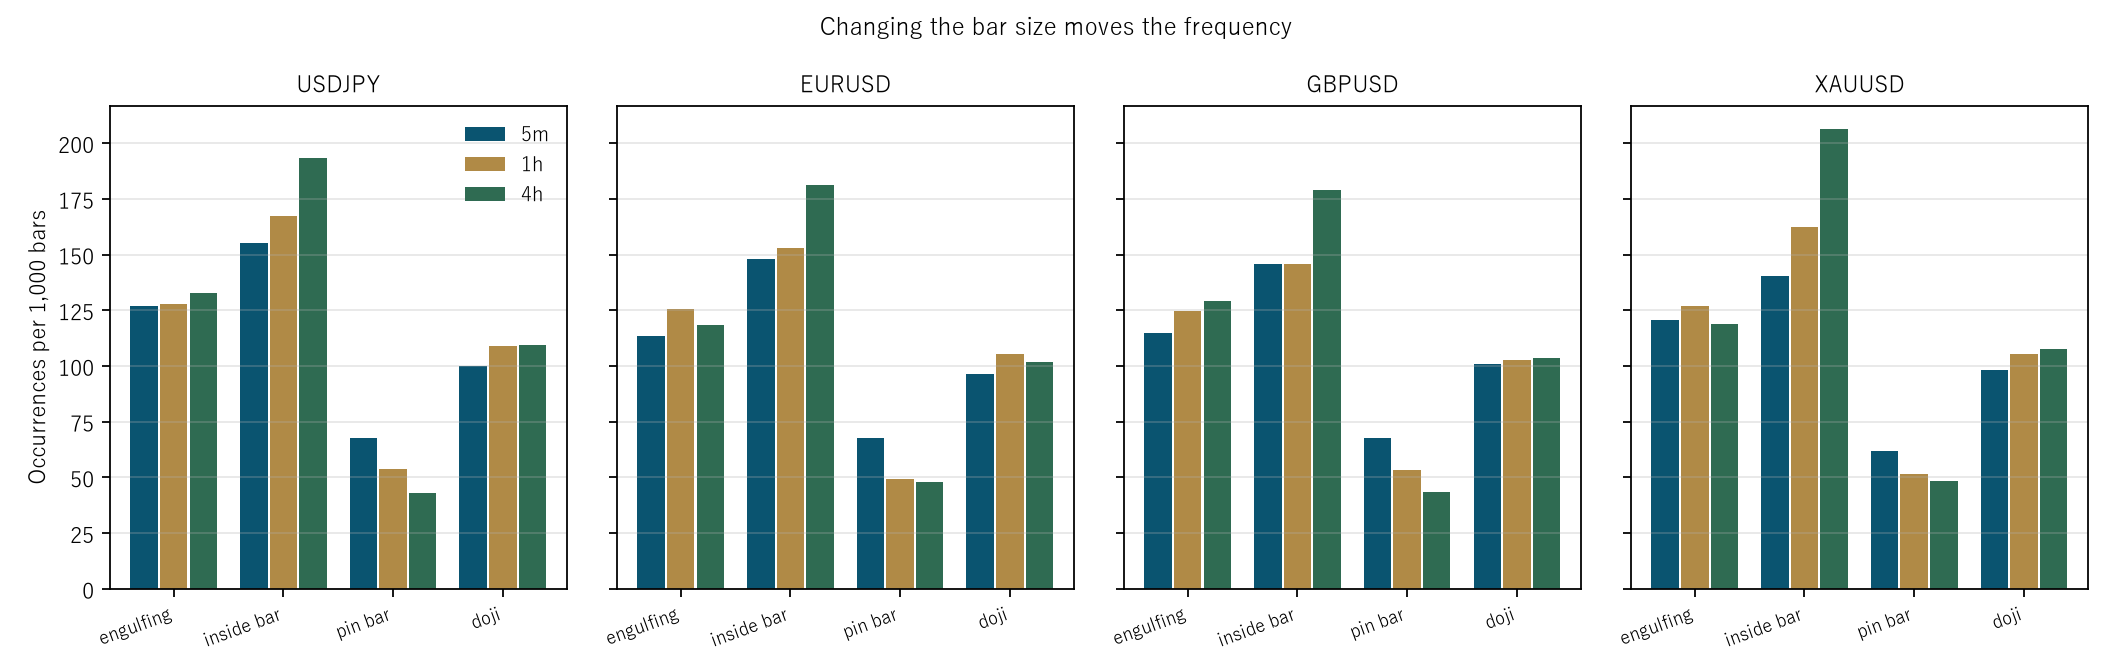
Figure 2: occurrences per thousand bars at three bar sizes, one panel per instrument. The direction across bar sizes reverses between shapes.
4. Engulfing is decided by a tenth of the spread — this is the separator
Calculation 4.1 The distance between this open and the previous close (evaluation period)
| Instrument | Bar size | Median absolute distance (pips) | Median spread | Distance ÷ spread | Share exactly zero |
|---|---|---|---|---|---|
| USDJPY | 5m | 0.0500 | 0.6000 | 0.0833 | 10.2127% |
| USDJPY | 1h | 0.1000 | 0.6000 | 0.1667 | 9.6781% |
| USDJPY | 4h | 0.1000 | 0.6000 | 0.1667 | 9.4971% |
| EURUSD | 5m | 0.0500 | 0.3000 | 0.1667 | 1.2246% |
| EURUSD | 1h | 0.0500 | 0.3000 | 0.1667 | 1.9507% |
| EURUSD | 4h | 0.0500 | 0.3000 | 0.1667 | 2.1360% |
| GBPUSD | 5m | 0.0500 | 0.9000 | 0.0556 | 1.0473% |
| GBPUSD | 1h | 0.1000 | 0.9000 | 0.1111 | 1.5218% |
| GBPUSD | 4h | 0.1000 | 0.9000 | 0.1111 | 1.1416% |
| XAUUSD | 5m | 0.1500 | 3.5400 | 0.0424 | 0.5529% |
| XAUUSD | 1h | 0.1500 | 3.5700 | 0.0420 | 0.8059% |
| XAUUSD | 4h | 0.1500 | 3.6000 | 0.0417 | 0.8448% |
Observation 4.2: ★ the median of that distance divided by the spread is 0.1111, ranging from 0.0417 to 0.1667.
Observation 4.3: ★ engulfing is decided by the sign of that distance. So whether a bar engulfs is sorted by a quantity about a tenth of the spread.
Observation 4.4: the share where the distance is exactly zero has a median of 1.3732%. For USDJPY it reaches 9.4971% to 10.2127%. USDJPY is high because its price grid is coarse relative to one pip.
Observation 4.5: ★ so "buyers swallowed the sellers" rides on the sign of a difference an order of magnitude below the spread. That difference is smaller than the width at which one can transact.
Observation 4.6: ★ and on the synthetic series that distance is exactly zero. The bars are built from a continuous walk, so the open equals the previous close exactly. The engulfing condition is therefore satisfied automatically and the frequency jumps. That baseline cannot be used for shapes that involve the open.
5. The baseline — where it can be used and where it cannot
Calculation 5.1 Against the synthetic random walk (hourly, 10 realisations, per thousand bars)
| Instrument | Shape | Measured | Random walk | Ratio |
|---|---|---|---|---|
| USDJPY | engulfing | 127.7918 | 250.2323 | 0.5107 |
| USDJPY | inside bar | 167.5343 | 100.5877 | 1.6656 |
| USDJPY | pin bar | 53.6804 | 83.6104 | 0.6420 |
| USDJPY | doji | 109.0960 | 78.5223 | 1.3894 |
| EURUSD | engulfing | 125.6498 | 250.2040 | 0.5022 |
| EURUSD | inside bar | 153.0378 | 100.5701 | 1.5217 |
| EURUSD | pin bar | 49.1867 | 83.5727 | 0.5886 |
| EURUSD | doji | 105.3043 | 78.4976 | 1.3415 |
| GBPUSD | engulfing | 124.7622 | 250.2350 | 0.4986 |
| GBPUSD | inside bar | 145.5746 | 100.5763 | 1.4474 |
| GBPUSD | pin bar | 53.4855 | 83.6075 | 0.6397 |
| GBPUSD | doji | 102.6631 | 78.5051 | 1.3077 |
| XAUUSD | engulfing | 126.8362 | 250.2544 | 0.5068 |
| XAUUSD | inside bar | 162.4464 | 100.3887 | 1.6182 |
| XAUUSD | pin bar | 51.7862 | 83.7611 | 0.6183 |
| XAUUSD | doji | 105.2301 | 78.6225 | 1.3384 |
Observation 5.2: the median measured-to-random ratio is 0.9749, but the range runs from 0.4986 to 1.6656. 0 of 16 cells fall between 0.8 and 1.25.
Observation 5.3: ★ the median being near one is an accident. The departures are systematic by shape, and taking their average is all the median did. A median must not be read alone.
Observation 5.4: ★ engulfing appears 250.2040 to 250.2544 times per thousand on the synthetic series — exactly twice the measurement. As Section 4 showed, the open equals the previous close exactly, so the condition is satisfied automatically. That ratio says nothing about the market; it speaks about how the baseline was built.
Observation 5.5: the doji also uses the open (the body is close minus open) and is distorted the same way. That its ratio stays between 1.3077 and 1.3894 is because the distortion is constant.
Observation 5.6: ★ what can be used are the shapes that do not involve the open. An inside bar uses only highs and lows; a pin bar uses only ratios among one bar's four values. Inside bars are 1.4474 to 1.6656 times more frequent in the measurement, pin bars 0.5886 to 0.6420 times less. Neither matches the random walk, but that gap does not mean the shape carries meaning: real bars are not a continuous walk and the size of the move changes by session.
Observation 5.7: ★ this paper does not conclude that "the shapes appear as often as on a random walk". ★ What it can conclude is that the frequency depends strongly on both the cut (Section 3) and the construction of the baseline (Section 4).
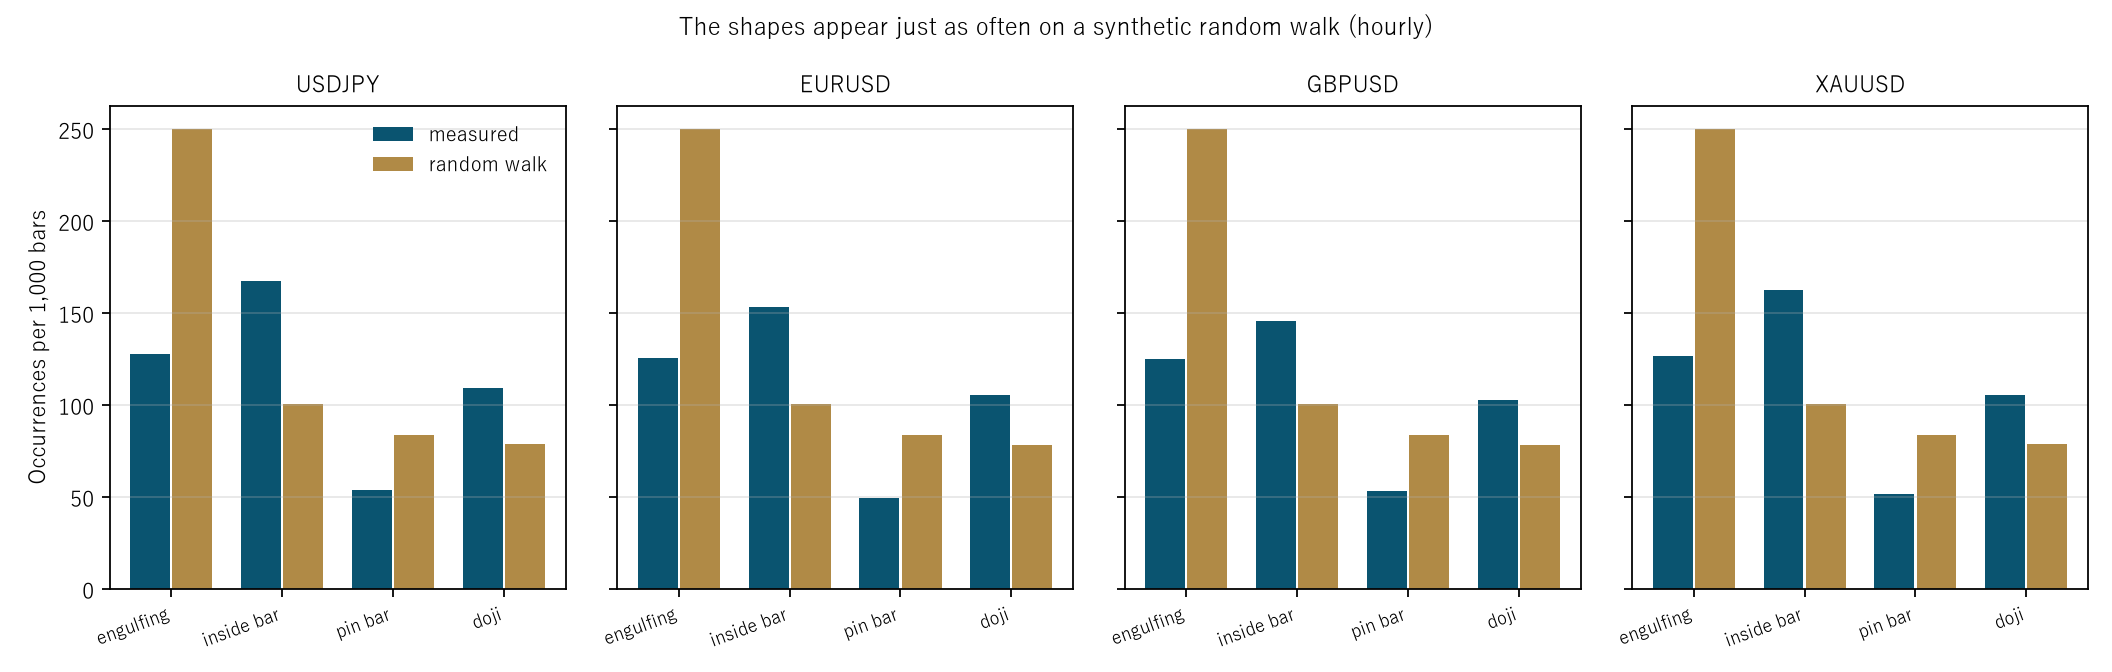
Figure 1: occurrences per thousand bars for the four shapes, by instrument. The dark bars (measured) and the light ones (random walk) depart systematically by shape.
6. The move after the bar carrying the shape
Calculation 6.1 The move in the direction the shape predicts (hourly, 24 hours ahead, evaluation period)
| Instrument | Shape | Count | D (pips) | Dd (daily mean) | Daily t | Spread | Buy/sell |
|---|---|---|---|---|---|---|---|
| XAUUSD | engulfing | 2,219 | 1.5760 | 2.1087 | 0.47 | 3.57 | 1115/1099 |
| XAUUSD | inside bar | 2,842 | 1.9063 | 0.7280 | 0.17 | 3.57 | 1423/1415 |
| XAUUSD | pin bar | 906 | −1.2516 | 3.0319 | 0.43 | 3.57 | 508/398 |
| XAUUSD | doji | 1,841 | −4.9772 | −6.9927 | −1.43 | 3.54 | 874/964 |
| GBPUSD | doji | 1,835 | 0.7914 | −0.3688 | −0.17 | 0.90 | 900/930 |
Observation 6.2: the median D by shape is +1.1849 for engulfing, +0.5323 for inside bars, −0.7979 for pin bars and +0.0544 pips for dojis, against a median spread of 0.7500 pips.
Observation 6.3: the daily t reaches 2 in absolute value in 2 of 16 cells. Chance gives about 0.7, so somewhat more.
Observation 6.4: the two that look significant are one engulfing and one pin bar. This paper does not claim them. The horizon is 24 hours and the observations overlap.
Observation 6.5: buys and sells are nearly equal (1423/1415 for XAUUSD inside bars). Only pin bars are skewed (508/398). Tails are not symmetric up and down, and that itself contains which way the period went.
7. Changing the bar size moves the directional information too
Calculation 7.1 Same shape, same 24 hours, only the bar size changed (evaluation period, pips)
| Instrument | Shape | 5m D | 5m t | 1h D | 1h t | 4h D | 4h t |
|---|---|---|---|---|---|---|---|
| USDJPY | engulfing | −0.1704 | −1.19 | 4.8417 | 3.00 | −0.4155 | 0.20 |
| USDJPY | inside bar | −0.6832 | −2.31 | −1.9012 | −0.58 | −3.8545 | −0.71 |
| USDJPY | pin bar | 1.0238 | 0.11 | 9.8877 | 3.16 | −0.7374 | −0.47 |
| USDJPY | doji | −0.9764 | −0.22 | −0.6826 | 0.12 | 1.7015 | 0.22 |
| EURUSD | engulfing | −0.6851 | −1.43 | 0.3731 | −0.26 | −2.5657 | −1.07 |
| EURUSD | inside bar | 0.2778 | 0.77 | 1.0428 | 1.72 | −4.5383 | −2.04 |
| GBPUSD | engulfing | 0.0665 | −0.48 | 0.7938 | 0.70 | −5.4092 | −2.05 |
| GBPUSD | pin bar | −0.6882 | −0.27 | −0.3442 | 0.14 | 1.9933 | 0.58 |
| XAUUSD | pin bar | −3.5413 | −2.89 | −1.2516 | 0.43 | −11.8705 | −1.14 |
| XAUUSD | inside bar | 1.1832 | −0.27 | 1.9063 | 0.17 | 10.8059 | 1.92 |
Observation 7.2: the median D by bar size is −0.2947 on five-minute bars, +0.5823 on hourly and −1.4472 pips on four-hour. The sign changes with the bar size.
Observation 7.3: the daily t reaches 2 in absolute value in 2 of 16 cells at all three bar sizes, against about 0.7 by chance. No bar size produces more than another.
Observation 7.4: ★ USDJPY's pin bar gives D = +9.8877 (t 3.16) on hourly bars and −0.7374 (t −0.47) on four-hour ones. Same shape, same period, same horizon — only the bar size changed, and the sign changed with it.
Observation 7.5: ★ so "this shape works" means nothing without stating the bar size. And trying three bar sizes guarantees that one of them looks good.
8. Splitting by session
Design: five non-overlapping bins in Coordinated Universal Time. The signal is the hourly engulfing bar.
Calculation 8.1 Directional information in each of the five bins (evaluation period)
| Instrument | Tokyo 0–7 | London 7–12 | Overlap 12–16 | NY late 16–21 | Night 21–24 |
|---|---|---|---|---|---|
| USDJPY | 4.85 (t 2.29) | 3.47 (t 0.92) | 4.57 (t 0.71) | 7.37 (t 1.58) | 3.71 (t 0.84) |
| EURUSD | −1.80 (t −1.26) | 3.50 (t 1.55) | 0.55 (t 0.23) | 0.34 (t 0.28) | 0.83 (t 0.48) |
| GBPUSD | −1.46 (t −0.81) | 2.54 (t 1.08) | 0.10 (t 0.61) | 0.95 (t 0.72) | 4.79 (t 1.21) |
| XAUUSD | −3.17 (t −0.59) | 6.77 (t 0.93) | 3.63 (t 0.49) | 9.32 (t 1.53) | −18.35 (t −1.23) |
Observation 8.2: the daily t reaches 2 in absolute value in 1 of 20 cells. Chance gives about 0.9, so about what chance gives.
Observation 8.3: the one that looks significant is USDJPY in the Tokyo bin (4.85, t 2.29). This paper does not claim it.
Observation 8.4: USDJPY is positive in all five bins. That may be a restatement of the instrument having risen over the period. The drift is not separated here.
9. Limitations
- ★ The synthetic baseline cannot be used for shapes that involve the open. On the synthetic series the open equals the previous close exactly, which distorts the frequency of engulfing and doji. This paper measured that before writing it, but did not build a corrected baseline. That is the chief limitation.
- One set of definitions is fixed, with 2.0 and 0.5 for the pin bar and 10% for the doji. Other thresholds give other frequencies. Sections 3 (movement with the bar size) and 4 (the distance being below the spread) do not depend on the thresholds.
- ★ Why inside bars and pin bars do not match the random walk is not explained. Real bars are not a continuous walk and the size of the move changes by session. That effect is not separated.
- The overlap is not removed. The horizon is 24 hours, so the daily t in Sections 6 and 7 is inflated.
- The drift is not separated. USDJPY being positive in all five bins in Section 8 contains which way the period went.
- The synthetic baseline uses independent normal increments. Volatility clustering is not included.
- Four instruments over three years. Nothing is said about other markets or other periods.
Conclusion
Candlestick shapes come with names and stories: buyers swallowed the sellers, price was bought up from below.
But engulfing is decided by whether this open lies inside the previous close — and the median distance between those two is 0.1111 of the spread. The share where it is exactly zero has a median of 1.3732%, reaching 10.2127% for USDJPY.
Whether anything was swallowed is decided by the sign of a quantity an order of magnitude below the width at which one can transact.
The frequency moves by a median of 1.1745 times from changing the bar size alone, with pin bars more frequent on fine bars and inside bars more frequent on coarse ones. Since the direction reverses between shapes, the market cannot explain it.
And the ratio against a synthetic random walk departs systematically by shape, from 0.4986 to 1.6656, with 0 of 16 cells falling between 0.8 and 1.25. The departure for engulfing is explained by how the baseline is built; the departures for inside bars and pin bars are not explained.
★ This paper does not conclude that the shapes appear as often as on a random walk. What it can conclude is that the frequency depends strongly on both the cut and the construction of the baseline.
The directional information reaches a daily t of 2 in absolute value in 2 of 16 cells (chance gives 0.7), and changing the bar size moves the median D from −1.4472 to +0.5823 pips, sign included. "This shape works" means nothing without stating the bar size.
Data and reproduction
| Data | Currency ticks from Dukascopy (agreement to the millisecond, bid and ask, verified from 2019 onward). Gold from Dukascopy |
| Period | 2019–2024 (six years). Evaluation 2022–2024 |
| Instruments | USDJPY, EURUSD, GBPUSD, XAUUSD |
| Bars | Five-minute, one-hour and four-hour. Mid price, completed bars only. Bars with no ticks are not created |
| Shapes | Engulfing, inside bar, pin bar (2.0 and 0.5), doji (10%) |
| Verification | 検算/F020.py (with --zu it also writes the figures). Every number in the text is taken from 検算/F020_output.txt |
| Figures | 図/F020_zu1, 図/F020_zu2 (png, svg, English versions) |
| Random seeds | Fixed at 0–9. Re-running gives the same values |
| Audit of the foundation | _ツール/audit_bars.py (look-ahead in the bars, daylight saving, the day boundary). The record is _土台の検査.txt |
References
- Yamagishi, Y. (2026). Chart Patterns Appear Just as Often on a Synthetic Random Walk [F016]. Zenodo. 10.5281/zenodo.22891793
Reference
Yamagishi, Y. (2026). Candlestick Shapes Belong to the Way the Bars Were Cut [F020]. Zenodo.
DOI: 10.5281/zenodo.22891997
YOI: https://www.yamagishiyuuki.com/yoi/F020
ORCID: 0009-0006-8587-3450
PDF (English) · PDF (Japanese) · Date proof of the English PDF (OpenTimestamps .ots) · SHA256SUMS
The record page for this paper (in Japanese, with the PDFs in each language and the date proof): YOI F020. This paper is a preprint and has not been peer reviewed.