Abstract
This paper asks whether a cell picked by a sweep is better than a cell not picked — the answer is that it is not. It claims neither a new mathematical theorem nor a new law.
First, sweeping four families (moving-average cross, RSI, outside a band, high-low breakout) gives 168 cells per instrument. The best in the selection period (2019–2021) runs from 5.3241 to 19.1062 pips, which is 5.3519 to 18.4359 times the spread (Section 3).
Second, and this is the core of the paper, the rank correlation between the selection and evaluation periods is −0.5911, −0.3206, −0.0310 and +0.0136, with a median of −0.1758. Three of the four series are negative (Section 5).
Third, picking the best N cells in the selection period leaves them positive 0.0530 less often than all cells in the evaluation period, the median. They are lower in 10 of 16 combinations (Section 4).
Fourth, but the scatter is large. The difference ranges from −0.5298 to +0.3988: the top cell is positive 1.0000 of the time for USDJPY and 0.0000 for XAUUSD. Four instruments are not enough precision for this difference (Section 4).
Fifth, on a synthetic series known to carry zero directional information, the same difference has a median of +0.0001. The picked cells are lower in 8 of 16 combinations — exactly half (Section 6).
Sixth, ★ so "picking makes it worse" does not happen on a random walk. Only the measurement gives a negative median. But with four instruments and 16 combinations, that cannot be claimed as an effect (Section 6).
Scope of this paper (scope note): No new mathematical theorem and no new law is claimed — multiple comparisons, selection bias and random walks are all known. No particular product or proponent is discussed — no real course, author, or vendor is the subject here, and none is named. What is treated is the public procedure itself. Trading is not discussed — what is measured is directional information, not trading performance including commissions, fills and money management. The scope is intraday and a small number of instruments — four series, six years, one-hour bars. Monthly time-series momentum (dozens of markets, holding one to twelve months) is documented in the literature, and this paper does not contradict it. One sweep is fixed — four families and 168 cells. Other families or granularities give other figures (Section 7). The overlap is not removed — horizons of 6, 24 and 72 bars overlap (Section 7). Four instruments are not enough precision for the difference — this paper measured that and says so (Sections 4 and 6). No forecast is claimed. Relation to earlier papers: F013 showed that a nested sweep manufactures smoothness — this paper measures whether the ranking of a sweep carries across periods. What is added here is placing the picked cells beside all cells (the neutral baseline), reporting the rank correlation, and running the same sweep on a synthetic random walk.
1. Notation and the question
Trying every parameter and taking the setting that did well is a common procedure.
| Stage | What is done | What gets reported |
|---|---|---|
| Sweep | many settings are tried | the best setting |
| Selection | the good setting is taken | that setting's result |
| What this paper asks | is the picked cell better than the ones not picked |
Observation 1.1: "it was positive in the evaluation period too" says nothing on its own, because it does not say what share of all cells was positive.
Observation 1.2: the neutral baseline is all the cells. If picking carries no information, the picked cells are positive as often as all cells.
Observation 1.3: and one more thing can be measured: the correlation between the ranking in the selection period and the ranking in the evaluation period. If that correlation is not positive, the ranking did not carry.
Observation 1.4: ★ and the same sweep is run on a synthetic series known to carry zero directional information. What happens there is the thing to compare against.
Question: is a cell picked by a sweep better than a cell not picked?
2. Writing the quantity and the design in advance
Design (declared before running and unchanged at run time)
| Item | Decision |
|---|---|
| Lattice | one-hour bars, mid price, completed bars only |
| Moving-average cross | fast 3, 5, 8, 12, 20, 30 × slow 20, 30, 50, 80, 120, 200 (fast < slow) |
| RSI | period 7, 14, 21 × threshold 20, 30, 40 (buy below, sell above) |
| Outside a band | period 10, 20, 40 × multiplier 1.5, 2.0, 2.5, 3.0 (against the move) |
| High-low breakout | period 10, 20, 50, 100 (with the move) |
| Horizon | 6, 24, 72 bars |
| Quantity picked on | the directional information in the selection period (pips) |
| Evaluation | the directional information in the evaluation period, placed beside the distribution over all cells |
| Baseline | synthetic series random down to the movement inside each bar (5 realisations) |
| Instruments | USDJPY, EURUSD, GBPUSD, XAUUSD |
| Period | 2019–2024. Selection 2019–2021, evaluation 2022–2024 |
Observation 2.1: every cell uses only quantities fixed when its bar completes. There is no look-ahead.
Observation 2.2: picking looks only at the selection period. The evaluation period is not used at all.
Observation 2.3: ★ how many of the best to pick is also varied, over 1, 3, 10 and 30. Trying only one would itself be a selection.
There are 174 cells per instrument, of which 168 could be measured in both periods.
3. The spread of the sweep — what happens in the selection period
Calculation 3.1 Distributions in the selection and evaluation periods (pips)
| Instrument | Cells | Selection best | Selection median | Selection worst | Positive in selection | Evaluation best | Evaluation median | Positive in evaluation |
|---|---|---|---|---|---|---|---|---|
| USDJPY | 168 | 5.3241 | −0.2574 | −13.1021 | 0.4345 | 18.7495 | 0.4842 | 0.6012 |
| EURUSD | 168 | 5.5308 | 0.4295 | −8.1885 | 0.6607 | 18.8020 | −0.1692 | 0.4167 |
| GBPUSD | 168 | 9.8301 | 0.4220 | −10.7220 | 0.6250 | 18.5241 | 0.5422 | 0.6429 |
| XAUUSD | 168 | 19.1062 | −0.8383 | −35.0928 | 0.4762 | 34.1058 | 0.5398 | 0.5298 |
Calculation 3.2 The best placed beside the spread
| Instrument | Selection best (pips) | Median spread | Best ÷ spread |
|---|---|---|---|
| USDJPY | 5.3241 | 0.6000 | 8.8736 |
| EURUSD | 5.5308 | 0.3000 | 18.4359 |
| GBPUSD | 9.8301 | 0.9000 | 10.9223 |
| XAUUSD | 19.1062 | 3.5700 | 5.3519 |
Observation 3.3: the best in the selection period is 5.3519 to 18.4359 times the spread. Shown that figure alone, a method looks good.
Observation 3.4: but the worst is just as large. For XAUUSD the best is 19.1062 against a worst of −35.0928 pips. A sweep makes an extreme on both sides.
Observation 3.5: the share positive in the selection period runs from 0.4345 to 0.6607. About half — not "nearly all positive".
Observation 3.6: the best in the evaluation period, 18.5241 to 34.1058 pips, is larger than in the selection period. ★ But that is "the cell that turned out best in evaluation", not the cell that was picked. A best seen afterwards must not be written up as a result that could have been obtained.
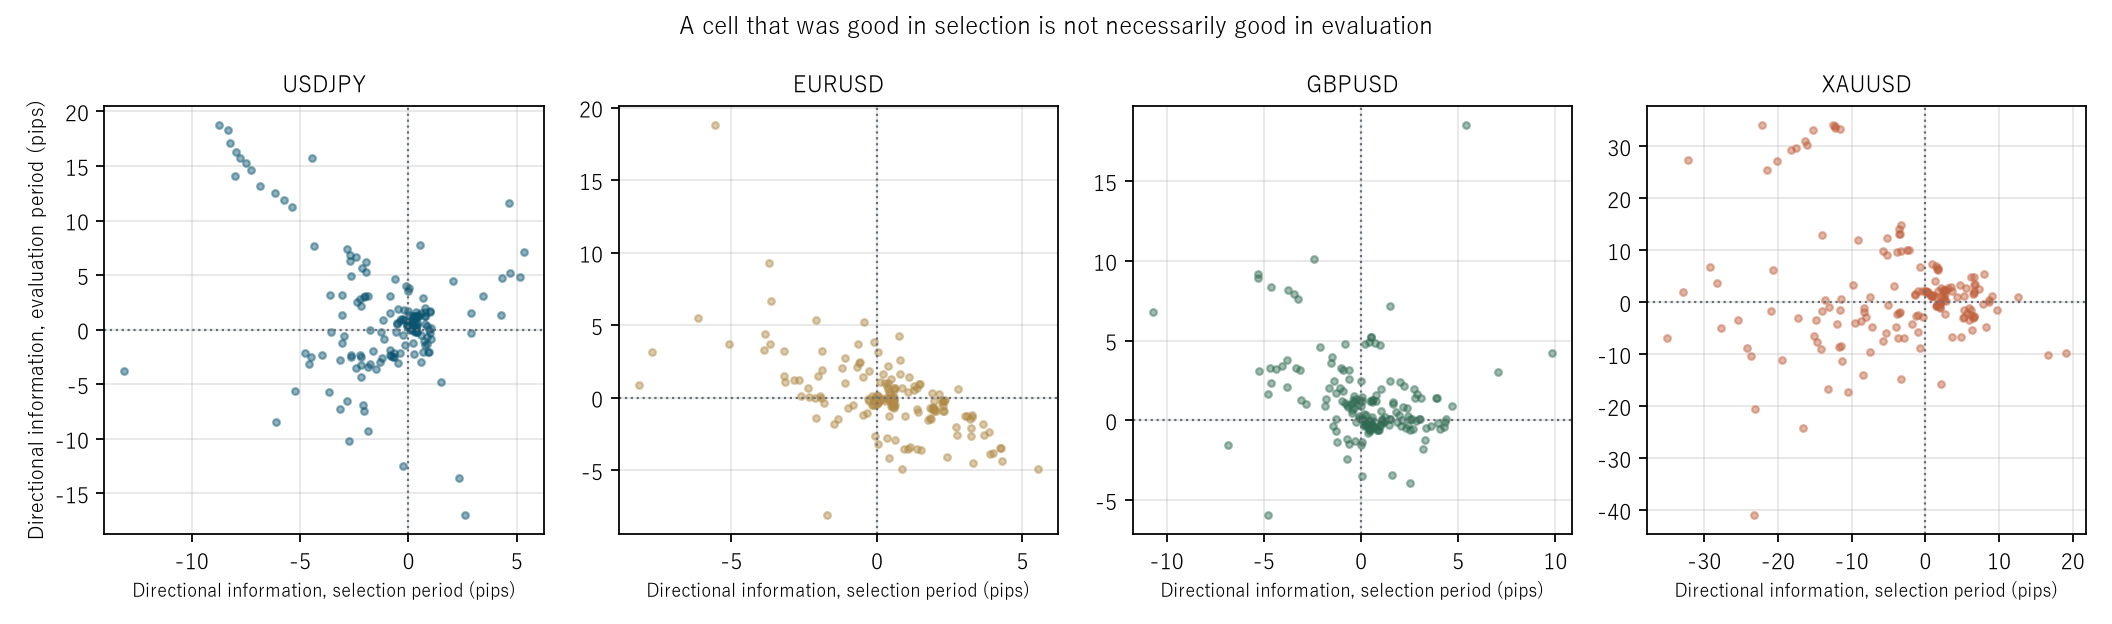
Figure 1: selection-period value across, evaluation-period value up, one panel per instrument. Clustering in the upper right would mean the ranking carried.
4. Are the picked cells better than all cells? — this is the separator
Calculation 4.1 Picked cells against all cells (evaluation period)
| Instrument | Top | Picked, evaluation median | All cells, evaluation median | Picked, share positive | All cells, share positive | Difference |
|---|---|---|---|---|---|---|
| USDJPY | 1 | 7.1199 | 0.4842 | 1.0000 | 0.6012 | +0.3988 |
| USDJPY | 3 | 5.2347 | 0.4842 | 1.0000 | 0.6012 | +0.3988 |
| USDJPY | 10 | 3.9129 | 0.4842 | 0.8000 | 0.6012 | +0.1988 |
| USDJPY | 30 | 0.8952 | 0.4842 | 0.6333 | 0.6012 | +0.0321 |
| EURUSD | 1 | −4.8903 | −0.1692 | 0.0000 | 0.4167 | −0.4167 |
| GBPUSD | 1 | 4.2564 | 0.5422 | 1.0000 | 0.6429 | +0.3571 |
| GBPUSD | 3 | 4.2564 | 0.5422 | 1.0000 | 0.6429 | +0.3571 |
| GBPUSD | 10 | 0.5152 | 0.5422 | 0.6000 | 0.6429 | −0.0429 |
| GBPUSD | 30 | 0.0866 | 0.5422 | 0.5667 | 0.6429 | −0.0762 |
| XAUUSD | 1 | −9.7164 | 0.5398 | 0.0000 | 0.5298 | −0.5298 |
| XAUUSD | 3 | −9.7164 | 0.5398 | 0.3333 | 0.5298 | −0.1964 |
| XAUUSD | 10 | −0.1171 | 0.5398 | 0.5000 | 0.5298 | −0.0298 |
| XAUUSD | 30 | −0.7496 | 0.5398 | 0.4667 | 0.5298 | −0.0631 |
Observation 4.2: the median difference in share positive (picked minus all) is −0.0530, ranging from −0.5298 to +0.3988. The picked cells are lower in 10 of 16 combinations.
Observation 4.3: the median difference in the evaluation median is −0.5562 pips, ranging from −10.2562 to +6.6357 pips.
Observation 4.4: ★ the scatter is large. The top cell is positive 1.0000 of the time for USDJPY and 0.0000 for XAUUSD. The same procedure gives opposite results in different instruments.
Observation 4.5: the wider the top taken, the smaller the difference. For USDJPY it is +0.3988 at the top 1 and +0.0321 at the top 30. ★ Taking a wide top approaches not picking at all.
Observation 4.6: ★ so "picking makes it worse" cannot be asserted. With four instruments and 16 combinations there is not enough precision for this difference. This paper measured that and says so.
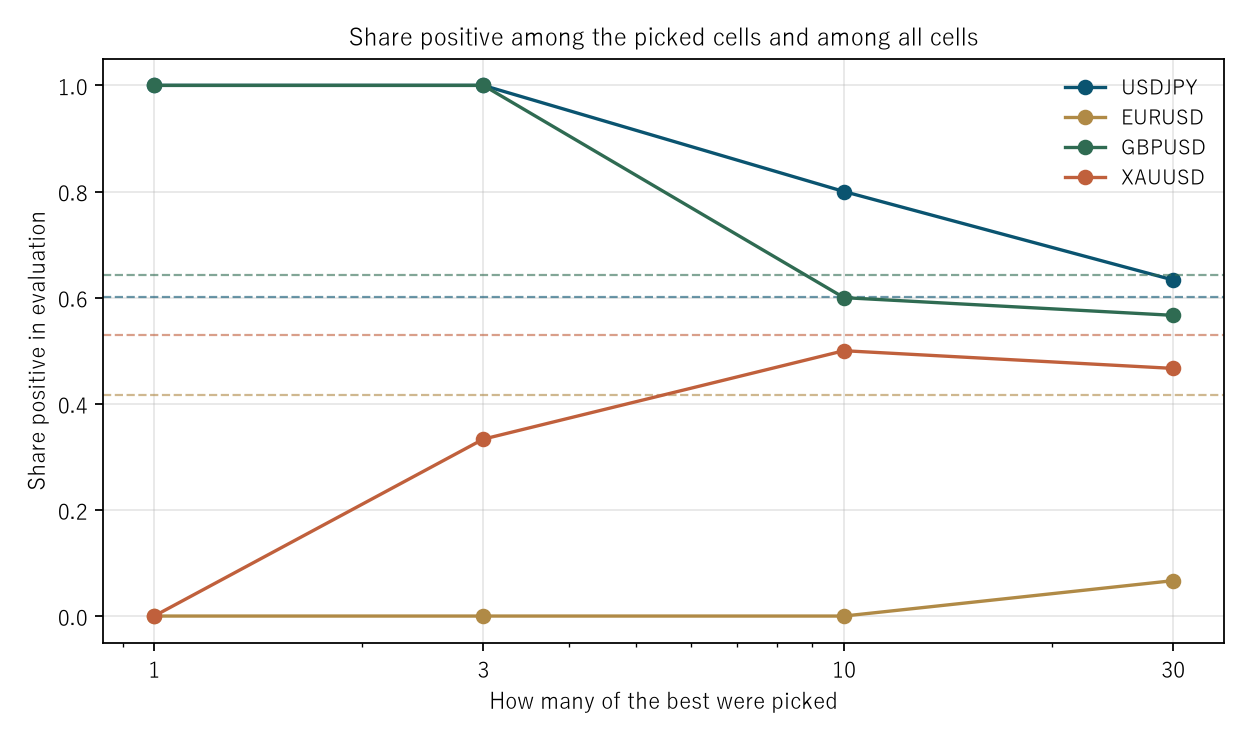
Figure 2: how many of the best were picked across, share positive in evaluation up. The dashed line is the share over all cells.
5. Does the selection-period ranking carry into the evaluation period?
Calculation 5.1 Rank correlation and the top 16% (evaluation period)
| Instrument | Rank correlation | Plain correlation | Top 16% of selection, evaluation median | All cells, evaluation median |
|---|---|---|---|---|
| USDJPY | −0.0310 | −0.3494 | 0.2453 | 0.4842 |
| EURUSD | −0.5911 | −0.5978 | −2.0566 | −0.1692 |
| GBPUSD | −0.3206 | −0.2488 | 0.0837 | 0.5422 |
| XAUUSD | 0.0136 | −0.1410 | −0.1171 | 0.5398 |
Observation 5.2: ★ the median rank correlation is −0.1758, ranging from −0.5911 to +0.0136. Three of the four series are negative.
Observation 5.3: the median plain correlation is −0.2991, and all four series are negative.
Observation 5.4: ★ a correlation that is not positive means the ranking did not carry. The relation "good in selection, therefore good in evaluation" is not there.
Observation 5.5: the evaluation median of the top 16% falls below the median over all cells in all four series (0.2453 against 0.4842, −2.0566 against −0.1692, 0.0837 against 0.5422, −0.1171 against 0.5398).
Observation 5.6: that appears to conflict with the top 1 and top 3 of Section 4. The top 16% (about 27 cells) is wider than the top 1, so taking a wider top pushes the difference negative. ★ Which "top" is reported changes the direction of the conclusion. That is why four were tried.
6. The baseline — the same sweep on a series known to carry no edge
Calculation 6.1 The sweep on synthetic series (5 realisations, evaluation period)
| Instrument | Top | Random walk, picked median | Random walk, all cells median | Random walk, difference in share positive | Measured difference |
|---|---|---|---|---|---|
| USDJPY | 1 | −6.5417 | −0.6030 | +0.2349 | +0.3988 |
| USDJPY | 3 | 0.6440 | −0.6030 | +0.1015 | +0.3988 |
| USDJPY | 10 | −2.4387 | −0.6030 | −0.0851 | +0.1988 |
| USDJPY | 30 | −0.6390 | −0.6030 | −0.0051 | +0.0321 |
| EURUSD | 1 | −4.4730 | −0.4036 | +0.2349 | −0.4167 |
| EURUSD | 30 | −0.4234 | −0.4036 | +0.0015 | −0.3500 |
| GBPUSD | 1 | −6.4599 | −0.5870 | +0.2386 | +0.3571 |
| GBPUSD | 10 | −2.3798 | −0.5870 | −0.0814 | −0.0429 |
| XAUUSD | 1 | −23.5287 | −0.9754 | −0.0027 | −0.5298 |
| XAUUSD | 3 | 6.6510 | −0.9754 | −0.0694 | −0.1964 |
| XAUUSD | 10 | −1.5870 | −0.9754 | −0.0027 | −0.0298 |
| XAUUSD | 30 | −1.0973 | −0.9754 | +0.0240 | −0.0631 |
Observation 6.2: ★ the median difference in share positive on the synthetic series is +0.0001 — almost exactly zero.
Observation 6.3: the picked cells are lower in 8 of 16 combinations on the synthetic series. Exactly half, which confirms that picking is neutral there.
Observation 6.4: ★ so "picking makes it worse" is not a property of picking itself. On a random walk it is neutral. Only the measurement gives a median of −0.0530.
Observation 6.5: this paper does not identify the reason. That the market's character changed between 2019–2021 and 2022–2024 is a possible reading, but it was not measured.
Observation 6.6: on the synthetic series the top 1 evaluates at −4.4730 to −23.5287 pips, strongly negative. ★ That is the signature of the top 1 being an extreme, and extremes return toward the middle in the evaluation period.
7. Limitations
- ★ One sweep is fixed, four families and 168 cells. Other families or granularities give other figures. The rank correlation of Section 5, however, answers the question "does the ranking carry" rather than depending on how the cells were made.
- ★ Four instruments are not enough precision for the difference. The share-positive difference ranges from −0.5298 to +0.3988, and the median of −0.0530 sits inside that range. This paper does not assert that picking makes things worse.
- The overlap is not removed. Horizons of 6, 24 and 72 bars overlap. No t value is reported, so significance is not discussed.
- Why the measurement gives a negative median is not identified. A change in the market's character between periods is a possible reading, but it was not measured.
- Only four sizes of "top" are used, 1, 3, 10 and 30. Reporting only one would itself be a selection.
- The synthetic baseline uses independent normal increments. Volatility clustering is not included.
- Four instruments over six years. Nothing is said about other markets or other periods.
Conclusion
Sweeping 168 cells, the best in the selection period reaches 5.3519 to 18.4359 times the spread. Shown that figure alone, a method looks good.
But the rank correlation between the selection and evaluation periods is −0.5911, −0.3206, −0.0310 and +0.0136 — a median of −0.1758, negative in three of four series. The plain correlation is negative in all four (median −0.2991).
The ranking did not carry across periods.
The picked cells are positive 0.0530 less often than all cells at the median, and lower in 10 of 16 combinations. But the range runs from −0.5298 to +0.3988: the top cell is positive 1.0000 of the time for USDJPY and 0.0000 for XAUUSD. Four instruments are not enough precision for this difference.
And on a synthetic series known to carry zero directional information, the same difference has a median of +0.0001 and the picked cells are lower in 8 of 16 combinations. ★ Picking itself is neutral.
★ So what a reported sweep best needs beside it is the distribution over all cells and the rank correlation. Without both, the best value is only a record that a sweep was run.
Data and reproduction
| Data | Currency ticks from Dukascopy (agreement to the millisecond, bid and ask, verified from 2019 onward). Gold from Dukascopy |
| Period | 2019–2024 (six years). Selection 2019–2021, evaluation 2022–2024 |
| Instruments | USDJPY, EURUSD, GBPUSD, XAUUSD |
| Bars | One-hour, mid price, closing value of completed bars only. Bars with no ticks are not created |
| Sweep | Moving-average cross, RSI, outside a band, high-low breakout × horizons of 6, 24 and 72 bars. 174 cells per instrument |
| Verification | 検算/F021.py (with --zu it also writes the figures). Every number in the text is taken from 検算/F021_output.txt |
| Figures | 図/F021_zu1, 図/F021_zu2 (png, svg, English versions) |
| Random seeds | Fixed at 0–4. Re-running gives the same values |
| Audit of the foundation | _ツール/audit_bars.py (look-ahead in the bars, daylight saving, the day boundary). The record is _土台の検査.txt |
References
- Yamagishi, Y. (2026). A Sweep over Thresholds Cannot Produce a Plateau in Principle [F013]. Zenodo. 10.5281/zenodo.22891660
Reference
Yamagishi, Y. (2026). The Ranking of a Sweep Does Not Carry Across Periods [F021]. Zenodo.
DOI: 10.5281/zenodo.22892047
YOI: https://www.yamagishiyuuki.com/yoi/F021
ORCID: 0009-0006-8587-3450
PDF (English) · PDF (Japanese) · Date proof of the English PDF (OpenTimestamps .ots) · SHA256SUMS
The record page for this paper (in Japanese, with the PDFs in each language and the date proof): YOI F021. This paper is a preprint and has not been peer reviewed.