Abstract
What this paper asks is what the best value of a sweep is a function of — and the answer is: a function of how many cells were looked at. No new mathematical theorem and no new law is claimed.
First, the picking procedure is held fixed and only the number of cells looked at, k, is varied: 3, 10, 30, 100 and 168. The content is the same. All that differs is how many were looked at (Section 2).
Second, the best rises with k. From k=3 to all cells, the best in the selection period grows by 5.1170, 2.9004, 4.5394 and 5.4048 times, a median rise of 4.8282 times (Section 3).
Third, the shape of the rise matches σ√(2 ln k). The measurement divided by the prediction has a median of 0.6185 and a range of 0.2881 to 1.1547. That the ratio falls short of 1 can be read as the cells being nested and correlated, but this paper does not measure that (Section 4).
Fourth, on the measurement the evaluation value follows in some instruments and not in others. Its correlation with log(k) is +0.9809, −0.9985, +0.9689 and −0.9661. In two of four instruments, raising k also raises the evaluation value. This paper does not assert that the evaluation does not follow (Section 5).
Fifth, and this is the core. ★ Even on a synthetic random walk, where the directional information is zero by construction, the best rises with k — from 2.7114 to 22.5796 pips on the USDJPY series. And at the same time the evaluation value falls from −0.8605 to −6.5417 pips (Section 6).
Sixth, ★ the best value therefore does not measure whether anything is right. It rises with the number looked at even on a series that is right about nothing. What a report of a best value needs is the number of cells looked at (Section 6).
Scope of this paper: No new mathematical theorem and no new law is claimed — extreme-value statistics, multiple comparisons, selection bias and random walks are all known. No real course or its proponent is discussed — no real teaching material, author, or vendor is the subject here, and none is named; what is treated is the publicly known procedure itself. Trading is not discussed — what is measured is directional information, not trading performance including commissions, fills and money management. The scope is intraday and few instruments — four instruments, six years, one-hour bars. Monthly time-series momentum (dozens of markets, one to twelve month holds) is documented in the academic literature and is not contradicted here. One sweep is fixed — four families, 168 cells (Section 7). The correlation among cells is not measured — that the measurement falls short of the prediction is read as nesting, but not measured (Sections 4 and 7). The overlap is not removed — horizons of 6, 24 and 72 bars overlap, and no t value is reported (Section 7). The direction in the evaluation period splits by instrument — this paper measures that and writes it (Section 5). No forecast is claimed. Relation to earlier papers: F013 showed that a nested sweep manufactures smoothness and F021 that the ranking of a sweep does not carry across periods — this paper measures that the best value itself is a function of how many cells were looked at. What is added is holding the picking procedure fixed and varying only k, placing the rise next to σ√(2 ln k), and doing the same thing on a series with zero directional information.
1. Notation and the question
The result of a sweep is usually reported as the best value: "this setting took 5 pips".
| What gets reported | What does not |
|---|---|
| The value of the best cell | How many cells were looked at |
| That cell's parameters | The distribution over all cells |
| Whether it was positive in the evaluation period too | What share of all cells was positive |
Observation 1.1: The maximum of k cells rises with k. If cell values are independent with spread σ, the maximum rises roughly as σ·√(2 ln k). This is not a claim about content. It is the arithmetic of picking an extreme.
Observation 1.2: ★ So "the best was 5 pips" cannot be read on its own. A value picked from 3 and a value picked from 168 are different numbers.
Observation 1.3: The separator is the number of cells looked at. The picking procedure, the data, the periods and the instruments are all held fixed, and only how many were looked at is varied.
Observation 1.4: ★ And the same thing is done on a series with zero directional information by construction. If the best rises there too, the best value does not measure whether anything is right.
Question: what is the best value of a sweep a function of?
2. State the quantity and the design first
Prediction (written before running)
If cell values are independent with spread σ, the maximum of k rises as σ·√(2 ln k).
⇒ The best rises with the number of cells looked at, even with identical content.
⇒ And the evaluation value should not follow, since only an extreme is being picked.
Design (declared before running and not changed during it)
| Item | Decision |
|---|---|
| Grid | One-hour bars, mid prices, completed bars only |
| Moving-average cross | Fast 3, 5, 8, 12, 20, 30 × slow 20, 30, 50, 80, 120, 200 (fast < slow) |
| RSI | Period 7, 14, 21 × threshold 20, 30, 40 |
| Outside a band | Period 10, 20, 40 × multiplier 1.5, 2.0, 2.5, 3.0 |
| High-low breakout | Period 10, 20, 50, 100 |
| Horizon | 6, 24, 72 bars |
| Cells looked at, k | 3, 10, 30, 100 and all (168) |
| How drawn | Draw k at random, take the one best in the selection period. Mean of 200 draws |
| Baseline | Synthetic random walk down to within-bar movement (5 series) |
| Instruments | USDJPY, EURUSD, GBPUSD, XAUUSD |
| Period | 2019–2024. Selection 2019–2021 / evaluation 2022–2024 |
Observation 2.1: ★ The picking procedure does not depend on k. It is "draw k at random and take the one best in the selection period". All that differs is how many were looked at.
Observation 2.2: Picking is done looking only at the selection period. The evaluation period is never used.
Observation 2.3: The mean of 200 draws is taken. With a single draw, the draw itself becomes the luck.
The number of cells measurable in both periods is 168 per instrument. The standard deviation in the selection period is 2.7740, 2.1677, 2.5451 and 10.2396 pips.
3. Looking at more cells raises the best
Calculation 3.1 The best by k (selection period, pips)
| Instrument | k=3 | k=10 | k=30 | k=100 | k=168 | Median of all cells |
|---|---|---|---|---|---|---|
| USDJPY | 1.0405 | 2.3637 | 4.1075 | 5.1618 | 5.3241 | −0.2574 |
| EURUSD | 1.9069 | 3.3776 | 4.2271 | 4.9625 | 5.5308 | 0.4295 |
| GBPUSD | 2.1655 | 3.8643 | 5.6060 | 8.5480 | 9.8301 | 0.4220 |
| XAUUSD | 3.5350 | 8.1828 | 12.1794 | 17.4092 | 19.1062 | −0.8383 |
Calculation 3.2 The rise (from k=3 to all)
| Instrument | k=3 | All | Rise |
|---|---|---|---|
| USDJPY | 1.0405 | 5.3241 | 5.1170 times |
| EURUSD | 1.9069 | 5.5308 | 2.9004 times |
| GBPUSD | 2.1655 | 9.8301 | 4.5394 times |
| XAUUSD | 3.5350 | 19.1062 | 5.4048 times |
Observation 3.3: In all four instruments, the best rises as k rises. The median rise is 4.8282 times.
Observation 3.4: ★ The data is the same. Nothing about the content was changed. What was changed is only how many were looked at.
Observation 3.5: The median over all cells does not depend on k. It is −0.2574, 0.4295, 0.4220 and −0.8383. Only the extreme moves; the middle of the distribution does not.
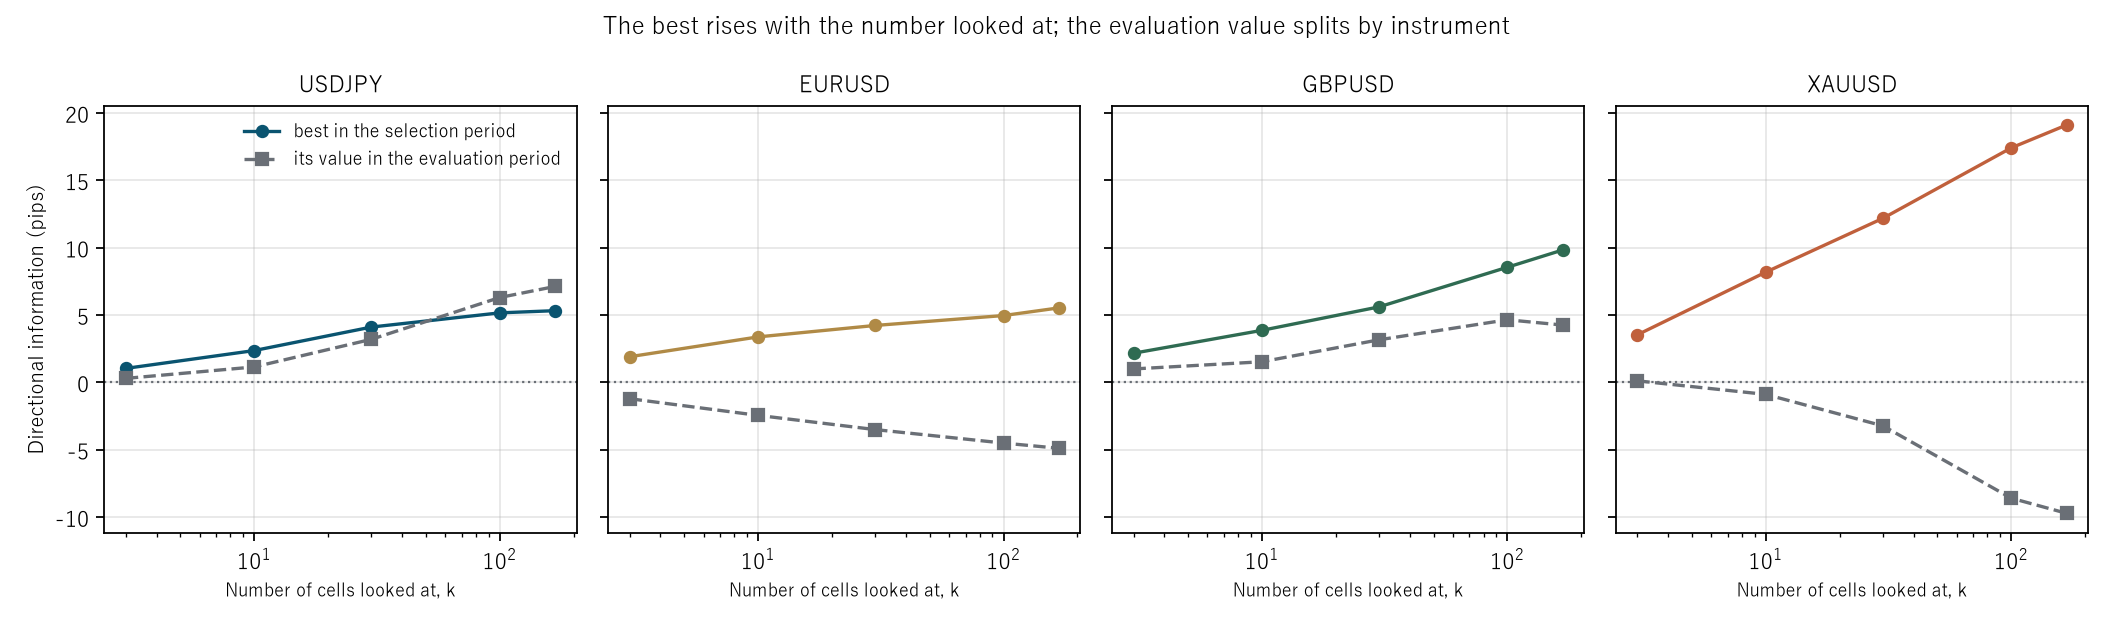
Figure 1: horizontal is the number of cells looked at, k (log scale), vertical is directional information. The solid line is the best in the selection period and the dashed line is that cell's value in the evaluation period.
4. Can the rise be explained by σ√(2 ln k)?
Calculation 4.1 Ratio against the prediction (selection period)
| Instrument | k | Best | Prediction σ√(2 ln k) | Measured ÷ predicted |
|---|---|---|---|---|
| USDJPY | 3 | 1.0405 | 3.8546 | 0.3156 |
| USDJPY | 168 | 5.3241 | 8.6229 | 0.6285 |
| EURUSD | 3 | 1.9069 | 3.6428 | 0.4598 |
| EURUSD | 168 | 5.5308 | 7.3690 | 0.7351 |
| GBPUSD | 3 | 2.1655 | 4.1946 | 0.4621 |
| GBPUSD | 168 | 9.8301 | 8.5695 | 1.1547 |
| XAUUSD | 3 | 3.5350 | 14.3399 | 0.2881 |
| XAUUSD | 168 | 19.1062 | 31.9410 | 0.6084 |
Observation 4.2: The median ratio is 0.6185 and the range is 0.2881 to 1.1547. If the ratio does not depend on k, the rise can be explained by the picking alone.
Observation 4.3: The ratio rises somewhat with k (0.3156 to 0.6285 for USDJPY). The prediction assumes independence, but the cells are nested and correlated. Fast 5 / slow 20 and fast 5 / slow 30 emit nearly the same signal.
Observation 4.4: ★ This paper does not measure the correlation among cells. "The ratio falls short of 1 because of nesting" is a reading, not a measured result.
Observation 4.5: Only GBPUSD at k=168 exceeds 1 (1.1547). The prediction is a guide, not a bound that holds strictly.
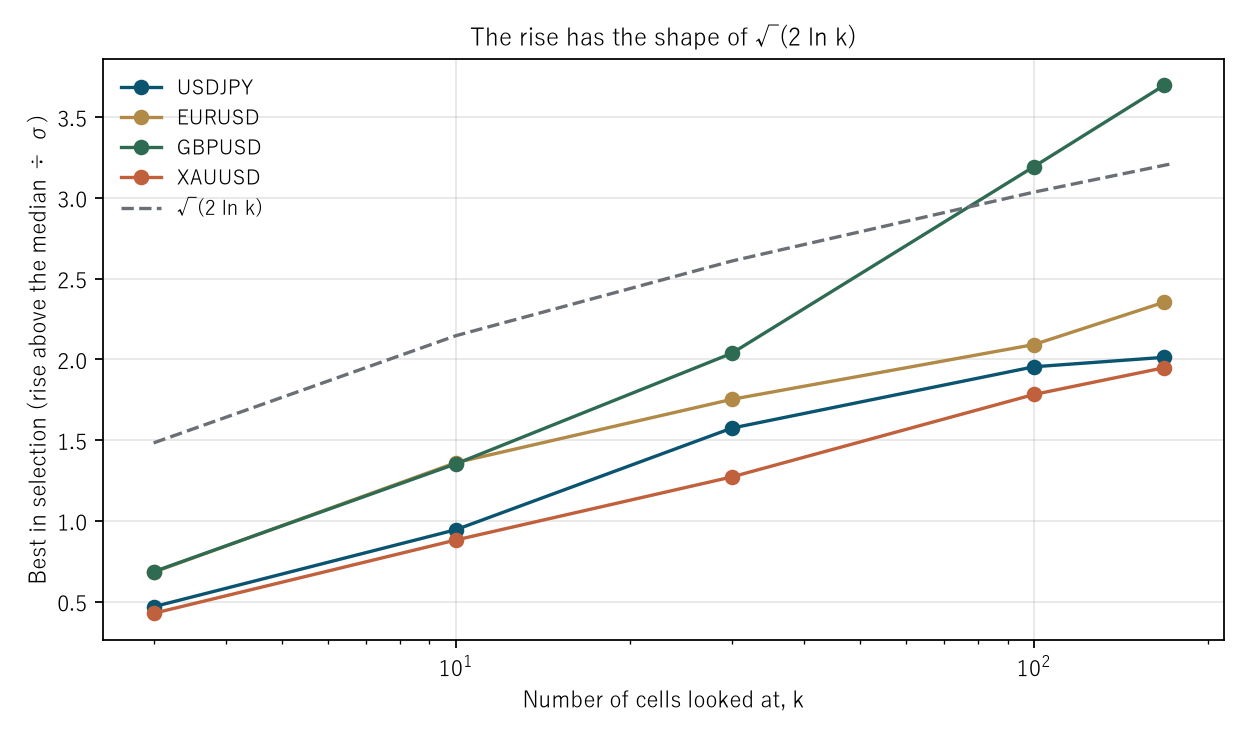
Figure 2: horizontal is k (log scale), vertical is "how far the best rose above the median ÷ σ". The dashed line is √(2 ln k).
5. Does the evaluation value follow?
Calculation 5.1 The evaluation value by k (pips)
| Instrument | k=3 | k=10 | k=30 | k=100 | k=168 | Correlation with log(k) |
|---|---|---|---|---|---|---|
| USDJPY | 0.2982 | 1.1476 | 3.1984 | 6.3015 | 7.1199 | +0.9809 |
| EURUSD | −1.2109 | −2.4470 | −3.5031 | −4.5043 | −4.8903 | −0.9985 |
| GBPUSD | 0.9990 | 1.5322 | 3.1620 | 4.6488 | 4.2564 | +0.9689 |
| XAUUSD | 0.1158 | −0.8897 | −3.2248 | −8.5932 | −9.7164 | −0.9661 |
Observation 5.2: ★ The prediction failed. It said "the evaluation value should not follow", but for USDJPY and GBPUSD it clearly rises with k (correlations +0.9809 and +0.9689).
Observation 5.3: And for EURUSD and XAUUSD it clearly falls with k (correlations −0.9985 and −0.9661). ★ The sign splits two and two across four instruments.
Observation 5.4: That every correlation is large in absolute value is merely because each is monotone. There are only five points, so anything monotone gives a correlation near 1. It must not be read as evidence of strength.
Observation 5.5: Across all 20 combinations the evaluation value has a median of +0.2070 pips and a range of −9.7164 to +7.1199 pips. The median spread is 0.7500 pips. The median falls below the spread.
Observation 5.6: ★ The measurement alone therefore does not close this question, because changing the instrument changes the direction. With four instruments, which of the two is the general property cannot be decided.
Observation 5.7: This is why the baseline of Section 6 is needed. If the measurement splits, the only recourse is to do the same thing on a series with zero directional information by construction and see what happens.
6. Baseline — do the same thing on a series with zero directional information
Calculation 6.1 The same sweep on a synthetic random walk (5 series)
| Instrument | k | Random best | Random evaluation | Measured best | Measured evaluation |
|---|---|---|---|---|---|
| USDJPY | 3 | 2.7114 | −0.8605 | 1.0405 | 0.2982 |
| USDJPY | 168 | 22.5796 | −6.5417 | 5.3241 | 7.1199 |
| EURUSD | 3 | 1.8510 | −0.5750 | 1.9069 | −1.2109 |
| EURUSD | 168 | 15.4395 | −4.4730 | 5.5308 | −4.8903 |
| GBPUSD | 3 | 2.6731 | −0.8338 | 2.1655 | 0.9990 |
| GBPUSD | 168 | 22.2976 | −6.4599 | 9.8301 | 4.2564 |
| XAUUSD | 3 | 7.8272 | −1.3267 | 3.5350 | 0.1158 |
| XAUUSD | 168 | 65.6702 | −23.5287 | 19.1062 | −9.7164 |
Observation 6.2: ★ Even on a series with zero directional information, the best rises with k — from 2.7114 to 22.5796 pips on the USDJPY series. The median best at k=3 is 2.6923 pips, so even on a series that is right about nothing, looking at just 3 cells produces several times the spread.
Observation 6.3: ★ And the evaluation value falls with k in all four, with a median of −1.9934 pips. The measurement split, and the random walk does not.
Observation 6.4: ★ This is the signature of picking an extreme. Since there is no information, being high in the selection period was luck. Luck does not carry into the evaluation period, so the further out the extreme, the further below the middle it lands in the evaluation period.
Observation 6.5: The random walk's best is larger than the measurement's (22.5796 against 5.3241 for USDJPY). ★ So "the best is large" is not evidence that anything is right. This paper does not identify the reason for the difference. That the measured cells are pulled by a common market and so are more correlated, while the random cells are less so, is a possible reading, but it was not measured.
Observation 6.6: ★ The conclusion follows from here. The best value measures not whether anything is right but how many cells were looked at. So a report of a best value must carry the number of cells looked at beside it.
7. Limitations
- ★ The second half of the prediction failed. It said "the evaluation value should not follow", and on the measurement it followed in two of four instruments. This paper writes that failure and does not hide it.
- ★ With four instruments the direction in the evaluation period cannot be decided. The sign splits two and two. This paper does not generalize "the evaluation does not follow".
- The correlation is computed on five points. Anything monotone gives an absolute value near 1. It is not evidence of strength.
- The correlation among cells is not measured. That the measurement falls short of σ√(2 ln k) is read as nesting, but not measured.
- One sweep is fixed. Four families and 168 cells. Other families or granularities give other figures.
- The overlap is not removed. Horizons are 6, 24 and 72 bars and the observations overlap. No t value is reported and significance is not discussed.
- The synthetic series uses independent normal increments. Volatility clustering is not included.
- Four instruments over six years. Nothing is said about other markets or other periods.
Conclusion
Holding the picking procedure fixed, only the number of cells looked at was varied from 3 to 168. The content is the same.
The best in the selection period grew by 5.1170, 2.9004, 4.5394 and 5.4048 times. The median rise is 4.8282 times, and its shape matches σ√(2 ln k) (median of measured ÷ predicted, 0.6185).
The best is a function of how many cells you looked at.
As for the evaluation value, the prediction written before measuring failed. On the measurement it rose with k for USDJPY and GBPUSD (correlations +0.9809 and +0.9689) and fell for EURUSD and XAUUSD (−0.9985 and −0.9661). With four instruments, which is the general property cannot be decided.
So look at the baseline. ★ Even on a synthetic random walk, where the directional information is zero by construction, the best rises from 2.7114 to 22.5796 pips. The median best at k=3 is 2.6923 pips, so looking at just 3 cells produces several times the spread. And the evaluation value falls in all four, with a median of −1.9934 pips.
★ The best value does not measure whether anything is right. It measures how many cells you looked at.
What a report of a sweep's best value therefore needs is the number of cells looked at. A best value without it cannot be read.
Data and reproduction
| Data | FX is Dukascopy-derived tick data (from 2019 onward, confirmed identical down to the millisecond, bid and ask). Gold is Dukascopy |
| Period | 2019–2024 (six years). Selection 2019–2021 / evaluation 2022–2024 |
| Instruments | USDJPY, EURUSD, GBPUSD, XAUUSD |
| Bars | One-hour bars, mid prices, closes of completed bars only. No bar is made where there are no ticks |
| Sweep | Moving-average cross, RSI, outside a band, high-low breakout × horizons of 6, 24 and 72 bars. 168 cells per instrument measurable in both periods |
| Draws | k = 3, 10, 30, 100 and all. 200 random draws at each k |
| Verification | 検算/F022.py (--zu also writes the figures). Every figure in the text comes from 検算/F022_output.txt |
| Figures | 図/F022_zu1, 図/F022_zu2 (png, svg, English versions) |
| Random seeds | Fixed. Re-running gives the same values |
| Foundation check | _ツール/audit_bars.py (bar look-ahead, daylight saving, day boundaries). The record is _土台の検査.txt |
References
- Yamagishi, Y. (2026). A Sweep over Thresholds Cannot Produce a Plateau in Principle [F013]. Zenodo. 10.5281/zenodo.22891660
- Yamagishi, Y. (2026). The Ranking of a Sweep Does Not Carry Across Periods [F021]. Zenodo. 10.5281/zenodo.22892047
Reference
Yamagishi, Y. (2026). The Best Value Is a Function of How Many Cells You Looked At [F022]. Zenodo.
DOI: 10.5281/zenodo.22892093
YOI: https://www.yamagishiyuuki.com/yoi/F022
ORCID: 0009-0006-8587-3450
PDF (English) · PDF (Japanese) · Date proof of the English PDF (OpenTimestamps .ots) · SHA256SUMS
The record page for this paper (in Japanese, with the PDFs in each language and the date proof): YOI F022. This paper is a preprint and has not been peer reviewed.