Abstract
What this paper asks is what moves and what does not when the stopping rule is changed — and the answer is: the shape of the profit and loss moves and the direction does not. No new mathematical theorem and no new law is claimed.
First, the shape changes completely. Across twenty stopping rules the win rate runs from 0.0562 to 0.9443 (a spread of 0.8881), the median from −40.0000 to +40.0000 pips (a spread of 80.0000) and the skewness from −8.4093 to +8.4366 (a spread of 16.8459) (Section 3).
Second, the correlation between win rate and skewness is −0.9345. The higher the win rate, the more negative the skewness — many small wins and a few large losses. ★ The win rate measures the shape, not whether anything is good (Section 5).
Third, and this is the core. ★ The shape moves just as much on a synthetic random walk with zero directional information. The win-rate correlation is +0.9922 and the median difference −0.0056 (range −0.0550 to +0.0570). The shape is a property of the stopping rule, not of the market (Section 6).
Fourth, the classification in prediction ②, written before measuring, failed. It said that "for a symmetric stopping rule the mean of the buy and the sell, M, is identically 0", but that holds only for rules with no barriers (exactly 0.000000, 12 cells) (Section 4).
Fifth, ★ for fixed take-profit = stop-loss, M matches −(ambiguous share × barrier) exactly. The difference is 0.0000 pips across 8 cells. The negative M is not the market; it is precisely the effect of resolving ambiguous bars adverse-first (Section 4).
Sixth, and one identity was found after measuring. The M of "take-profit only" and the M of "stop-loss only" are equal in magnitude and opposite in sign, differing by 0.000000 pips. ★ That is an identity, not a test (Section 4).
Scope of this paper: No new mathematical theorem and no new law is claimed — optional stopping, the triple-barrier method, trailing stops and random walks are all known. No real course or its proponent is discussed — no real teaching material, author, or vendor is the subject here, and none is named. Trading is not discussed — no costs are included, so the figures here are not trading performance (Section 7). Direction and drift both sit in D — the expected value of the buy alone runs from −4.3840 to +27.4471 pips, mostly drift over the period (Section 4). The scope is intraday and few instruments — four instruments, six years, one-hour bars. Monthly time-series momentum (dozens of markets, one to twelve month holds) is documented in the academic literature and is not contradicted here. Ambiguous bars are resolved adverse-first — as F025 measured, that convention must be declared or the result cannot be read (Sections 2 and 4). The trail updates only up to the previous bar — a convention that avoids assuming the order inside a bar; another convention gives other figures (Section 7). The overlap is not removed — entries are taken on every bar, so the observations overlap, and no t value is reported (Section 7). No forecast is claimed. Relation to earlier papers: F012 showed that forty-nine placements of take-profit and stop-loss do not move the expected value, and F025 that the treatment of an ambiguous bar makes the win rate and the expected value — this paper widens the stopping rule to twenty and separates shape from direction. What is added is running both the buy and the sell to split M from D, tracing the part of M that is not 0 to the convention, and doing the same thing on a series with zero directional information.
1. Notation and the question
"Cut losses short and let profits run", "move the stop to breakeven", "trail it out". Every one of them is a rule about when to exit, not about which way to enter.
| What gets reported | What does not |
|---|---|
| The win rate and profit under that stopping rule | What another stopping rule on the same entries would give |
| The reward-to-risk ratio | What running both the buy and the sell would give |
| The shape of the equity curve | Whether a series with no edge gives the same shape |
Observation 1.1: A stopping rule decides only when to exit. It does not change the direction of the entry. ★ So it cannot add directional information in principle.
Observation 1.2: ★ Direction can be separated from everything else by running both the buy and the sell from the same entry. M = (buy + sell) / 2 removes the directional effect, while D = (buy − sell) / 2 carries the direction and the drift.
Observation 1.3: The separator is when to exit. The entries, the data, the period and the instruments are all held fixed, and only the stopping rule is varied.
Observation 1.4: ★ And a comparison partner is needed. Run the same twenty rules on a series with zero directional information by construction and see whether the shape moves just as much.
Question: what moves and what does not when the stopping rule is changed?
2. State the quantity and the design first
Predictions (written before running)
① The win rate, the median, the skewness, the worst and the best move a long way with the stopping rule.
② M = (buy + sell) / 2 is 0 with no costs. But for a symmetric stopping rule it is identically 0 (the paths cancel). For an asymmetric rule it is not an identity, so that is where the test lies.
③ ★ A synthetic random walk with zero directional information lands in the same band.
④ D = (buy − sell) / 2 picks up the drift and may move with the stopping rule.
Design (declared before running and not changed during it)
| Item | Decision |
|---|---|
| Entry | Close of a one-hour bar, on every bar. Both the buy and the sell |
| Deadline | 24 bars (one day). Untouched is closed at the deadline's close |
| Fixed | Take-profit/stop-loss = (10,10) (20,20) (20,10) (10,20), 4 rules |
| Trailing | Exit 5, 10, 20, 40 pips below the running maximum (4 rules) |
| Breakeven | Stop-loss 20 pips; move it to breakeven after 5, 10, 20 pips (3 rules) |
| Time only | Exit after 6, 24, 72 bars (no barriers, 3 rules) |
| Take-profit only | 10, 20, 40 pips (no stop, to the deadline, 3 rules) |
| Stop-loss only | 10, 20, 40 pips (no target, to the deadline, 3 rules) |
| Ambiguous bars | Resolved adverse-first. ★ As F025 showed, this must be declared |
| Trailing | The running maximum updates only up to the previous bar |
| Costs | Not included |
| Baseline | Synthetic random walk down to within-bar movement (3 series) |
| Instruments | USDJPY, EURUSD, GBPUSD, XAUUSD |
| Period | 2019–2024 |
Observation 2.1: ★ All twenty run from the same entries. All that differs is when to exit.
Observation 2.2: The sell is produced by running a buy on bars turned upside down. That makes the conventions identical on both sides.
Observation 2.3: Costs are left out to make the theoretical value plain. ★ The synthetic series has no drift, so there the expected value of the buy alone is theoretically 0.
The bar counts are 36,534, 36,554, 36,535 and 34,892.
3. The shape moves a long way with the stopping rule
Calculation 3.1 Shape (USDJPY, buys)
| Rule | Win rate | Median | Skewness | Worst | Best | Median hold |
|---|---|---|---|---|---|---|
| Fixed 10/10 | 0.4636 | −10.0000 | 0.1462 | −10.00 | 10.00 | 2.0 |
| Fixed 10/20 | 0.6403 | 10.0000 | −0.6011 | −20.00 | 10.00 | 2.0 |
| Trail 5 | 0.3483 | −5.0000 | 4.3259 | −5.00 | 231.80 | 1.0 |
| Trail 40 | 0.4347 | −6.2500 | 1.8764 | −40.00 | 369.90 | 14.0 |
| Breakeven 5/SL20 | 0.1076 | 0.0000 | 4.4808 | −20.00 | 387.10 | 3.0 |
| Time 24 | 0.5469 | 4.9000 | −0.8285 | −702.30 | 387.10 | 24.0 |
| Time 72 | 0.5547 | 11.7500 | −0.8244 | −1021.45 | 542.65 | 72.0 |
| Take-profit only 10 | 0.8325 | 10.0000 | −5.8006 | −702.30 | 10.00 | 4.0 |
| Stop-loss only 10 | 0.1920 | −10.0000 | 3.9576 | −10.00 | 377.90 | 4.0 |
Observation 3.2: Prediction ① held. Across twenty rules and four instruments the win rate runs from 0.0562 to 0.9443 (a spread of 0.8881), the median from −40.0000 to +40.0000 pips (a spread of 80.0000) and the skewness from −8.4093 to +8.4366 (a spread of 16.8459).
Observation 3.3: "Take-profit only 10" on USDJPY has a win rate of 0.8325. ★ Leave the stop out and the win rate can be raised. But the worst is −702.30 pips, and that does not appear in the win rate.
Observation 3.4: "Breakeven 5/SL20" on the same USDJPY has a win rate of 0.1076. ★ Moving the stop to breakeven produces a mass of trades at exactly 0, so the "wins" fall. The median is 0.0000 too.
Observation 3.5: ★ The entries and the data are the same. Only when to exit was changed, and the win rate runs from 0.1076 to 0.8325 and the best from 10.00 to 542.65 pips.
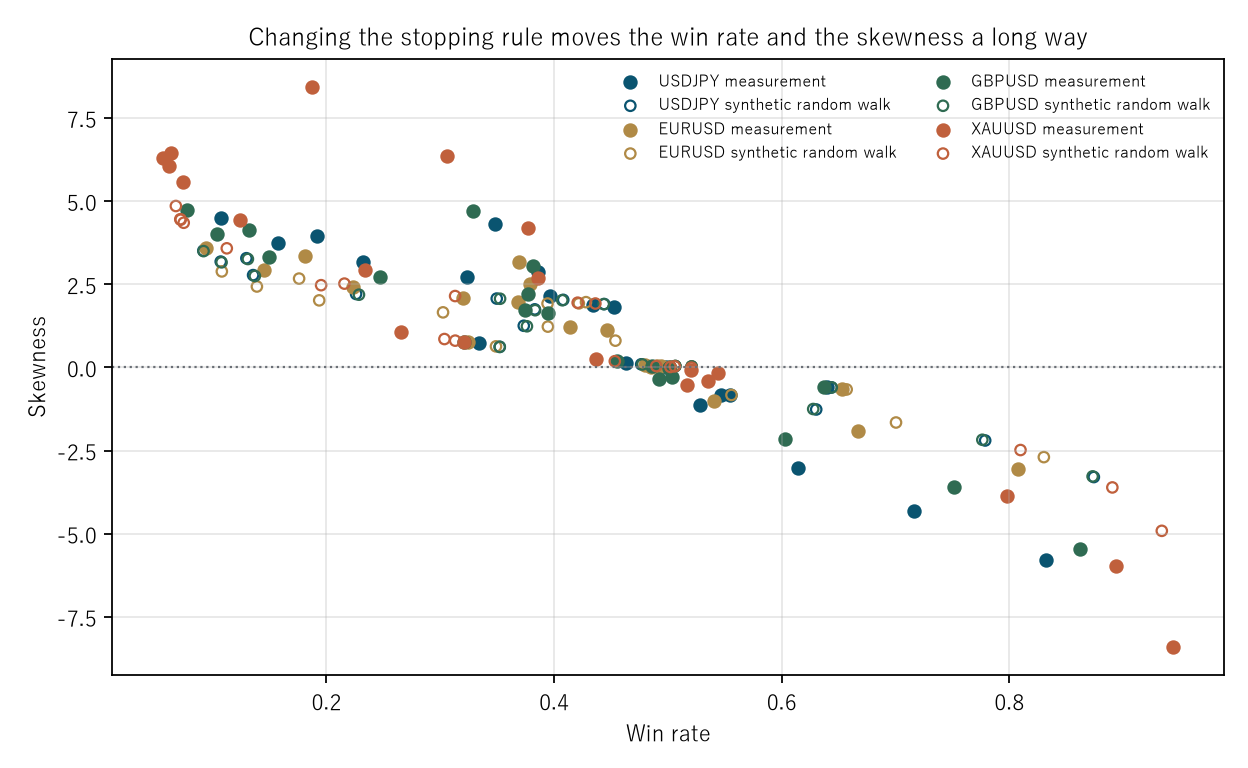
Figure 1: horizontal is the win rate, vertical is the skewness. Filled markers are the measurement, open markers the synthetic random walk; each point is one of the twenty rules.
4. Does the expected value move? — M = (buy + sell) / 2
Calculation 4.1 M by stopping rule (pips)
| Rule | Declared symmetric? | USDJPY | EURUSD | GBPUSD | XAUUSD |
|---|---|---|---|---|---|
| Fixed 10/10 | yes | −0.725139 | −0.393619 | −0.864438 | −3.597932 |
| Fixed 20/20 | yes | −0.373540 | −0.232443 | −0.360365 | −2.650201 |
| Fixed 20/10 | no | −0.194242 | −0.256804 | −0.274746 | −2.074813 |
| Trail 5 | yes | 1.038890 | 0.599239 | 0.945928 | 1.921923 |
| Breakeven 5/SL20 | no | 1.500037 | 0.602420 | 0.894338 | 1.543841 |
| Time 6 | yes | 0.000000 | 0.000000 | 0.000000 | 0.000000 |
| Time 24 | yes | 0.000000 | 0.000000 | 0.000000 | 0.000000 |
| Time 72 | yes | 0.000000 | 0.000000 | 0.000000 | 0.000000 |
| Take-profit only 10 | no | −1.229658 | 0.055478 | −0.154499 | −0.886441 |
| Stop-loss only 10 | no | 1.229658 | −0.055478 | 0.154499 | 0.886441 |
Calculation 4.2 For fixed take-profit = stop-loss, M is the effect of the convention itself
| Instrument | Rule | Ambiguous share | −share × barrier | Measured M | Difference |
|---|---|---|---|---|---|
| USDJPY | Fixed 10/10 | 0.0725 | −0.7251 | −0.7251 | 0.0000 |
| USDJPY | Fixed 20/20 | 0.0187 | −0.3735 | −0.3735 | 0.0000 |
| EURUSD | Fixed 10/10 | 0.0394 | −0.3936 | −0.3936 | 0.0000 |
| EURUSD | Fixed 20/20 | 0.0116 | −0.2324 | −0.2324 | 0.0000 |
| GBPUSD | Fixed 10/10 | 0.0864 | −0.8644 | −0.8644 | −0.0000 |
| GBPUSD | Fixed 20/20 | 0.0180 | −0.3604 | −0.3604 | 0.0000 |
| XAUUSD | Fixed 10/10 | 0.3598 | −3.5979 | −3.5979 | −0.0000 |
| XAUUSD | Fixed 20/20 | 0.1325 | −2.6502 | −2.6502 | −0.0000 |
Observation 4.3: ★ The classification in prediction ② failed outright. It said "for a symmetric rule M is identically 0", but across the 36 rules declared symmetric the largest absolute M is 3.597932 pips. They are reclassified into three groups after measuring.
Observation 4.4: ★ ① For rules with no barriers, M is exactly 0. All 12 "time only" cells give 0.000000. The buy and the sell cancel path by path, so this is an identity.
Observation 4.5: ★ ② For fixed take-profit = stop-loss, M matches −(ambiguous share × barrier) exactly. All 8 cells differ by 0.0000 pips. The negative M is not the market; it is precisely the result of resolving ambiguous bars adverse-first, which puts a loss on both sides.
Observation 4.6: ③ The remaining 60 cells do not cancel. M has a median of +0.3573 pips and a range of −4.4154 to +2.1625. ★ Declaring the trail and the breakeven move "symmetric" was wrong: the buy trails down from its maximum and the sell trails up from its minimum, so they do not cancel path by path.
Observation 4.7: ★ And one identity was found after measuring. The M of "take-profit only" and the M of "stop-loss only" are equal in magnitude and opposite in sign, differing by 0.000000 pips, because the sell's take-profit-only is the buy's stop-loss-only with the sign flipped. ★ That is not a test.
Observation 4.8: The expected value of the buy alone, meanwhile, runs from −4.3840 to +27.4471 pips. ★ But most of that is drift: D = (buy − sell) / 2 spans −1.9414 to +27.4471 pips, the same width. "Time 72" on XAUUSD reaches +27.4471 because gold rose over three days in that period.
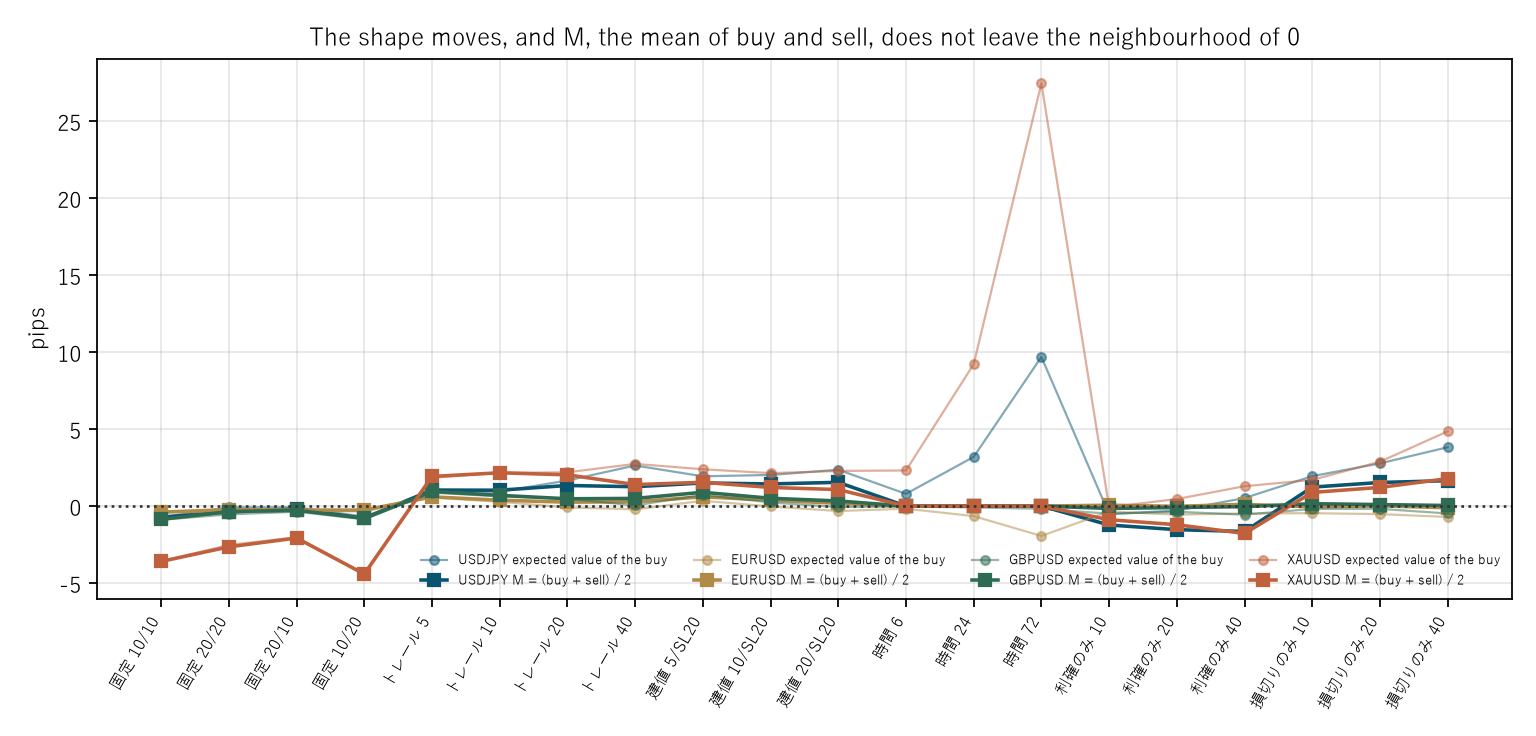
Figure 2: horizontal is the twenty stopping rules, vertical is pips. The faint lines are the expected value of the buy, the bold lines are M, and the dotted line is 0.
5. What shape does a high win rate have?
Calculation 5.1 Medians across four instruments (twenty rules)
| Rule | Win rate | Median | Skewness | M |
|---|---|---|---|---|
| Fixed 10/10 | 0.4595 | −10.0000 | 0.1625 | −0.794788 |
| Fixed 10/20 | 0.6390 | 10.0000 | −0.5873 | −0.794165 |
| Trail 5 | 0.3387 | −5.0000 | 4.5125 | 0.992409 |
| Trail 40 | 0.4003 | −10.1138 | 1.8067 | 0.877153 |
| Breakeven 5/SL20 | 0.0858 | 0.0000 | 4.6119 | 1.197188 |
| Time 24 | 0.5194 | 2.7000 | −0.3559 | 0.000000 |
| Take-profit only 10 | 0.8475 | 10.0000 | −5.6229 | −0.520470 |
| Take-profit only 40 | 0.6087 | 27.5750 | −2.5854 | −0.843513 |
| Stop-loss only 10 | 0.1569 | −10.0000 | 4.0411 | 0.520470 |
| Stop-loss only 40 | 0.4205 | −23.3750 | 1.7241 | 0.843513 |
Observation 5.2: ★ The correlation between win rate and skewness is −0.9345. The higher the win rate, the more negative the skewness: many small wins and a few large losses.
Observation 5.3: The correlation between win rate and median is +0.5797. A high win rate does not imply a high median. "Breakeven 5/SL20" has a win rate of 0.0858 and a median of 0.0000.
Observation 5.4: ★ The win rate therefore measures the shape, not whether anything is good. "An 84% win rate" and "a 9% win rate" can be made from the same entries on the same data.
Observation 5.5: And however far the win rate moves, M stays between −0.794788 and +1.197188 (including the part explained by the three groups of Section 4). The directional side did not move.
6. Baseline — do the same thing on a series with zero directional information
Calculation 6.1 Measurement against synthetic random walk (medians across four instruments)
| Rule | Measured win | Random win | Measured skew | Random skew | Measured M | Random M |
|---|---|---|---|---|---|---|
| Fixed 10/10 | 0.4595 | 0.4771 | 0.1625 | 0.0917 | −0.794788 | −0.453480 |
| Fixed 10/20 | 0.6390 | 0.6439 | −0.5873 | −0.6013 | −0.794165 | −0.738910 |
| Trail 5 | 0.3387 | 0.3500 | 4.5125 | 2.0679 | 0.992409 | 2.804208 |
| Breakeven 5/SL20 | 0.0858 | 0.0919 | 4.6119 | 3.5044 | 1.197188 | 3.027589 |
| Time 24 | 0.5194 | 0.5065 | −0.3559 | 0.0414 | 0.000000 | 0.000000 |
| Take-profit only 10 | 0.8475 | 0.8738 | −5.6229 | −3.2864 | −0.520470 | −2.019161 |
| Take-profit only 40 | 0.6087 | 0.6291 | −2.5854 | −1.2576 | −0.843513 | −1.691569 |
| Stop-loss only 10 | 0.1569 | 0.1300 | 4.0411 | 3.2720 | 0.520470 | 2.019161 |
| Stop-loss only 40 | 0.4205 | 0.3748 | 1.7241 | 1.2527 | 0.843513 | 1.691569 |
Observation 6.2: ★ Prediction ③ held, and this is the core. Across the twenty rules the win rates of the measurement and the random walk correlate at +0.9922, with a median difference of −0.0056 (range −0.0550 to +0.0570).
Observation 6.3: ★ The shape is therefore a property of the stopping rule, not of the market. Which stopping rule gives which win rate is nearly the same on a series that is right about nothing.
Observation 6.4: The skewness is smaller on the random walk (4.5125 against 2.0679 for Trail 5). ★ The measurement has the longer tail, which may be a property of the market. But the win rates agree closely.
Observation 6.5: On the random walk the largest absolute M among the rules declared symmetric is 6.884495 pips. As the three groups of Section 4 show, the trail and the breakeven move do not cancel, so this figure is the classification error showing itself.
Observation 6.6: The random walk's expected value for the buy has a median of +1.5707 pips and a range of −14.9559 to +20.4750 pips (the theoretical value is 0). ★ Even a series with no drift scatters this far, because a single path carries the drift that path happened to realize. ⇒ The expected value of the buy alone must not be used to talk about the market.
7. Limitations
- ★ The classification in prediction ② failed. "For a symmetric rule M is identically 0" applied only to rules with no barriers. This paper writes that failure and reclassifies into three groups after measuring.
- ★ One identity was found after measuring. That the M of "take-profit only" and "stop-loss only" are equal and opposite is not a test. It is written here so that an identity is not counted as a test.
- Ambiguous bars are resolved adverse-first. As F025 showed, that convention makes results. The negative part of M here is exactly explained by it (difference 0.0000).
- The trail updates the running maximum only up to the previous bar. A convention that updates within the bar gives other figures. Not measured.
- No costs are included. The figures here are therefore not trading performance.
- The overlap is not removed. Entries are taken on every bar, so the observations overlap. No t value is reported and significance is not discussed.
- The stopping rules are fixed at twenty. Scaling out, pyramiding and volatility-linked widths are not treated.
- Four instruments over six years. Nothing is said about other markets or other periods.
Conclusion
Across twenty stopping rules the win rate runs from 0.0562 to 0.9443, the median from −40.0000 to +40.0000 pips and the skewness from −8.4093 to +8.4366. Same entries, same data; only when to exit was changed.
And the correlation between win rate and skewness is −0.9345. The higher the win rate, the more it becomes many small wins and a few large losses. On USDJPY, "take-profit only 10" has a win rate of 0.8325 with a worst of −702.30 pips, while "breakeven 5/SL20" has a win rate of 0.1076 with a median of 0.0000. ★ The win rate measures the shape, not whether anything is good.
★ And the shape moves just as much on a synthetic random walk. Across the twenty rules the win rates correlate at +0.9922 with a median difference of −0.0056. Which stopping rule gives which win rate is nearly the same on a series that is right about nothing.
The classification in prediction ②, written before measuring, failed. "For a symmetric rule M is identically 0" holds only for rules with no barriers (exactly 0.000000). For fixed take-profit = stop-loss, M = −(ambiguous share × barrier) exactly (difference 0.0000), and ★ the negative M is not the market but the act of resolving ambiguous bars adverse-first. The trail and the breakeven move do not cancel path by path, because the buy trails down from its maximum and the sell trails up from its minimum.
★ A stopping rule therefore changes the shape of the profit and loss, not the direction. The expected value of the buy alone runs from −4.3840 to +27.4471 pips, but a synthetic random walk with zero directional information scatters from −14.9559 to +20.4750 pips. The expected value of the buy alone must not be used to talk about the market.
Data and reproduction
| Data | FX is Dukascopy-derived tick data (from 2019 onward, confirmed identical down to the millisecond, bid and ask). Gold is Dukascopy |
| Period | 2019–2024 (six years) |
| Instruments | USDJPY, EURUSD, GBPUSD, XAUUSD |
| Bars | One-hour bars, mid prices, completed bars only. No bar is made where there are no ticks |
| Entry | Close of a one-hour bar, on every bar. Both the buy and the sell |
| Stopping rules | Twenty: 4 fixed, 4 trailing, 3 breakeven, 3 time-only, 3 take-profit-only, 3 stop-loss-only. Deadline 24 bars |
| Conventions | Ambiguous bars resolved adverse-first; the trail updates only up to the previous bar |
| Costs | Not included |
| Verification | 検算/F026.py (--zu also writes the figures). Every figure in the text comes from 検算/F026_output.txt |
| Figures | 図/F026_zu1, 図/F026_zu2 (png, svg, English versions) |
| Random seeds | Fixed. Re-running gives the same values |
| Foundation check | _ツール/audit_bars.py (bar look-ahead, daylight saving, day boundaries). The record is _土台の検査.txt |
References
- Yamagishi, Y. (2026). Placing the Take Profit and Stop Loss Forty-Nine Ways Does Not Move the Expectation [F012]. Zenodo. 10.5281/zenodo.22891608
- Yamagishi, Y. (2026). How You Treat a Bar That Touches Both Barriers Is What Makes the Win Rate and the Expected Value [F025]. Zenodo. 10.5281/zenodo.22892549
Reference
Yamagishi, Y. (2026). A Stopping Rule Changes the Shape of the Profit and Loss, Not the Direction [F026]. Zenodo.
DOI: 10.5281/zenodo.22892604
YOI: https://www.yamagishiyuuki.com/yoi/F026
ORCID: 0009-0006-8587-3450
PDF (English) · PDF (Japanese) · Date proof of the English PDF (OpenTimestamps .ots) · SHA256SUMS
The record page for this paper (in Japanese, with the PDFs in each language and the date proof): YOI F026. This paper is a preprint and has not been peer reviewed.