Abstract
What this paper asks is what the treatment of a bar that touches both the take-profit and the stop-loss produces — and the answer is: the win rate and the expected value themselves. No new mathematical theorem and no new law is claimed.
First, the share of bars touching both grows as the barriers narrow. On one-hour bars it is a median of 0.2564 at R=5 pips and 0.0043 at R=40. For gold at R=5 it is 0.6186, so in six tenths of the cases the order cannot be read from the bar (Section 3).
Second, and this is the core. ★ Holding the entry, the barriers and the data fixed and changing only the treatment of the ambiguous bar moves the expected value by a median of 1.5597 pips and a maximum of 7.1992 pips. The win rate among decided trades moves from 0.1890 to 0.8077 for gold at R=5 (Section 4).
Third, the favourable-first convention gives a median expected value of +0.8394 pips and the adverse-first convention −0.6850 pips. The convention is making an expected value and a loss that do not exist (Section 4).
Fourth, resolving on five-minute bars cuts the ambiguity to 0.0011–0.0100, but not to zero. ★ The same problem recurs one level down (Sections 3 and 5).
Fifth, and the four conventions agree with the five-minute answer about equally (0.8002, 0.7991, 0.7714, 0.7956). ★ On an ambiguous bar, either choice is right about half the time, so the right convention cannot be chosen (Section 5).
Sixth, ★ even on a synthetic random walk with zero directional information, the favourable-first convention makes +0.3708 pips and the adverse-first one −0.5449 pips. For gold at R=5 the measurement gives −3.1097 / +3.0767 against the random walk's −2.8469 / +2.8370 — essentially the same (Section 6).
Scope of this paper: No new mathematical theorem and no new law is claimed — the triple-barrier method, the indeterminacy of the path inside a bar, optional stopping and random walks are all known. No real course or its proponent is discussed — no real teaching material, author, or vendor is the subject here, and none is named. Trading is not discussed — no costs are included, so the figures here are not trading performance (Section 7). Read the difference, not the level — the measurement carries drift, so the theoretical 0 does not hold exactly; it holds exactly on the synthetic random walk (Sections 4 and 6). The scope is intraday and few instruments — four instruments, six years, one-hour bars. Monthly time-series momentum (dozens of markets, one to twelve month holds) is documented in the academic literature and is not contradicted here. Five-minute bars are not treated as the truth — ambiguity remains there too and is resolved adverse-first (Sections 5 and 7). The overlap is not removed — entries are taken on every bar, so the observations overlap, and no t value is reported (Section 7). No forecast is claimed. Relation to earlier papers: F012 showed that forty-nine placements of take-profit and stop-loss do not move the expected value — this paper measures the indeterminacy that enters when that check is run on bars. What is added is placing four conventions side by side, resolving on finer bars, and doing the same thing on a series with zero directional information.
1. Notation and the question
When take-profit and stop-loss are checked on bars, a bar's high can reach the take-profit while that same bar's low reaches the stop-loss.
| What gets reported | What does not |
|---|---|
| The win rate and the expected value | What share of cases touched both in one bar |
| The take-profit and stop-loss widths | Which was taken first |
| The bar size used | What resolving on finer bars would give |
Observation 1.1: The four values of a bar do not say the order inside it. Which of the high and the low came first is not determined by the open and the close either.
Observation 1.2: ★ So a convention is needed. Adverse first, favourable first, count as half, decide by the bar's direction — all are in use. And which one was used is usually not written.
Observation 1.3: The separator is which was taken first on an ambiguous bar. The entry, the barriers, the data, the period and the instrument are all held fixed, and only that treatment is varied.
Observation 1.4: ★ And two comparison partners are needed: one is the version resolved on finer bars (which convention is closest?), the other is a series with zero directional information by construction (is the expected value the convention makes a property of the market?).
Question: how much do the win rate and the expected value move with the treatment of a bar that touches both barriers?
2. State the quantity and the design first
Predictions (written before running)
① With take-profit = stop-loss and no costs, the expected value is 0 (optional stopping). It stays 0 with time-outs mixed in.
② The share of bars touching both grows as the barriers narrow.
③ ★ The favourable-first convention makes an expected value that does not exist, and the adverse-first one makes a loss that does not exist.
④ ★ A synthetic random walk with zero directional information makes just as much.
⑤ Resolving on finer bars cuts the ambiguity but not to zero.
Design (declared before running and not changed during it)
| Item | Decision |
|---|---|
| Entry | Close of a one-hour bar. Every bar (buys only; sells are the mirror) |
| Barriers | Take-profit = stop-loss = R pips. R is 5, 10, 20, 40 |
| Deadline | 24 bars (one day). Untouched is a time-out (marked to the close) |
| Conventions | Adverse first / favourable first / count as half / by the bar's direction |
| Re-resolution | Five-minute bars (an hour split into 12). The ambiguity there is counted too |
| Costs | Not included. ★ That is what makes the theoretical value on the random walk exactly 0 |
| Baseline | Synthetic random walk down to within-bar movement |
| Instruments | USDJPY, EURUSD, GBPUSD, XAUUSD |
| Period | 2019–2024 |
Observation 2.1: ★ The four conventions give identical answers on every non-ambiguous case. They differ only on the ambiguous ones.
Observation 2.2: Costs are left out to make the theoretical value plain. With take-profit = stop-loss and symmetric increments, the expected value is 0 and the win rate among decided trades is 0.5.
Observation 2.3: But the measurement carries drift. Which way the instrument moved over the period sits in the level, so the theoretical 0 does not hold exactly on the measurement. ★ What this paper reads is therefore not the level but the difference between conventions.
The bar counts are 36,534, 36,554, 36,535 and 34,892 on one-hour bars and 438,283, 438,505, 438,199 and 418,478 on five-minute bars.
3. How often does one bar touch both barriers?
Calculation 3.1 Share of ambiguous cases, and time-outs
| Instrument | R | Count | Ambiguous on 1h | Ambiguous on 5m | Time-out |
|---|---|---|---|---|---|
| USDJPY | 5 | 36,510 | 0.2275 | 0.0096 | 0.0000 |
| USDJPY | 10 | 36,510 | 0.0730 | 0.0024 | 0.0028 |
| USDJPY | 20 | 36,510 | 0.0187 | 0.0023 | 0.0508 |
| USDJPY | 40 | 36,510 | 0.0050 | 0.0017 | 0.2978 |
| EURUSD | 5 | 36,530 | 0.1659 | 0.0039 | 0.0000 |
| EURUSD | 40 | 36,530 | 0.0019 | 0.0001 | 0.3425 |
| GBPUSD | 5 | 36,511 | 0.2852 | 0.0103 | 0.0000 |
| GBPUSD | 40 | 36,511 | 0.0036 | 0.0004 | 0.1235 |
| XAUUSD | 5 | 34,868 | 0.6186 | 0.0577 | 0.0000 |
| XAUUSD | 10 | 34,868 | 0.3600 | 0.0173 | 0.0000 |
| XAUUSD | 20 | 34,868 | 0.1325 | 0.0035 | 0.0000 |
| XAUUSD | 40 | 34,868 | 0.0332 | 0.0033 | 0.0064 |
Observation 3.2: Prediction ② held. The share ambiguous on one-hour bars is a median of 0.2564 at R=5 pips, 0.0800 at R=10, 0.0184 at R=20 and 0.0043 at R=40 — larger as the barriers narrow.
Observation 3.3: ★ For gold at R=5 pips it is 0.6186. In six tenths of the cases the order cannot be read from the bar. What decides those six tenths is not the data but the writer.
Observation 3.4: Resolving on five-minute bars cuts the ambiguity to 0.0100 at R=5 (0.0388 times) and 0.0011 at R=40 (0.2460 times).
Observation 3.5: ★ But not to zero. Five-minute bars have the same problem, so the same problem recurs one level down. Even down at the tick, both sides of the quote can move within the same millisecond.
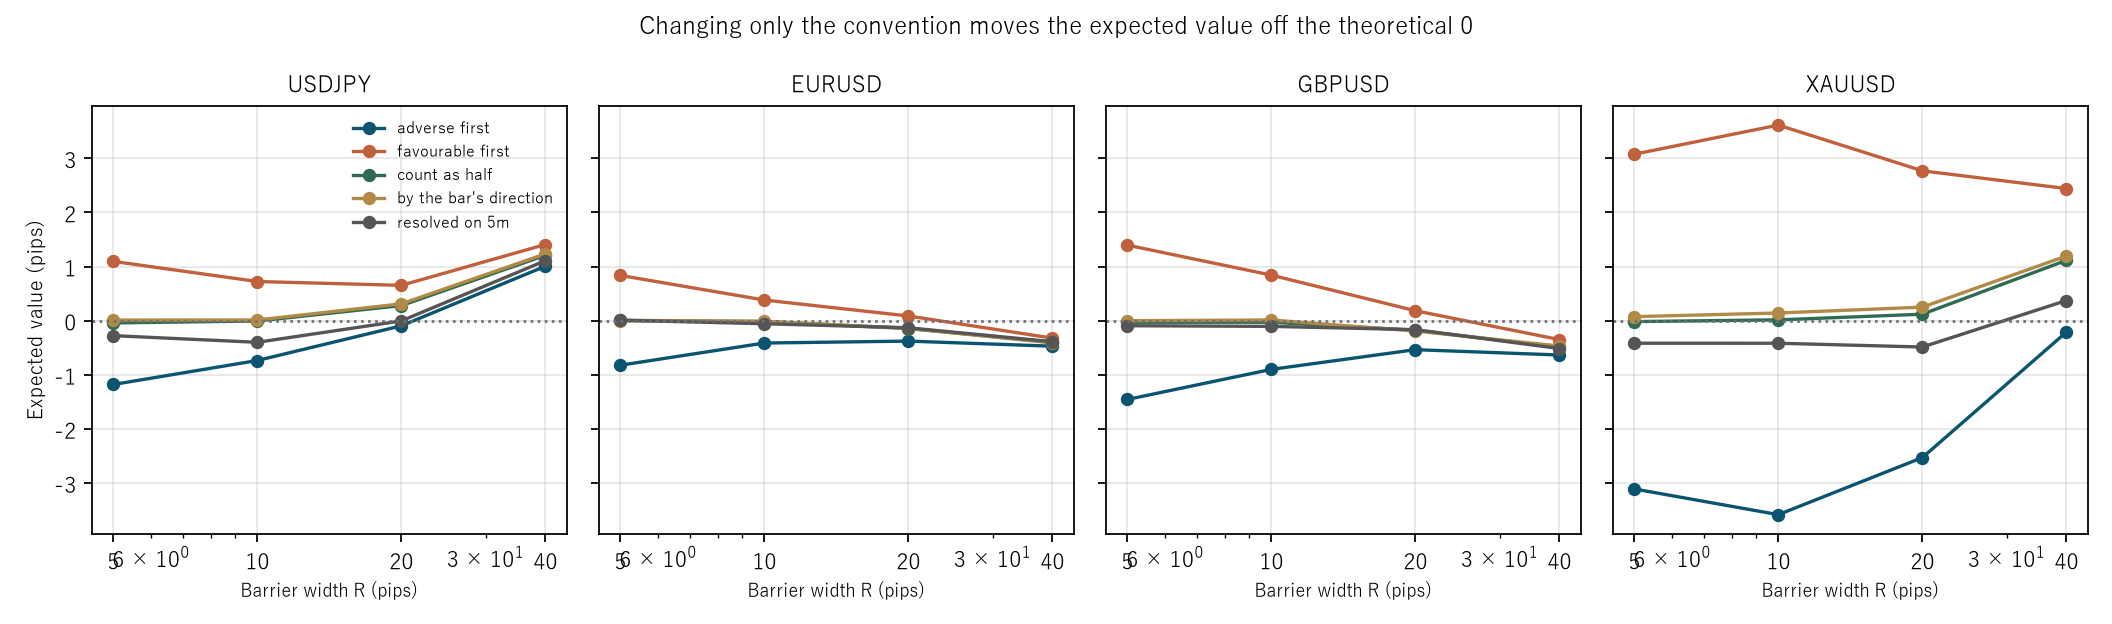
Figure 1: horizontal is the barrier width R, vertical is the expected value. The five lines are the four conventions and the version resolved on five-minute bars; the dotted line is the theoretical 0.
4. How much do the win rate and the expected value move with the convention?
Calculation 4.1 Expected value by convention (pips)
| Instrument | R | Adverse first | Favourable first | Count as half | By the bar | Range |
|---|---|---|---|---|---|---|
| USDJPY | 5 | −1.1791 | 1.0959 | −0.0416 | 0.0115 | 2.2750 |
| USDJPY | 10 | −0.7358 | 0.7241 | −0.0059 | 0.0130 | 1.4599 |
| USDJPY | 40 | 1.0064 | 1.4074 | 1.2069 | 1.2343 | 0.4010 |
| EURUSD | 5 | −0.8229 | 0.8366 | 0.0068 | 0.0005 | 1.6595 |
| EURUSD | 40 | −0.4712 | −0.3223 | −0.3968 | −0.4121 | 0.1489 |
| GBPUSD | 5 | −1.4559 | 1.3964 | −0.0297 | −0.0004 | 2.8523 |
| GBPUSD | 40 | −0.6341 | −0.3493 | −0.4917 | −0.4676 | 0.2848 |
| XAUUSD | 5 | −3.1097 | 3.0767 | −0.0165 | 0.0746 | 6.1865 |
| XAUUSD | 10 | −3.5844 | 3.6148 | 0.0152 | 0.1423 | 7.1992 |
| XAUUSD | 40 | −0.2109 | 2.4414 | 1.1153 | 1.1956 | 2.6523 |
Calculation 4.2 Win rate among decided trades, by convention
| Instrument | R | Adverse first | Favourable first | Count as half | By the bar | Range |
|---|---|---|---|---|---|---|
| USDJPY | 5 | 0.3821 | 0.6096 | 0.3821 | 0.5012 | 0.2275 |
| USDJPY | 40 | 0.5072 | 0.5143 | 0.5072 | 0.5113 | 0.0071 |
| EURUSD | 5 | 0.4177 | 0.5837 | 0.4177 | 0.5001 | 0.1659 |
| EURUSD | 40 | 0.4919 | 0.4947 | 0.4919 | 0.4930 | 0.0028 |
| GBPUSD | 5 | 0.3544 | 0.6396 | 0.3544 | 0.5000 | 0.2852 |
| GBPUSD | 40 | 0.4900 | 0.4941 | 0.4900 | 0.4924 | 0.0041 |
| XAUUSD | 5 | 0.1890 | 0.8077 | 0.1890 | 0.5075 | 0.6186 |
| XAUUSD | 10 | 0.3208 | 0.6807 | 0.3208 | 0.5071 | 0.3600 |
| XAUUSD | 20 | 0.4368 | 0.5692 | 0.4368 | 0.5063 | 0.1325 |
| XAUUSD | 40 | 0.4973 | 0.5306 | 0.4973 | 0.5150 | 0.0334 |
Observation 4.3: ★ This is the core. The expected value moves with the convention by a median of 1.5597 pips and a maximum of 7.1992 pips. The win rate moves by a median of 0.0565 and a maximum of 0.6186.
Observation 4.4: For gold at R=5 pips the win rate runs from 0.1890 to 0.8077. ★ On the same data, the same entry and the same barriers, it becomes either "a method that wins two times in ten" or "a method that wins eight times in ten".
Observation 4.5: Prediction ③ held. The favourable-first convention gives a median expected value of +0.8394 pips and the adverse-first one −0.6850 pips. The convention is making an expected value and a loss that do not exist.
Observation 4.6: ★ Prediction ① was loosely worded. The measurement carries drift, so the theoretical 0 does not hold exactly. For USDJPY at R=40 all four conventions are positive (1.0064 to 1.4074), which is the yen's weakness over the period and not an effect of the convention. ★ So what must be read is the range, not the level.
Observation 4.7: The wider the barriers, the smaller the range. USDJPY gives 2.2750 at R=5 and 0.4010 at R=40. That is because fewer cases are ambiguous, not because the convention becomes right.
5. Which convention is closest when resolved on five-minute bars?
Calculation 5.1 The five-minute answer, and agreement with each convention
| Instrument | R | 5m EV | 5m win rate | Agree adverse | Agree favourable | Agree half | Agree by bar |
|---|---|---|---|---|---|---|---|
| USDJPY | 5 | −0.2764 | 0.4724 | 0.6238 | 0.6120 | 0.5041 | 0.6142 |
| USDJPY | 20 | −0.0044 | 0.4989 | 0.9104 | 0.9079 | 0.8998 | 0.9062 |
| EURUSD | 5 | 0.0088 | 0.5009 | 0.6557 | 0.6572 | 0.5735 | 0.6517 |
| EURUSD | 40 | −0.3879 | 0.4932 | 0.9781 | 0.9785 | 0.9773 | 0.9774 |
| GBPUSD | 5 | −0.0929 | 0.4907 | 0.5915 | 0.5878 | 0.4470 | 0.5856 |
| GBPUSD | 40 | −0.5147 | 0.4913 | 0.9734 | 0.9727 | 0.9714 | 0.9718 |
| XAUUSD | 5 | −0.4164 | 0.4584 | 0.5459 | 0.4882 | 0.2078 | 0.5204 |
| XAUUSD | 40 | 0.3728 | 0.5046 | 0.8615 | 0.8569 | 0.8426 | 0.8545 |
Observation 5.2: Resolving on five-minute bars moves toward the theoretical values. The expected value is a median of −0.1480 pips and the win rate 0.4940. Much closer to 0 than the one-hour favourable-first (+0.8394) or adverse-first (−0.6850).
Observation 5.3: ★ But the "right" convention cannot be chosen. Agreement with the five-minute answer is 0.8002 adverse-first, 0.7991 favourable-first, 0.7714 count-as-half and 0.7956 by the bar — all about the same.
Observation 5.4: ★ The reason is simple. On an ambiguous bar, either choice is right about half the time. So every convention misses about half the ambiguous cases. Choosing a convention does not raise the hit rate.
Observation 5.5: That count-as-half agrees least (0.7714) is not a verdict on the convention. It sets ambiguous cases to 0, so they must count as disagreements under a sign comparison.
Observation 5.6: ★ Five-minute bars must not be treated as the truth. They retain 0.0011 to 0.0100 ambiguity of their own, resolved adverse-first here. Resolve on finer bars and the five-minute answer moves too.
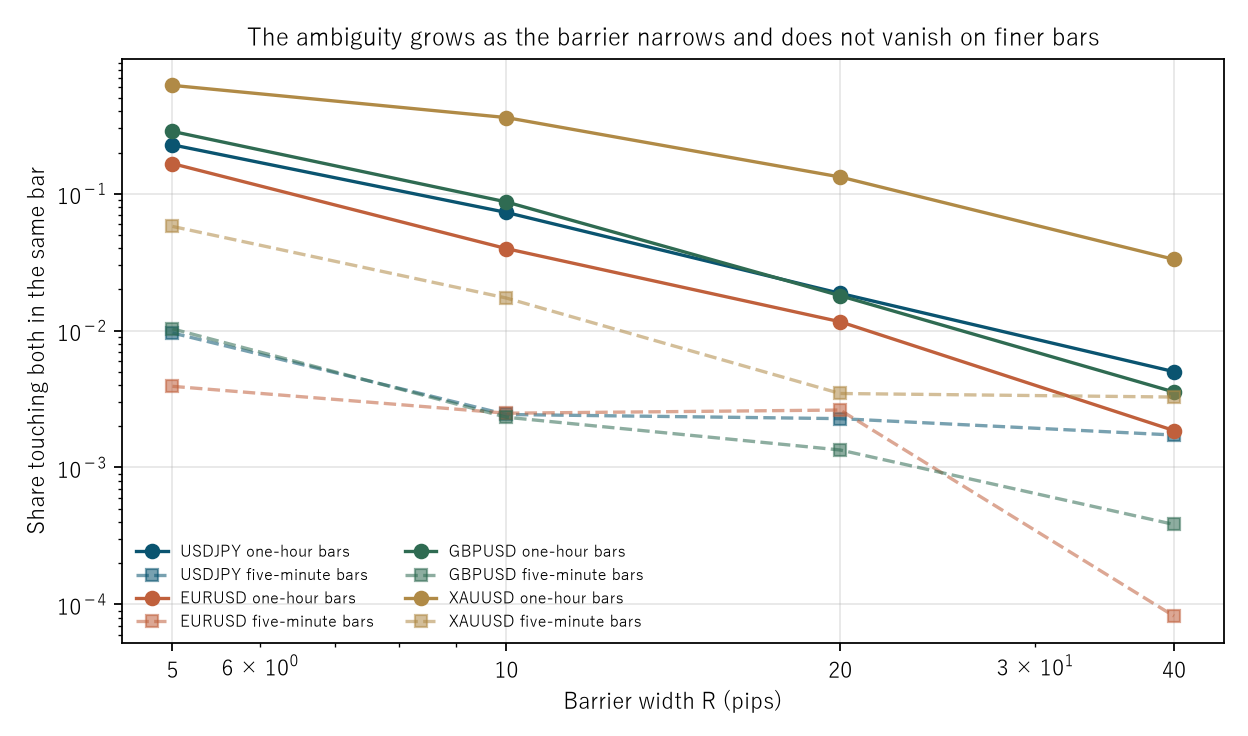
Figure 2: horizontal is the barrier width R, vertical is the share touching both in one bar (log–log). Solid lines are one-hour bars, dashed lines five-minute bars.
6. Baseline — do the same thing on a series with zero directional information
Calculation 6.1 The same thing on a synthetic random walk (R = 5 pips)
| Instrument | Ambiguous | Adverse-first EV | Favourable-first EV | Range | Favourable win rate | |
|---|---|---|---|---|---|---|
| USDJPY | measured | 0.2275 | −1.1791 | 1.0959 | 2.2750 | 0.6096 |
| USDJPY | random | 0.3005 | −1.5110 | 1.4942 | 3.0052 | 0.6494 |
| EURUSD | measured | 0.1659 | −0.8229 | 0.8366 | 1.6595 | 0.5837 |
| EURUSD | random | 0.1400 | −0.6975 | 0.7022 | 1.3997 | 0.5702 |
| GBPUSD | measured | 0.2852 | −1.4559 | 1.3964 | 2.8523 | 0.6396 |
| GBPUSD | random | 0.2953 | −1.4823 | 1.4711 | 2.9534 | 0.6471 |
| XAUUSD | measured | 0.6186 | −3.1097 | 3.0767 | 6.1865 | 0.8077 |
| XAUUSD | random | 0.5684 | −2.8469 | 2.8370 | 5.6839 | 0.7837 |
Observation 6.2: ★ Prediction ④ held. On the synthetic random walk the ambiguous share is a median of 0.0247, the favourable-first expected value +0.3708 pips, the adverse-first one −0.5449 pips, and the favourable-first win rate 0.5128. The theoretical values are 0 and 0.5.
Observation 6.3: ★ Here the theoretical 0 holds exactly. The synthetic series is built from independent normal increments with no drift, so with take-profit = stop-loss and no costs the expected value is exactly 0. The convention still makes one.
Observation 6.4: ★ The measurement and the random walk are almost identical. For gold at R=5 the measurement gives −3.1097 / +3.0767 against −2.8469 / +2.8370, with ranges of 6.1865 against 5.6839. For GBPUSD it is 2.8523 against 2.9534.
Observation 6.5: ★ So the expected value the convention makes is not the market's. It is a product of having checked on bars. It comes out just as large on a series that is right about nothing.
Observation 6.6: So when "a method with an 80% win rate" is written, ask first for the ambiguous share and the convention. ★ For gold at R=5 pips, the convention alone gives either 0.1890 or 0.8077.
7. Limitations
- ★ Prediction ① was loosely worded. The measurement carries drift, so the theoretical 0 does not hold exactly; it holds exactly on the synthetic random walk. This paper says so and reads the range rather than the level.
- No costs are included. The figures here are therefore not trading performance. With costs the theoretical expected value becomes minus the spread, and the effect of the convention sits on top of that.
- ★ Five-minute bars are not treated as the truth. They retain 0.0011 to 0.0100 ambiguity, resolved adverse-first. Resolving on finer bars moves the five-minute answer too.
- The overlap is not removed. Entries are taken on every bar, so the observations overlap. No t value is reported and significance is not discussed.
- The barriers are fixed symmetric. With take-profit ≠ stop-loss the effect of the treatment becomes asymmetric, which is not measured.
- The deadline is fixed at 24 bars. Time-outs run from 0.1235 to 0.3425 at R=40, and their profit and loss is marked to the close.
- Only buys are measured. Sells are the mirror, but the asymmetry of the convention (adverse first is always the unfavourable side) carries over as it is.
- Four instruments over six years. Nothing is said about other markets or other periods.
Conclusion
A bar that touches both the take-profit and the stop-loss is more common the narrower the barriers: a median of 0.2564 at R=5 pips on one-hour bars, and 0.6186 for gold. For those six tenths, which came first is not written in the data.
Holding the entry, the barriers and the data fixed and changing only that treatment moves the expected value by a median of 1.5597 pips and a maximum of 7.1992 pips. The win rate among decided trades moves from 0.1890 to 0.8077 for gold at R=5. The same check becomes either "a method that wins two times in ten" or "a method that wins eight times in ten".
The convention is what makes the win rate and the expected value.
Resolving on five-minute bars moves toward the theoretical values (expected value −0.1480, win rate 0.4940). But the ambiguity does not vanish (0.0011 to 0.0100), and ★ every convention agrees with the five-minute answer about equally (0.8002, 0.7991, 0.7714, 0.7956). On an ambiguous bar either choice is right about half the time; the right convention cannot be chosen.
And on a synthetic random walk with zero directional information, the favourable-first convention still makes +0.3708 pips and the adverse-first one −0.5449 pips. For gold at R=5 the measurement gives −3.1097 / +3.0767 against the random walk's −2.8469 / +2.8370 — essentially the same. ★ The expected value the convention makes is not the market's; it is a product of having checked on bars.
What a report of a bar-based take-profit and stop-loss check therefore needs is the ambiguous share and the convention used. ★ A win rate without them cannot be read.
Data and reproduction
| Data | FX is Dukascopy-derived tick data (from 2019 onward, confirmed identical down to the millisecond, bid and ask). Gold is Dukascopy |
| Period | 2019–2024 (six years) |
| Instruments | USDJPY, EURUSD, GBPUSD, XAUUSD |
| Bars | One-hour and five-minute bars, mid prices, completed bars only. No bar is made where there are no ticks |
| Entry | Close of a one-hour bar, on every bar (buys only) |
| Barriers | Take-profit = stop-loss = 5, 10, 20, 40 pips. Deadline 24 bars |
| Conventions | Adverse first / favourable first / count as half / by the bar's direction, plus the version resolved on five-minute bars |
| Costs | Not included, to make the theoretical value plain |
| Verification | 検算/F025.py (--zu also writes the figures). Every figure in the text comes from 検算/F025_output.txt |
| Figures | 図/F025_zu1, 図/F025_zu2 (png, svg, English versions) |
| Random seeds | Fixed. Re-running gives the same values |
| Foundation check | _ツール/audit_bars.py (bar look-ahead, daylight saving, day boundaries). The record is _土台の検査.txt |
References
- Yamagishi, Y. (2026). Placing the Take Profit and Stop Loss Forty-Nine Ways Does Not Move the Expectation [F012]. Zenodo. 10.5281/zenodo.22891608
Reference
Yamagishi, Y. (2026). How You Treat a Bar That Touches Both Barriers Is What Makes the Win Rate and the Expected Value [F025]. Zenodo.
DOI: 10.5281/zenodo.22892549
YOI: https://www.yamagishiyuuki.com/yoi/F025
ORCID: 0009-0006-8587-3450
PDF (English) · PDF (Japanese) · Date proof of the English PDF (OpenTimestamps .ots) · SHA256SUMS
The record page for this paper (in Japanese, with the PDFs in each language and the date proof): YOI F025. This paper is a preprint and has not been peer reviewed.