Abstract
What this paper asks is where the fifth case goes when a straddle's outcomes are classified — and the answer is: that choice sets the share of "both lose" directly. No new mathematical theorem and no new law is claimed.
First, a straddle has five outcomes, not four. Beside "the buy wins", "the sell wins", "both win" and "both lose" there is neither leg resolving (a time-out) (Section 3).
Second, ★ prediction ①, written before measuring, worked as a check. When take-profit ≥ stop-loss, "both win" is geometrically impossible and comes out 0.000000 in all 16 cells. For take-profit < stop-loss it runs from 0.1573 to 0.5630 (Section 3).
Third, and this is the core. ★ Pouring the fifth case into "both lose" raises the share by up to 5.14 times. The difference runs from 0.00 to 5.09 points (median 0.20) (Section 4).
Fourth, the effect is not uniform. The smaller the true "both lose", the larger the multiple the same amount of time-outs produces. EURUSD at 20/20 goes from 0.0116 to 0.0530, a factor of 4.56, while for gold the time-outs are 0.0000 so the same mistake does nothing (Section 4).
Fifth, the same thing happens to the expected value. Counting a time-out as −(take-profit + stop-loss) lowers it by up to 2.0356 pips. The actual mean of the timed-out trades runs from −4.2994 to +4.2994 pips, with a median of 0.0000 (Section 5).
Sixth, ★ prediction ⑤ failed. The synthetic random walk produces almost no time-outs (a maximum of 0.0011), so the mistake produces no difference. Independent normal increments have no volatility clustering and so build no quiet periods. The size of this error depends on how quiet the market gets (Section 6).
Scope of this paper: No new mathematical theorem and no new law is claimed — the triple-barrier method, straddles, optional stopping and random walks are all known. No real course or its proponent is discussed — no real teaching material, author, or vendor is the subject here, and none is named. Trading is not discussed — no costs are included, so the figures here are not trading performance (Section 7). The scope is intraday and few instruments — four instruments, six years, one-hour bars. Monthly time-series momentum (dozens of markets, one to twelve month holds) is documented in the academic literature and is not contradicted here. Ambiguous bars are resolved adverse-first — as F025 showed, that convention must be declared (Section 2). The deadline is fixed at one day — a shorter deadline gives more time-outs and a bigger error, which is not measured here (Section 7). The baseline is unusable — the synthetic series has no quiet periods and almost no time-outs, so it is no control for this error (Sections 6 and 7). The overlap is not removed — entries are taken on every bar, so the observations overlap, and no t value is reported (Section 7). No forecast is claimed. Relation to earlier papers: F025 showed that the treatment of an ambiguous bar makes the win rate and the expected value, and F026 that a stopping rule changes the shape — this paper measures where the error enters at the classification step. What is added is naming the fifth case, using a geometric constraint as a check, and giving the error in the expected-value arithmetic in pips.
1. Notation and the question
Opening a buy and a sell at the same instant and classifying the outcome is common. Four categories are the usual set.
| What gets separated | What does not |
|---|---|
| The buy wins / the sell wins | The cases where neither leg resolved |
| Both win / both lose | Where that case was put by the final else |
| Their shares | What those cases actually made or lost |
Observation 1.1: Measuring with a deadline necessarily produces cases where neither leg resolves. That is the fifth.
Observation 1.2: ★ A classification written with four categories has nowhere to put the fifth. In most cases it flows into the final else, and that is usually "both lose".
Observation 1.3: The separator is where the fifth case was put. The data, the barriers, the deadline and the instruments are all held fixed, and only that placement is varied.
Observation 1.4: ★ And a geometric constraint can be used as a check. When take-profit ≥ stop-loss, the moment the buy reaches its target the sell has already passed its stop. "Both win" must be exactly 0. If it is not, something is broken.
Question: how much does where the fifth case was put move the share that gets reported?
2. State the quantity and the design first
Predictions (written before running)
① When take-profit ≥ stop-loss, "both win" is geometrically impossible, so the measurement should be exactly 0. For take-profit < stop-loss it becomes possible. ★ This is a check.
② The share of time-outs grows with wider barriers.
③ Pouring time-outs into "both lose" makes it several times the true value.
④ Counting a time-out as −(take-profit + stop-loss) lowers the expected value a long way.
⑤ ★ A synthetic random walk does the same (the classification error has nothing to do with the market).
Design (declared before running and not changed during it)
| Item | Decision |
|---|---|
| Entry | Close of a one-hour bar, on every bar. A buy and a sell at the same instant |
| Barriers | (take-profit, stop-loss) = (10,10) (20,10) (20,20) (20,5) (10,20) (5,20) |
| Deadline | 24 bars (one day). If neither resolves it is a time-out (marked to the close) |
| Ambiguous bars | Resolved adverse-first. Declared as F025 requires |
| Costs | Not included |
| Baseline | Synthetic random walk down to within-bar movement (3 series) |
| Instruments | USDJPY, EURUSD, GBPUSD, XAUUSD |
| Period | 2019–2024 |
Observation 2.1: ★ The five categories must sum to 1. Every row of the table here prints that sum. If it is not 1, something is being counted twice.
Observation 2.2: The sell is produced by running a buy on bars turned upside down. That makes the conventions identical on both sides.
Observation 2.3: Six barrier pairs are used so that both take-profit ≥ stop-loss and take-profit < stop-loss are present. Prediction ① has two branches, so one side alone is not a check.
The bar counts are 36,534, 36,554, 36,535 and 34,892.
3. Classifying a straddle into five
Calculation 3.1 The five categories (shares)
| Instrument | TP | SL | Buy wins | Sell wins | Both win | Both lose | Time-out | Sum |
|---|---|---|---|---|---|---|---|---|
| USDJPY | 10 | 10 | 0.4620 | 0.4627 | 0.0000 | 0.0725 | 0.0028 | 1.0000 |
| USDJPY | 20 | 20 | 0.4712 | 0.4593 | 0.0000 | 0.0187 | 0.0509 | 1.0000 |
| USDJPY | 20 | 5 | 0.1961 | 0.1928 | 0.0000 | 0.6045 | 0.0066 | 1.0000 |
| USDJPY | 10 | 20 | 0.3454 | 0.3397 | 0.2798 | 0.0108 | 0.0243 | 1.0000 |
| USDJPY | 5 | 20 | 0.2370 | 0.2362 | 0.5104 | 0.0098 | 0.0066 | 1.0000 |
| EURUSD | 10 | 10 | 0.4795 | 0.4809 | 0.0000 | 0.0393 | 0.0003 | 1.0000 |
| EURUSD | 20 | 20 | 0.4700 | 0.4771 | 0.0000 | 0.0116 | 0.0414 | 1.0000 |
| EURUSD | 5 | 20 | 0.2133 | 0.2181 | 0.5630 | 0.0028 | 0.0028 | 1.0000 |
| GBPUSD | 10 | 10 | 0.4555 | 0.4581 | 0.0000 | 0.0864 | 0.0000 | 1.0000 |
| GBPUSD | 20 | 20 | 0.4850 | 0.4933 | 0.0000 | 0.0180 | 0.0037 | 1.0000 |
| XAUUSD | 10 | 10 | 0.3208 | 0.3193 | 0.0000 | 0.3600 | 0.0000 | 1.0000 |
| XAUUSD | 10 | 20 | 0.3632 | 0.3612 | 0.1573 | 0.1184 | 0.0000 | 1.0000 |
Observation 3.2: ★ Prediction ① worked as a check. All 16 cells with take-profit ≥ stop-loss give "both win" of 0.000000. The geometric constraint comes out directly.
Observation 3.3: ★ And the 8 cells with take-profit < stop-loss give 0.1573 to 0.5630. The prediction held on both branches. A zero on one side alone could be a computation error, but both branches came out as predicted, so the walk is not broken.
Observation 3.4: The share of time-outs runs from 0.0000 to 0.0509, median 0.0020. As prediction ② said, it is largest for the widest barriers (20/20).
Observation 3.5: For gold the time-outs are 0.0000. One of the barriers is always reached within a day. ★ So whether the error appears at all depends on the instrument and the barriers.
Observation 3.6: ★ When take-profit = stop-loss, "both lose" is exactly the share of ambiguous bars. USDJPY 0.0725, EURUSD 0.0393, GBPUSD 0.0864 and XAUUSD 0.3600 match the ambiguous shares measured in F026. Under the adverse-first convention an ambiguous bar puts a loss on both legs.
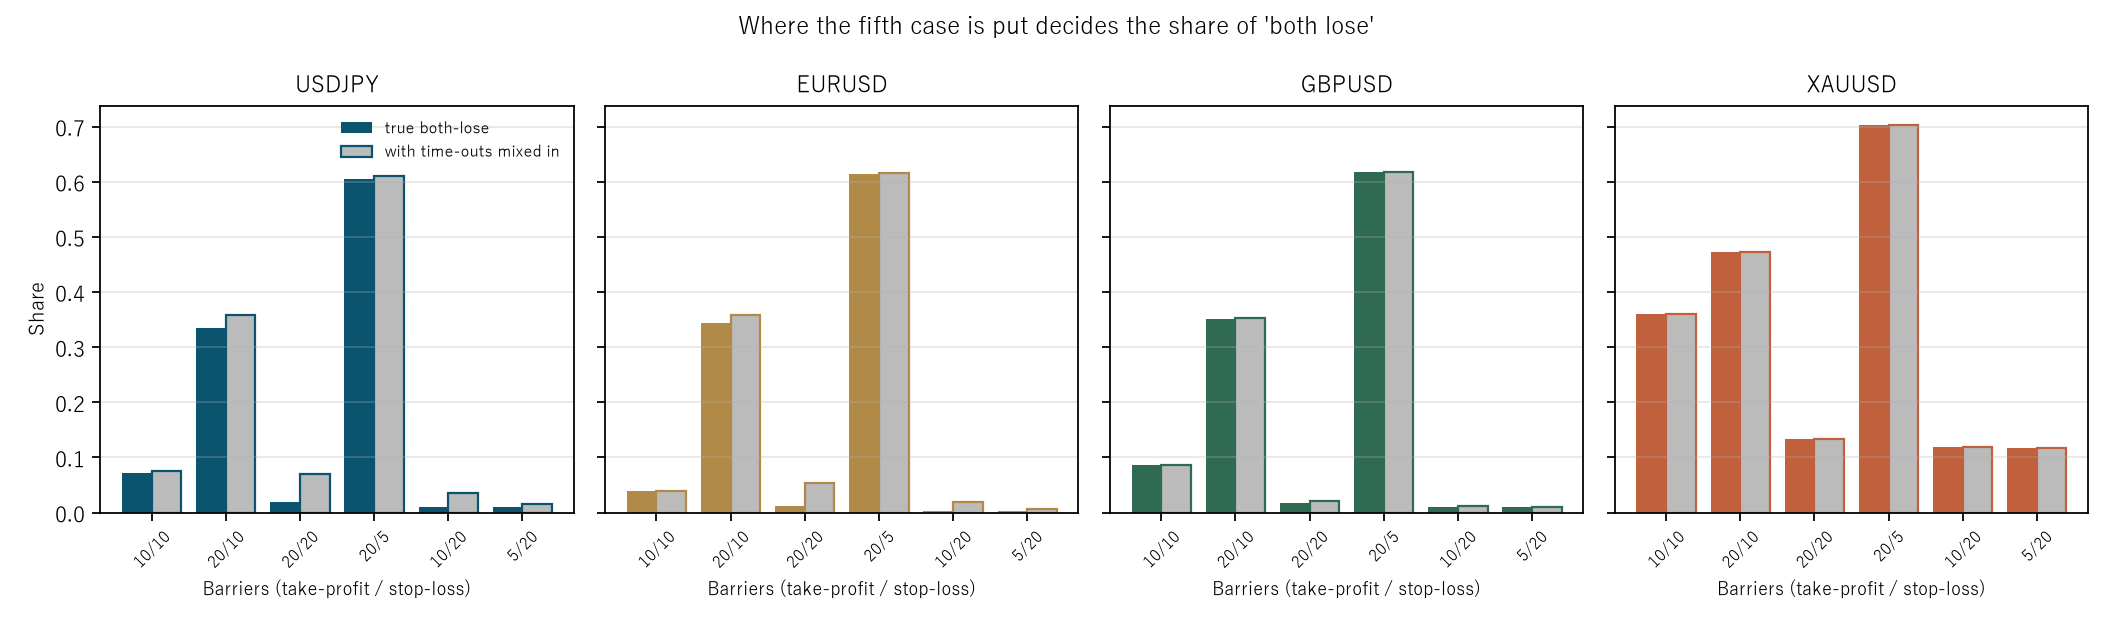
Figure 1: horizontal is the barriers (take-profit / stop-loss), vertical is the share. The solid bar is the true "both lose", the pale bar is the version with time-outs mixed in.
4. How many times larger does "both lose" get?
Calculation 4.1 The fifth case put into the else (shares)
| Instrument | TP | SL | True both-lose | With time-outs | Factor | Difference (points) |
|---|---|---|---|---|---|---|
| USDJPY | 20 | 20 | 0.0187 | 0.0695 | 3.73 | 5.09 |
| USDJPY | 10 | 20 | 0.0108 | 0.0351 | 3.25 | 2.43 |
| USDJPY | 20 | 10 | 0.3346 | 0.3589 | 1.07 | 2.43 |
| EURUSD | 10 | 20 | 0.0036 | 0.0186 | 5.14 | 1.49 |
| EURUSD | 20 | 20 | 0.0116 | 0.0530 | 4.56 | 4.14 |
| EURUSD | 5 | 20 | 0.0028 | 0.0056 | 1.99 | 0.28 |
| GBPUSD | 20 | 20 | 0.0180 | 0.0217 | 1.20 | 0.37 |
| GBPUSD | 10 | 10 | 0.0864 | 0.0864 | 1.00 | 0.00 |
| XAUUSD | 10 | 10 | 0.3600 | 0.3600 | 1.00 | 0.00 |
| XAUUSD | 20 | 5 | 0.7029 | 0.7029 | 1.00 | 0.00 |
Observation 4.2: ★ This is the core. On the same data and the same barriers, where the fifth case was put alone makes "both lose" up to 5.14 times larger. The difference runs from 0.00 to 5.09 points (median 0.20).
Observation 4.3: ★ What sets the factor is "time-outs ÷ true both-lose". EURUSD at 10/20 has only 0.0149 time-outs, but its true value is 0.0036, so the factor is 5.14.
Observation 4.4: Conversely, where the true value is large the factor is near 1. XAUUSD at 20/5 stays at 0.7029, a factor of 1.00.
Observation 4.5: The effect is therefore not uniform. The median factor is only 1.02, and the large effects are confined to cells where "both lose" was small to begin with. ★ Those are also the cells one is tempted to call "a rare event".
Observation 4.6: For gold the difference is 0.00 at all four barriers. With no time-outs, the wrong classification does nothing. ★ Whether the error shows depends on the data.
5. The same thing happens to the expected value
Calculation 5.1 Counting a time-out as −(take-profit + stop-loss) (pips)
| Instrument | TP | SL | Correct EV | Time-out as −(TP+SL) | Shift | Actual mean of time-outs |
|---|---|---|---|---|---|---|
| USDJPY | 20 | 20 | −0.7461 | −2.7817 | −2.0356 | 0.0000 |
| USDJPY | 10 | 20 | −1.5833 | −2.4161 | −0.8328 | 4.2784 |
| USDJPY | 20 | 10 | −0.3863 | −1.0112 | −0.6249 | −4.2784 |
| EURUSD | 20 | 20 | −0.4643 | −2.1188 | −1.6545 | 0.0000 |
| EURUSD | 10 | 20 | −0.5210 | −1.0337 | −0.5127 | 4.2994 |
| EURUSD | 20 | 5 | −0.3634 | −0.4402 | −0.0768 | 2.4887 |
| GBPUSD | 20 | 20 | −0.7198 | −0.8666 | −0.1468 | 0.0000 |
| GBPUSD | 20 | 5 | −0.4427 | −0.4482 | −0.0056 | 3.9643 |
| XAUUSD | 10 | 10 | −7.1992 | −7.1992 | 0.0000 | (no time-outs) |
| XAUUSD | 5 | 20 | −11.7370 | −11.7370 | 0.0000 | (no time-outs) |
Observation 5.2: Prediction ④ held. Counting a time-out as −(take-profit + stop-loss) lowers the expected value by up to 2.0356 pips (median −0.0466).
Observation 5.3: ★ But a time-out is not −(take-profit + stop-loss). Its actual mean runs from −4.2994 to +4.2994 pips, with a median of 0.0000. Neither barrier was reached, so the trade was simply held to the close.
Observation 5.4: At 20/20, −(take-profit + stop-loss) is a loss the width of the two barriers added together. The actual mean is 0.0000. ★ It is not a matter of magnitude; the sign is wrong.
Observation 5.5: Gold is unaffected here too. With no time-outs, every way of counting gives the same value.
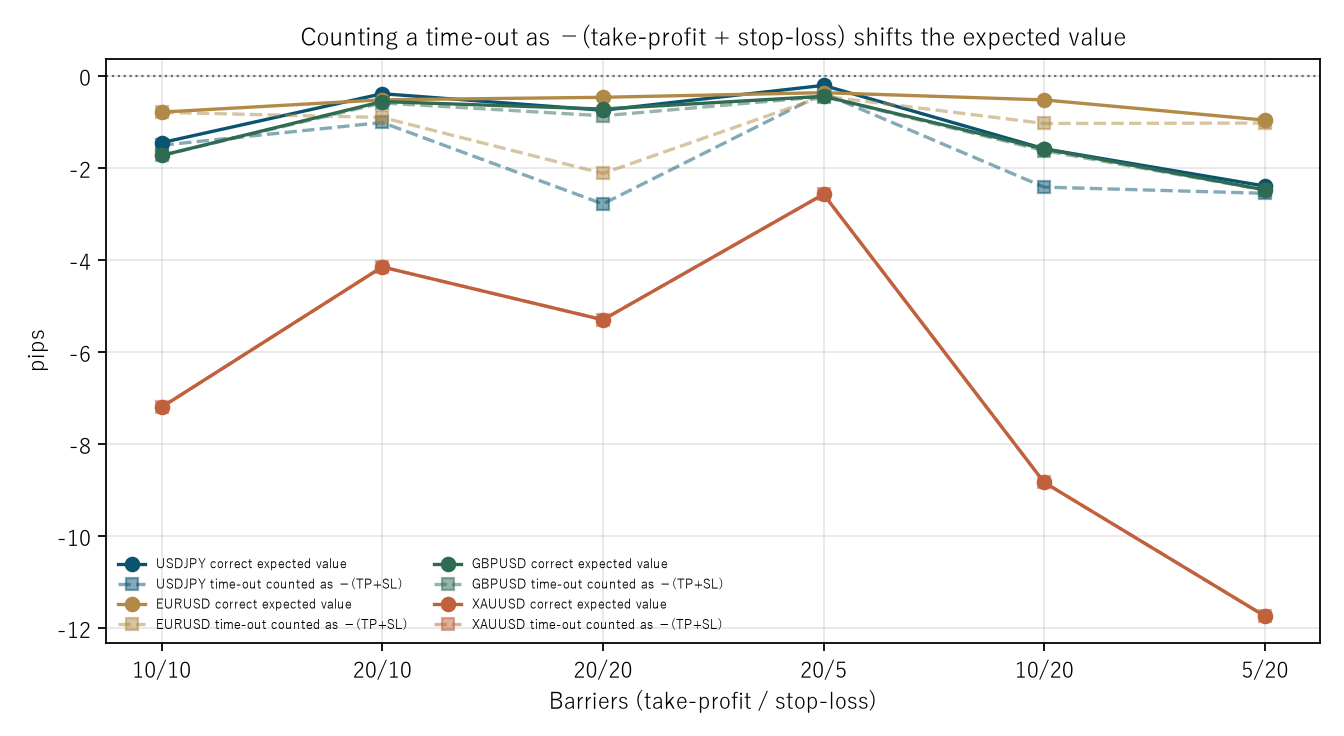
Figure 2: horizontal is the barriers, vertical is pips. The solid line is the correct expected value, the dashed line the version counting a time-out as −(TP+SL).
6. Baseline — do the same thing on a series with zero directional information
Calculation 6.1 Measurement against synthetic random walk (shares)
| Instrument | TP | SL | Time-out | True both-lose | With time-outs | Difference (points) | |
|---|---|---|---|---|---|---|---|
| USDJPY | 20 | 20 | measured | 0.0509 | 0.0187 | 0.0695 | 5.09 |
| USDJPY | 20 | 20 | random | 0.0000 | 0.0006 | 0.0006 | 0.00 |
| USDJPY | 10 | 10 | measured | 0.0028 | 0.0725 | 0.0753 | 0.28 |
| USDJPY | 10 | 10 | random | 0.0000 | 0.0469 | 0.0469 | 0.00 |
| GBPUSD | 20 | 20 | measured | 0.0037 | 0.0180 | 0.0217 | 0.37 |
| GBPUSD | 20 | 20 | random | 0.0000 | 0.0005 | 0.0005 | 0.00 |
| GBPUSD | 20 | 5 | measured | 0.0002 | 0.6176 | 0.6178 | 0.02 |
| GBPUSD | 20 | 5 | random | 0.0000 | 0.5229 | 0.5229 | 0.00 |
| XAUUSD | 10 | 10 | measured | 0.0000 | 0.3600 | 0.3600 | 0.00 |
| XAUUSD | 10 | 10 | random | 0.0000 | 0.3740 | 0.3740 | 0.00 |
Observation 6.2: ★ Prediction ⑤ failed. The synthetic random walk produces almost no time-outs (median 0.0000, maximum 0.0011), so the wrong classification produces no difference (median difference 0.00 points against 0.20 on the measurement).
Observation 6.3: ★ The way it failed is informative. Independent normal increments have no volatility clustering, so no quiet periods are built. In markets quiet periods exist, and that is where time-outs happen.
Observation 6.4: ★ The size of this error therefore depends on how quiet the market gets. The synthetic series is no control for it. The baseline here worked by showing that it cannot be used.
Observation 6.5: The geometric constraint, by contrast, is the same on the random walk. "Both win" with take-profit ≥ stop-loss has a maximum of 0.000000 there too. ★ Geometry does not depend on the market.
Observation 6.6: The level of "both lose" is lower on the random walk (0.0725 against 0.0469 for USDJPY 10/10). The measurement has more ambiguous bars, exactly as F025 measured.
7. Limitations
- ★ Prediction ⑤ failed and the baseline turned out to be unusable. The synthetic series has no quiet periods and almost no time-outs. It is no control for this error.
- The deadline is fixed at one day. A shorter deadline gives more time-outs and a bigger error. That direction is not measured.
- Six barrier pairs are fixed. Other combinations give other factors.
- Ambiguous bars are resolved adverse-first. As F025 showed, that convention sets the level of "both lose" itself.
- No costs are included. The figures here are therefore not trading performance.
- The overlap is not removed. Entries are taken on every bar, so the observations overlap. No t value is reported and significance is not discussed.
- Only two wrong ways of counting are tried: putting time-outs into "both lose", and counting them as −(take-profit + stop-loss) in the expected value.
- Four instruments over six years. Nothing is said about other markets or other periods.
Conclusion
A straddle has five outcomes, not four. The fifth is the case where neither leg resolves, and measuring with a deadline necessarily produces it.
Pour that fifth case into "both lose" and the share rises by up to 5.14 times, a difference of up to 5.09 points. ★ What sets the factor is "time-outs ÷ true both-lose", so the smaller the true value the worse the distortion. EURUSD at 10/20 goes from 0.0036 to 0.0186.
The same holds on the expected-value side. Counting a time-out as −(take-profit + stop-loss) lowers the expected value by up to 2.0356 pips, while the actual mean of the timed-out trades has a median of 0.0000 pips. Neither barrier was reached, so the trade was simply held to the close.
★ Prediction ①, written before measuring, worked as a check. "Both win" is 0.000000 in all 16 cells with take-profit ≥ stop-loss and 0.1573 to 0.5630 in the 8 cells with take-profit < stop-loss. The prediction held on both branches, so the walk is not broken. And the constraint is the same on the random walk: geometry does not depend on the market.
Prediction ⑤ failed. The synthetic random walk produces almost no time-outs (a maximum of 0.0011), so the wrong classification produces no difference. Independent normal increments build no quiet periods. ★ This error exists because markets have quiet periods. The baseline worked by showing it cannot be used.
★ So a report of a straddle classification needs the share of the fifth case. If "both lose was such-and-such a share" is written without the time-out share beside it, the number cannot be read. And for an instrument like gold, where the time-outs are 0.0000, the same mistake does nothing. Whether the error shows depends on the data.
Data and reproduction
| Data | FX is Dukascopy-derived tick data (from 2019 onward, confirmed identical down to the millisecond, bid and ask). Gold is Dukascopy |
| Period | 2019–2024 (six years) |
| Instruments | USDJPY, EURUSD, GBPUSD, XAUUSD |
| Bars | One-hour bars, mid prices, completed bars only. No bar is made where there are no ticks |
| Entry | Close of a one-hour bar, on every bar; a buy and a sell at the same instant |
| Barriers | (take-profit, stop-loss) = (10,10) (20,10) (20,20) (20,5) (10,20) (5,20). Deadline 24 bars |
| Convention | Ambiguous bars resolved adverse-first |
| Costs | Not included |
| Verification | 検算/F027.py (--zu also writes the figures). Every figure in the text comes from 検算/F027_output.txt |
| Figures | 図/F027_zu1, 図/F027_zu2 (png, svg, English versions) |
| Random seeds | Fixed. Re-running gives the same values |
| Foundation check | _ツール/audit_bars.py (bar look-ahead, daylight saving, day boundaries). The record is _土台の検査.txt |
References
- Yamagishi, Y. (2026). How You Treat a Bar That Touches Both Barriers Is What Makes the Win Rate and the Expected Value [F025]. Zenodo. 10.5281/zenodo.22892549
- Yamagishi, Y. (2026). A Stopping Rule Changes the Shape of the Profit and Loss, Not the Direction [F026]. Zenodo. 10.5281/zenodo.22892604
Reference
Yamagishi, Y. (2026). Where You Put the Time-Outs Decides the Share of "Both Lose" [F027]. Zenodo.
DOI: 10.5281/zenodo.22892724
YOI: https://www.yamagishiyuuki.com/yoi/F027
ORCID: 0009-0006-8587-3450
PDF (English) · PDF (Japanese) · Date proof of the English PDF (OpenTimestamps .ots) · SHA256SUMS
The record page for this paper (in Japanese, with the PDFs in each language and the date proof): YOI F027. This paper is a preprint and has not been peer reviewed.