Abstract
What this paper asks is what moves and what does not when layers are cut on a magnitude — and the answer is: the magnitude moves and the direction does not. No new mathematical theorem and no new law is claimed.
First, cutting layers on a magnitude does move the size of the forward move. The fifth layer over the first runs from 1.5573 to 2.4674 times (Section 3).
Second, and this is the core. ★ But the directional information does not move. D spans −0.2727 to +0.1400 pips (a range of 0.4127), and the daily t reaches 2 in absolute value in 0 of 20 layers (Section 3).
Third, ★ putting the sign of the same quantity into the signal is where D starts to move. The sign version gives D from 0.1625 to 1.7403 pips (a range of 1.5778), with the daily t reaching 2 in 5 of 10 layers (Section 4).
Fourth, the layers are doing something; what they are not doing is separating direction. Within the same layers, "absolute D ÷ size of the forward move" has a median of 0.001912, and that share does not grow however much the magnitude does (Section 5).
Fifth, prediction ④ half failed. On the synthetic random walk even the magnitude does not move: the fifth layer over the first runs from 0.9900 to 1.0395 times (Section 6).
Sixth, ★ so the two halves come from different places. The magnitude separates because markets have volatility clustering; the direction does not separate because the quantity carries no sign. The first is a property of the market, the second is algebra (Section 6).
Scope of this paper: No new mathematical theorem and no new law is claimed — that a quantity built from absolute values carries no sign, and volatility clustering, are both known. No real course or its proponent is discussed — no real teaching material, author, or vendor is the subject here, and none is named. Trading is not discussed — no costs are included, so the figures here are not trading performance (Section 7). Four magnitude quantities are fixed — the absolute slope of a moving average, the absolute deviation, ATR, and the recent range. Other quantities give other figures (Section 7). The sign version contains drift — that its D is positive may include how the instrument moved over the period, which is not separated here (Sections 4 and 7). D and the daily t disagree in sign in some layers — days with many observations are making the overall mean, and both are printed here (Section 4). The scope is intraday and few instruments — four instruments, six years, one-hour bars. Monthly time-series momentum (dozens of markets, one to twelve month holds) is documented in the academic literature and is not contradicted here. The overlap is not removed — measurements are taken on every bar, so the observations overlap (Section 7). No forecast is claimed.
1. Notation and the question
"Only enter when the moving average is steep." "Only enter when the deviation is large." "Only enter when volatility is high." These are common filters.
| What gets said | What does not |
|---|---|
| Enter only when the slope is steep | Whether the quantity is symmetric up and down |
| Enter only when the deviation is large | Whether what moved after filtering was magnitude or direction |
| Enter only when volatility is high | Whether a series with no edge gives the same shape |
Observation 1.1: ★ A quantity built from absolute values is symmetric up and down. A slope of +2 and a slope of −2 both give 2. Rising cases and falling cases go into the same layer. That a quantity without a sign cannot call direction was measured for the ADX in [F007]. This paper extends it to four quantities.
Observation 1.2: ★ So if buys and sells are made equal in number within a layer, the directional information must cancel in principle. If a layer separates direction, that is not the quantity but some relation between the quantity and the direction.
Observation 1.3: The separator is whether the quantity used for the layers carries a sign. The layer cuts, the period, the instruments and the horizon are all held fixed, and only whether the signal carries a sign is varied.
Observation 1.4: ★ And a comparison partner is needed. Run the same layering on a series with zero directional information by construction and see how the magnitude side and the direction side move.
Question: when layers are cut on a magnitude, what moves and what does not?
2. State the quantity and the design first
Predictions (written before running)
① A magnitude is symmetric up and down, so D stays at 0 in every layer. Layers separate "how much it moves", not "which way".
② Meanwhile the magnitude side (the size of the forward move) should move a long way in the same layers. ⇒ The layers are doing something; what they are not doing is direction.
③ Using the sign of the quantity that makes the layers is where D starts to move.
④ ★ On a synthetic random walk with zero directional information, ① and ② take the same shape.
Design (declared before running and not changed during it)
| Item | Decision |
|---|---|
| Grid | One-hour bars, mid prices, completed bars only |
| Magnitude quantities | Absolute slope of the moving average (20) / absolute close − moving average (20) |
| ATR (14) / range over the last 20 bars | |
| Layers | 5 quintiles of each (cut within the same instrument and period) |
| Signal (magnitude) | Equal numbers of buys and sells within the layer (no direction) |
| Signal (sign) | The sign of the slope / the sign of the deviation (carries direction) |
| Horizon | The change over the next 24 bars (pips) |
| Measured | D = (buy − sell) / 2 / daily-clustered t / mean size of the forward move |
| Baseline | Synthetic random walk down to within-bar movement (3 series) |
| Instruments | USDJPY, EURUSD, GBPUSD, XAUUSD |
| Period | 2019–2024 |
Observation 2.1: ★ Buys and sells in the magnitude version are set by even and odd position. That does not depend on a random seed, so re-running gives the same values.
Observation 2.2: All four quantities are determined by the entry bar. The moving average, the ATR and the range are all built from completed bars only. There is no look-ahead.
Observation 2.3: The four quantities are not independent of each other. ATR and the range are close, and the absolute slope and the absolute deviation are related. This paper measures them as separate layerings and does not claim they carry separate information.
The bar counts are 36,534, 36,554, 36,535 and 34,892.
3. What moves when layers are cut on a magnitude
Calculation 3.1 D and the size of the forward move by layer (medians across four instruments)
| Quantity | Layer | Median value | Count | D | Daily t | Size of forward move |
|---|---|---|---|---|---|---|
| Absolute slope | 1 | 0.2775 | 7,298 | −0.1230 | −0.01 | 43.8575 |
| Absolute slope | 3 | 1.6337 | 7,302 | −0.2137 | −0.64 | 46.8085 |
| Absolute slope | 5 | 5.1850 | 7,300 | 0.0457 | −0.04 | 69.9133 |
| Absolute deviation | 1 | 2.8894 | 7,298 | −0.1220 | −0.25 | 44.3073 |
| Absolute deviation | 5 | 56.4100 | 7,299 | 0.0833 | 0.34 | 69.0010 |
| ATR | 1 | 10.0943 | 7,300 | −0.2466 | −1.08 | 33.0321 |
| ATR | 3 | 15.7969 | 7,300 | −0.0111 | −0.01 | 44.5605 |
| ATR | 5 | 29.7327 | 7,300 | 0.0218 | −0.60 | 81.5030 |
| Range | 1 | 40.6250 | 7,279 | −0.0702 | −0.48 | 36.2141 |
| Range | 5 | 163.3250 | 7,304 | 0.0875 | 0.20 | 77.5005 |
Calculation 3.2 End-to-end movement across the layers
| Quantity | D, end to end | Ratio of the forward move's size |
|---|---|---|
| Absolute slope | 0.1687 | 1.5941 |
| Absolute deviation | 0.2053 | 1.5573 |
| ATR | 0.2684 | 2.4674 |
| Range | 0.1576 | 2.1401 |
Observation 3.3: Prediction ② held. The size of the forward move goes from the first layer to the fifth by 1.5573 to 2.4674 times. The layers are doing something.
Observation 3.4: ★ Prediction ① held too, and this is the core. D spans −0.2727 to +0.1400 pips (a range of 0.4127), and the daily t reaches 2 in absolute value in 0 of 20 layers. Chance alone would give about 1, so zero means nothing is there.
Observation 3.5: ★ ATR separates the magnitude by 2.4674 times while moving the direction by only 0.2684 pips. The same layering separates one and not the other.
Observation 3.6: The sign of D does not line up across layers. On the absolute slope it goes −0.1230 → −0.2137 → +0.0457, back and forth. What is not monotone is spread, not effect.
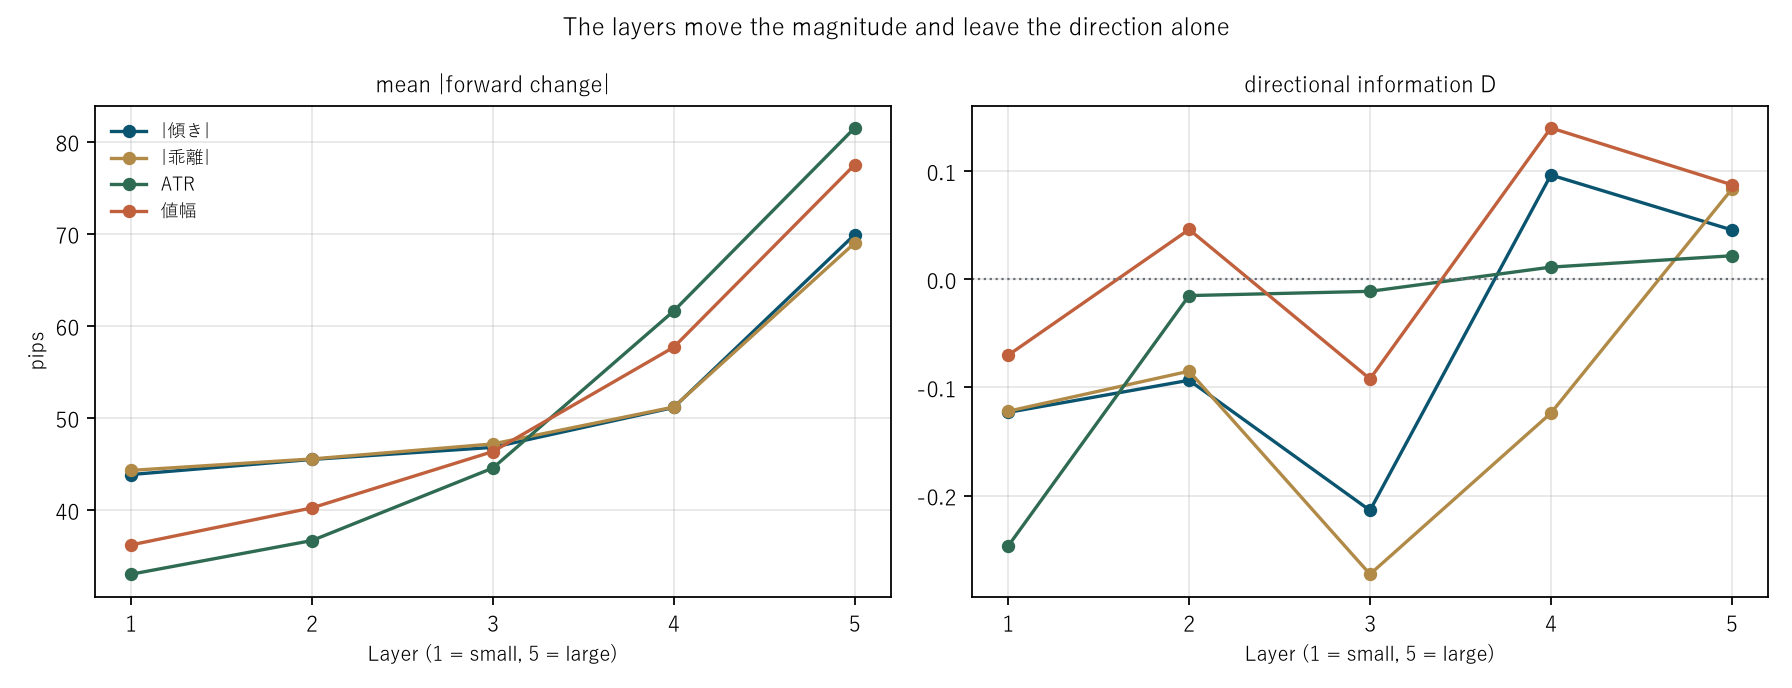
Figure 1: horizontal is the layer, vertical is pips. Left is the size of the forward move, right is the directional information D.
4. What happens when the sign of the same quantity is used
Calculation 4.1 The sign version (medians across four instruments)
| Quantity | Layer | Count | D | Daily t | Size of forward move |
|---|---|---|---|---|---|
| Sign of the slope | 1 | 7,294 | 0.8648 | 1.91 | 43.8683 |
| Sign of the slope | 2 | 7,293 | 1.7403 | 2.81 | 45.4772 |
| Sign of the slope | 3 | 7,290 | 0.8016 | 2.34 | 46.8217 |
| Sign of the slope | 5 | 7,296 | 1.7310 | −3.12 | 69.9175 |
| Sign of the deviation | 1 | 7,298 | 0.5729 | 1.32 | 44.3073 |
| Sign of the deviation | 2 | 7,298 | 1.6329 | 2.33 | 45.5501 |
| Sign of the deviation | 4 | 7,298 | 0.1625 | 0.30 | 51.1895 |
| Sign of the deviation | 5 | 7,299 | 1.0837 | −4.92 | 69.0010 |
Calculation 4.2 Magnitude version against sign version
| Quantity | Layer | Magnitude D | Sign D | Difference |
|---|---|---|---|---|
| Slope | 1 | −0.1230 | 0.8648 | 0.9878 |
| Slope | 2 | −0.0933 | 1.7403 | 1.8337 |
| Slope | 3 | −0.2137 | 0.8016 | 1.0153 |
| Slope | 5 | 0.0457 | 1.7310 | 1.6853 |
| Deviation | 1 | −0.1220 | 0.5729 | 0.6948 |
| Deviation | 3 | −0.2727 | 1.6085 | 1.8811 |
| Deviation | 4 | −0.1237 | 0.1625 | 0.2862 |
| Deviation | 5 | 0.0833 | 1.0837 | 1.0003 |
Observation 4.3: ★ Prediction ③ held. The sign version gives D from 0.1625 to 1.7403 pips (a range of 1.5778), with the daily t reaching 2 in absolute value in 5 of 10 layers.
Observation 4.4: ★ The layer cuts are exactly the same as in the magnitude version. So are the counts and the size of the forward move. All that differs is whether the signal carries a sign, and that alone moves D by 0.2862 to 1.8811 pips.
Observation 4.5: That the sign version's D is positive does not only mean trend-following worked. It may include how the instrument moved over the period. ★ The drift is not separated here.
Observation 4.6: In the sign version, D and the daily t disagree in sign in some layers. The fifth layer of the slope sign has D +1.7310 against t −3.12, and the deviation sign has +1.0837 against −4.92. ★ Days with many observations are making the overall mean, so both must be printed.
Observation 4.7: ★ So the level of the sign version is not this paper's claim. The claim is that D does not move at all in the magnitude version and starts to move the moment a sign is put in.
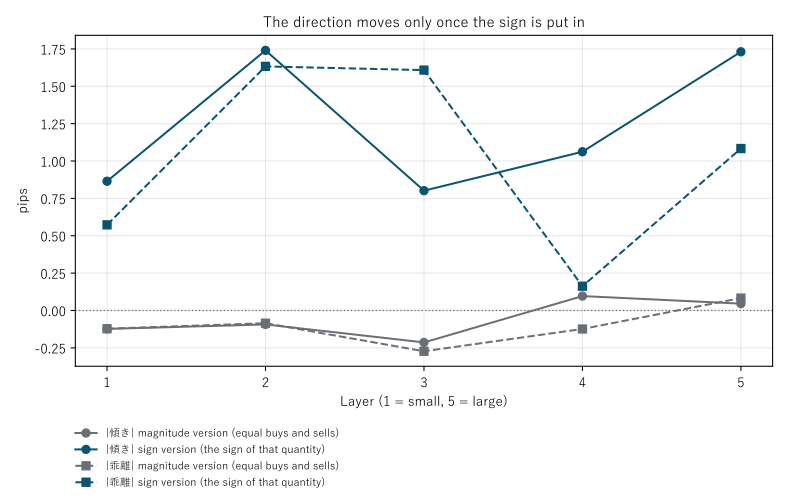
Figure 2: horizontal is the layer, vertical is D. Grey is the magnitude version (equal buys and sells), dark is the sign version (the sign of that quantity).
5. The layers are doing something — what they are not doing is direction
Calculation 5.1 The magnitude side and the direction side in the same layers
| Quantity | Layer | Size of forward move | Ratio to layer 1 | D | Absolute D ÷ size |
|---|---|---|---|---|---|
| Absolute slope | 1 | 43.8575 | 1.0000 | −0.1230 | 0.002805 |
| Absolute slope | 3 | 46.8085 | 1.0673 | −0.2137 | 0.004565 |
| Absolute slope | 5 | 69.9133 | 1.5941 | 0.0457 | 0.000653 |
| Absolute deviation | 1 | 44.3073 | 1.0000 | −0.1220 | 0.002752 |
| Absolute deviation | 2 | 45.5501 | 1.0280 | −0.0850 | 0.001865 |
Observation 5.2: ★ The magnitude grows 1.5941 times and absolute D ÷ size falls from 0.002805 to 0.000653. The directional share does not grow.
Observation 5.3: Over everything, absolute D ÷ size has a median of 0.001912 and a range of 0.000183 to 0.007465. ★ In every layer, the share of the forward move that can be taken out as direction is about two parts in a thousand.
Observation 5.4: ★ This is how "the layers are doing something" and "no direction comes out" hold together. The layers separate how far it moves by more than a factor of two, and say nothing about which way it goes.
Observation 5.5: So "enter only when volatility is high" is not selecting a place where one wins. ★ It is selecting a place where price moves a lot. Where price moves a lot, wins and losses both get larger.
6. Baseline — do the same thing on a series with zero directional information
Calculation 6.1 Measurement against synthetic random walk (layers 1 and 5)
| Quantity | Layer | D | Size of forward move | |
|---|---|---|---|---|
| Absolute slope | 1 | measured | −0.1230 | 43.8575 |
| Absolute slope | 1 | random | −0.0679 | 59.1722 |
| Absolute slope | 5 | measured | 0.0457 | 69.9133 |
| Absolute slope | 5 | random | 0.0318 | 61.5117 |
| ATR | 1 | measured | −0.2466 | 33.0321 |
| ATR | 1 | random | −0.1490 | 60.4897 |
| ATR | 5 | measured | 0.0218 | 81.5030 |
| ATR | 5 | random | 0.0796 | 59.8827 |
Calculation 6.2 End to end, measurement against random walk
| Quantity | D measured | D random | Size ratio measured | Size ratio random |
|---|---|---|---|---|
| Absolute slope | +0.1687 | +0.0997 | 1.5941 | 1.0395 |
| Absolute deviation | +0.2053 | +0.3463 | 1.5573 | 1.0032 |
| ATR | +0.2684 | +0.2286 | 2.4674 | 0.9900 |
| Range | +0.1576 | −0.0199 | 2.1401 | 1.0176 |
Observation 6.3: Prediction ④ half held. The direction side does not move on the random walk either: its D spans −0.3922 to +0.2730 pips, the same band as the measurement.
Observation 6.4: ★ But the magnitude side failed. On the synthetic random walk even the magnitude does not move: the fifth layer over the first runs from 0.9900 to 1.0395 times, nothing like the measurement's 1.5573 to 2.4674.
Observation 6.5: ★ The way it failed splits the answer in two. Independent normal increments have no volatility clustering, so the distinction between a high-ATR stretch and a low-ATR stretch is never built. The layers therefore cannot separate the magnitude.
Observation 6.6: ★ So the two halves come from different places. The magnitude separates because markets have volatility clustering (a property of the market); the direction does not separate because the quantity carries no sign (algebra).
Observation 6.7: This is the same reason the baseline could not be used in F027 and F028. The synthetic random walk is a correct control for direction and no control at all for layering on magnitude. That the baseline has no clustering was measured in [F033].
7. Limitations
- Prediction ④ half failed. On the synthetic random walk even the magnitude did not separate. This paper writes that failure and splits the two halves by origin.
- Four magnitude quantities are fixed. Other quantities give other figures, and the four are not independent of each other.
- The sign version contains drift. That its D is positive may include the drift over the period, which is not separated here.
- D and the daily t disagree in sign in some layers of the sign version. Days with many observations are making the overall mean.
- The synthetic random walk has no volatility clustering, so it is no control for layering on magnitude.
- No costs are included. The figures here are therefore not trading performance.
- The overlap is not removed. Measurements are taken on every bar, so the observations overlap.
- Four instruments over six years. Nothing is said about other markets or other periods.
Conclusion
The absolute slope of a moving average, the absolute deviation, ATR, and the recent range. Cutting quintiles on these four magnitude quantities moves the size of the forward move by 1.5573 to 2.4674 times. The layers are doing something.
But D spans only 0.4127 pips, and the daily t reaches 2 in absolute value in 0 of 20 layers. ★ ATR separates the magnitude by 2.4674 times while moving the direction by only 0.2684 pips.
Putting the sign of the same quantity into the signal is where D starts to move. The sign version gives D from 0.1625 to 1.7403 pips, with the daily t reaching 2 in 5 of 10 layers. The layer cuts and the counts are identical; all that differs is whether the signal carries a sign.
★ A magnitude is symmetric up and down. A slope of +2 and one of −2 give the same absolute value, so rising cases and falling cases go into the same layer. No direction comes out not because the market is that way but because the quantity is built that way.
Prediction ④ half failed. On the synthetic random walk even the magnitude does not move (0.9900 to 1.0395 times). Independent normal increments have no volatility clustering, so the distinction between a high-ATR stretch and a low-ATR stretch is never built.
★ So the two halves come from different places: the magnitude separates because markets have volatility clustering, and the direction does not separate because the quantity carries no sign. The first is a property of the market, the second is algebra.
"Enter only when volatility is high" is not selecting a place where one wins. It is selecting a place where price moves a lot. In every layer, the share of the forward move that can be taken out as direction has a median of 0.001912 — about two parts in a thousand.
Data and reproduction
| Data | FX is Dukascopy-derived tick data (from 2019 onward, confirmed identical down to the millisecond, bid and ask). Gold is Dukascopy |
| Period | 2019–2024 (six years) |
| Instruments | USDJPY, EURUSD, GBPUSD, XAUUSD |
| Bars | One-hour bars, mid prices, closes of completed bars only. No bar is made where there are no ticks |
| Magnitude quantities | Absolute slope of SMA(20) / absolute deviation / ATR(14) / range over the last 20 bars |
| Layers | Quintiles of each. Horizon 24 bars |
| Signals | Magnitude version: equal buys and sells within the layer (even and odd position). Sign version: the sign of that quantity |
| Costs | Not included |
| Verification | 検算/F030.py (--zu also writes the figures). Every figure in the text comes from 検算/F030_output.txt |
| Figures | 図/F030_zu1, 図/F030_zu2 (png, svg, English versions) |
| Random seeds | Fixed. Re-running gives the same values |
| Foundation check | _ツール/audit_bars.py (bar look-ahead, daylight saving, day boundaries). The record is _土台の検査.txt |
References
- Yamagishi, Y. (2026). ADX Carries No Direction, So It Cannot Tell You Which Way [F007]. Zenodo. 10.5281/zenodo.22881623
- Yamagishi, Y. (2026). Where You Put the Time-Outs Decides the Share of "Both Lose" [F027]. Zenodo. 10.5281/zenodo.22892724
- Yamagishi, Y. (2026). The Distance to the Level Ahead Moves the Time-Outs, Not the Win Rate [F028]. Zenodo. 10.5281/zenodo.22892891
- Yamagishi, Y. (2026). A Synthetic Random Walk Has No Volatility Clustering [F033]. Zenodo. 10.5281/zenodo.22893674
Reference
Yamagishi, Y. (2026). Layering on a Magnitude Does Not Produce a Direction [F030]. Zenodo.
DOI: 10.5281/zenodo.22893420
YOI: https://www.yamagishiyuuki.com/yoi/F030
ORCID: 0009-0006-8587-3450
PDF (English) · PDF (Japanese) · Date proof of the English PDF (OpenTimestamps .ots) · SHA256SUMS
The record page for this paper (in Japanese, with the PDFs in each language and the date proof): YOI F030. This paper is a preprint and has not been peer reviewed.