Abstract
What this paper asks is whether the maximum drawdown is a property of the trades or of their order — and the answer is: of their order. No new mathematical theorem and no new law is claimed.
First, shuffling moves neither the total, nor the mean, nor the win rate. The same numbers are added in a different sequence, so if these move, the arithmetic is broken (Section 3).
Second, and this is the core. ★ But the maximum drawdown moves a long way. Shuffling alone takes it from 1.77 to 5.39 times its smallest value (median 4.23 times), a range of 2,713.40 to 12,267.52 pips (Section 4).
Third, the actual order sits inside that distribution. The percentile of the maximum drawdown has a median of 0.5330 and a range of 0.0060 to 0.8760, and it exceeds 0.95 in 0 of 16 cases (Section 5).
Fourth, only one case landed at an extreme, and it was the good side. EURUSD on the sign of the deviation has a percentile of 0.0060 — a smaller drawdown than any of the shuffles (Section 5).
Fifth, ★ on a synthetic random walk, shuffling alone still moves the maximum drawdown by a median of 4.28 times, barely different from the measurement's 4.23 times. This range is not a property of the market but the arithmetic of shuffling (Section 6).
Sixth, the longest stretch under water takes the same shape. Its percentile has a median of 0.3745 and a range of 0.0170 to 0.9730, so the actual order is inside the distribution here too (Section 5).
Scope of this paper: No new mathematical theorem and no new law is claimed — permutation tests and the definition of drawdown are both known. No real course or its proponent is discussed — no real teaching material, author, or vendor is the subject here, and none is named. Trading is not discussed — no costs are included, so the figures here are not trading performance (Section 7). The position size is fixed — compounding or risk-proportional sizing changes how the maximum drawdown comes out; this paper uses one fixed unit (Section 7). One way of building trades is fixed — one entry every 24 bars, exited 24 bars later; other constructions give other counts and ranges (Sections 2 and 7). The four directions are not independent — always-buy and always-sell are the same trades with the sign flipped (Section 3). There are 1,000 shuffles — the percentile resolves to one part in a thousand and nothing finer can be said (Section 7). The scope is intraday and few instruments — four instruments, six years, one-hour bars. Monthly time-series momentum (dozens of markets, one to twelve month holds) is documented in the academic literature and is not contradicted here. No forecast is claimed.
1. Notation and the question
An equity curve is shown and the text reads "the maximum drawdown was N pips".
| What gets reported | What does not |
|---|---|
| The maximum drawdown | What it would be if the same trades were shuffled |
| The shape of the equity curve | Where the actual order lands in that distribution |
| The longest stretch under water | What the same thing does on a series with no edge |
Observation 1.1: ★ A total does not depend on the order of addition. Shuffle as you like and it stays the same. That is what addition is, not a measurement result.
Observation 1.2: ★ But the maximum drawdown looks at the path. It deepens when losses arrive together and shallows when they are spread out. The same set of trades gives different values under different orders.
Observation 1.3: The separator is the order in which the trades are placed. The set of trades, the count and the total are all held fixed, and only the order is varied.
Observation 1.4: ★ Where the actual order lands in the distribution says whether the market has order structure. In the middle means nothing special. At an extreme means losses arrive together.
Question: is the maximum drawdown a property of the trades or of their order?
2. State the quantity and the design first
Predictions (written before running)
① The total does not move at all under shuffling (addition does not depend on order).
② The maximum drawdown moves a long way.
③ ★ The actual order's maximum drawdown sits inside the shuffled distribution. If it does not (if it lands at an extreme), the market has order structure.
④ On a synthetic random walk the actual order should land right around the middle (independent increments have no order structure).
Design (declared before running and not changed during it)
| Item | Decision |
|---|---|
| Trades | Enter at the close of a one-hour bar, exit 24 bars later |
| One entry every 24 bars (no overlap) | |
| Directions | Always buy / always sell / sign of the SMA(20) slope / sign of the deviation |
| Sets | Instrument × direction = 16. 1,452 to 1,522 trades per instrument |
| Shuffles | 1,000 (fixed seed) |
| Measured | Total / maximum drawdown / longest stretch under water |
| Position size | One fixed unit (no compounding) |
| Costs | Not included |
| Baseline | Synthetic random walk down to within-bar movement (3 series) |
| Instruments | USDJPY, EURUSD, GBPUSD, XAUUSD |
| Period | 2019–2024 |
Observation 2.1: ★ With the overlap removed, the equity curve can simply be stacked up. A 24-bar hold with one entry every 24 bars means positions never overlap.
Observation 2.2: ★ Always-buy and always-sell are the same trades with the sign flipped. Whether their totals match with opposite signs is itself a check.
Observation 2.3: The position size is one fixed unit. With compounding or risk-proportional sizing, later trades weigh more on the account and the effect of order grows further. This paper measures on the side that does not inflate it.
3. What shuffling does not move (a check)
Calculation 3.1 Total, mean and win rate
| Instrument | Direction | Count | Total | Mean | Win rate |
|---|---|---|---|---|---|
| USDJPY | always buy | 1,521 | 4781.85 | 3.1439 | 0.5345 |
| USDJPY | always sell | 1,521 | −4781.85 | −3.1439 | 0.4655 |
| USDJPY | sign of slope | 1,521 | 2838.85 | 1.8664 | 0.5082 |
| EURUSD | always buy | 1,522 | −995.05 | −0.6538 | 0.4895 |
| EURUSD | always sell | 1,522 | 995.05 | 0.6538 | 0.5092 |
| GBPUSD | always buy | 1,521 | −80.85 | −0.0532 | 0.5108 |
| GBPUSD | sign of slope | 1,521 | 1660.65 | 1.0918 | 0.5266 |
| XAUUSD | always buy | 1,452 | 13172.91 | 9.0723 | 0.5324 |
| XAUUSD | always sell | 1,452 | −13172.91 | −9.0723 | 0.4676 |
| XAUUSD | sign of deviation | 1,452 | 1464.17 | 1.0084 | 0.4876 |
Observation 3.2: ★ The totals of always-buy and always-sell match exactly with opposite signs: 4781.85 against −4781.85 for USDJPY, 13172.91 against −13172.91 for XAUUSD. They are the same trades with the sign flipped, so a mismatch would mean broken arithmetic.
Observation 3.3: ★ The total, the mean and the win rate do not move at all under shuffling, by definition. The same numbers are simply added in a different sequence.
Observation 3.4: XAUUSD always-buy totals 13172.91 pips. That means gold rose over six years, not that a method worked. The drift is not separated here.
Observation 3.5: The win rate stays between 0.4655 and 0.5345 for every direction. ★ With the win rate near 0.5 throughout, the total ranges from +13172.91 pips to −4781.85.
4. What shuffling does move
Calculation 4.1 The actual maximum drawdown against the shuffled distribution (pips)
| Instrument | Direction | Actual | Shuffled median | Minimum | Maximum |
|---|---|---|---|---|---|
| USDJPY | always buy | 2247.70 | 2089.42 | 1120.20 | 4604.10 |
| USDJPY | sign of slope | 2725.30 | 2430.25 | 1335.65 | 4982.45 |
| EURUSD | always buy | 2788.90 | 2459.87 | 1307.15 | 4541.75 |
| EURUSD | sign of deviation | 874.70 | 1527.05 | 846.95 | 3560.35 |
| GBPUSD | always buy | 3584.20 | 3085.05 | 1536.60 | 6268.80 |
| GBPUSD | sign of slope | 3120.60 | 2500.72 | 1229.60 | 5230.35 |
| XAUUSD | always buy | 4483.68 | 4669.50 | 2435.18 | 11487.06 |
| XAUUSD | always sell | 15120.63 | 15915.08 | 12950.51 | 22957.23 |
| XAUUSD | sign of deviation | 9422.06 | 7023.74 | 3355.60 | 15623.12 |
Observation 4.2: ★ This is the core. Shuffling alone takes the maximum drawdown from 1.77 to 5.39 times its smallest value (median 4.23 times).
Observation 4.3: The range (shuffled maximum minus minimum) runs from 2,713.40 to 12,267.52 pips. ★ The same trades and the same total can produce equity curves this different.
Observation 4.4: ★ USDJPY always-buy comes out anywhere from 1,120.20 to 4,604.10 pips under shuffling alone. The sentence "the maximum drawdown was 2,247.70 pips" reports one value out of that spread.
Observation 4.5: The total does not budge while the maximum drawdown moves this far. ★ Both come from the same equity curve, yet one does not depend on the order at all and the other depends on nothing else.
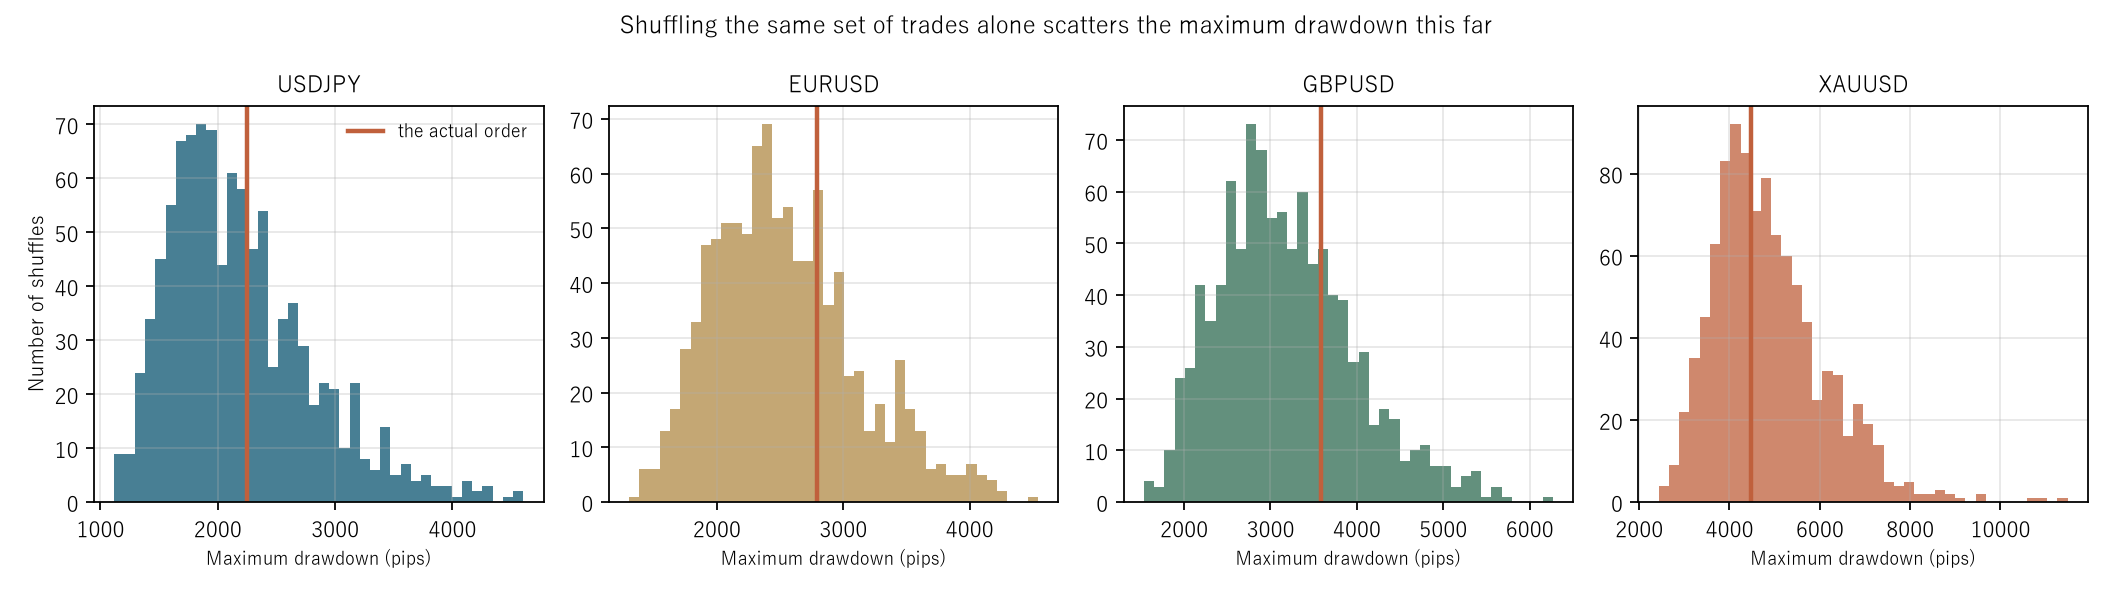
Figure 1: horizontal is the maximum drawdown, vertical is the number of shuffles. The vertical line is the actual order's value (always buy).
5. Where the actual order lands in the distribution
Calculation 5.1 Percentiles (0.5 is the middle; near 1.0 means the actual order was bad)
| Instrument | Direction | Drawdown percentile | Longest under water | Shuffled median | Its percentile |
|---|---|---|---|---|---|
| USDJPY | always buy | 0.6070 | 636 | 451.5 | 0.8200 |
| USDJPY | sign of slope | 0.6630 | 300 | 614.0 | 0.0370 |
| EURUSD | always buy | 0.7050 | 1,002 | 1185.0 | 0.3430 |
| EURUSD | sign of slope | 0.1140 | 258 | 575.0 | 0.0170 |
| EURUSD | sign of deviation | 0.0060 | 316 | 618.5 | 0.0380 |
| GBPUSD | always buy | 0.7240 | 898 | 993.5 | 0.4060 |
| GBPUSD | sign of slope | 0.7720 | 1,068 | 718.0 | 0.8510 |
| XAUUSD | always buy | 0.4450 | 812 | 387.0 | 0.9730 |
| XAUUSD | always sell | 0.3260 | 1,386 | 1387.0 | 0.4910 |
| XAUUSD | sign of deviation | 0.8760 | 936 | 807.5 | 0.6430 |
Observation 5.2: ★ Prediction ③ held. The drawdown percentile has a median of 0.5330 and a range of 0.0060 to 0.8760, and it exceeds 0.95 in 0 of 16 cases.
Observation 5.3: ★ The actual order is not special. If losses arrived together the percentile would push toward 1.0, and it does not.
Observation 5.4: Only one case landed at an extreme, and it was the good side. EURUSD on the sign of the deviation has a percentile of 0.0060 — a smaller drawdown than any of the 1,000 shuffles.
Observation 5.5: The longest stretch under water takes the same shape, with a median percentile of 0.3745 and a range of 0.0170 to 0.9730. Only XAUUSD always-buy pushes to 0.9730, one case out of 16.
Observation 5.6: With 1,000 shuffles the percentile resolves to one part in a thousand. Nothing finer can be said.
6. Baseline — do the same thing on a series with zero directional information
Calculation 6.1 Measurement against synthetic random walk (medians across four instruments)
| Direction | Drawdown percentile | Drawdown ÷ shuffled median | |
|---|---|---|---|
| always buy | measured | 0.6560 | 1.1494 |
| always buy | random | 0.3745 | 1.0812 |
| always sell | measured | 0.4090 | 0.9613 |
| always sell | random | 0.4955 | 0.9573 |
| sign of slope | measured | 0.4980 | 1.1855 |
| sign of slope | random | 0.4600 | 1.0316 |
| sign of deviation | measured | 0.6130 | 1.0831 |
| sign of deviation | random | 0.2975 | 0.9729 |
Observation 6.2: ★ Prediction ④ held. The random walk's percentile has a median of 0.3915 and a range of 0.0440 to 0.9820 — the same band as the measurement.
Observation 6.3: ★ And the shuffling range is the same too. On the synthetic random walk, shuffling alone still moves the maximum drawdown by a median of 4.28 times, barely different from the measurement's 4.23.
Observation 6.4: ★ So this range is not a property of the market. It is the arithmetic of shuffling. A series known to have no order structure moves just as much. What this baseline is zero about was measured in [F033].
Observation 6.5: Percentiles above 0.95 occur in 4 of 48 random-walk cases. Chance alone would give 2 or 3, so that is not special. The measurement gives 0 of 16.
Observation 6.6: Only the measurement's always-buy has a higher percentile than the random walk's (0.6560 against 0.3745). ★ Losses may cluster somewhat, but with 0 of 16 above 0.95 this paper does not claim it as an effect.
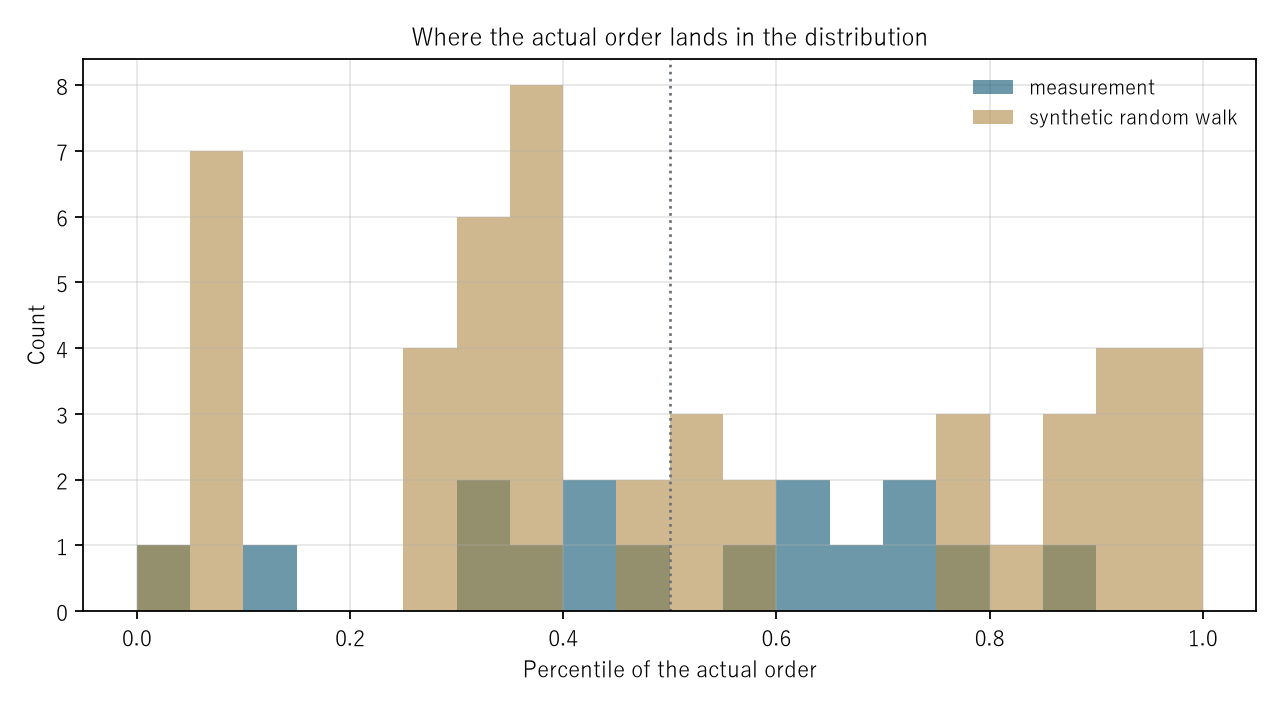
Figure 2: horizontal is the percentile of the actual order, vertical is the count. The darker histogram is the measurement, the lighter one the synthetic random walk, and the dotted line is the middle (0.5).
7. Limitations
- The position size is one fixed unit. With compounding or risk-proportional sizing, later trades weigh more on the account and the effect of order grows further. This paper measures on the side that does not inflate it.
- One way of building trades is fixed: one entry every 24 bars, exited 24 bars later. Other constructions give other counts and ranges.
- The four directions are not independent. Always-buy and always-sell are the same trades with the sign flipped.
- There are 1,000 shuffles. The percentile resolves to one part in a thousand and nothing finer can be said.
- The drift is not separated. XAUUSD always-buy totalling 13,172.91 pips means gold rose over six years.
- No costs are included. The figures here are therefore not trading performance.
- The longest stretch under water is counted in trades, not time, so it changes meaning if the spacing of trades changes.
- Four instruments over six years. Nothing is said about other markets or other periods.
Conclusion
The same set of trades was shuffled 1,000 times. The total, the mean and the win rate do not move at all, because the same numbers are simply added in a different sequence. The totals of always-buy and always-sell come out as 4781.85 and −4781.85, exactly opposite, confirming the arithmetic is not broken.
But shuffling alone takes the maximum drawdown from 1.77 to 5.39 times its smallest value (median 4.23 times), a range of 2,713.40 to 12,267.52 pips. ★ USDJPY always-buy comes out anywhere from 1,120.20 to 4,604.10 pips on the same trades with the same total.
The maximum drawdown is a property not of the trades but of their order.
★ And the actual order is not special. The drawdown percentile has a median of 0.5330 and exceeds 0.95 in 0 of 16 cases. Only one case landed at an extreme, at 0.0060 — the good side. The longest stretch under water has a median percentile of 0.3745, inside the distribution as well.
★ On a synthetic random walk, shuffling alone still moves the maximum drawdown by a median of 4.28 times, barely different from the measurement's 4.23. This range is not a property of the market but the arithmetic of shuffling.
So a report of a maximum drawdown needs the distribution from shuffling the same trades. ★ That single figure is one realization out of a spread four or five times as wide. And this paper measures with a fixed position size: with compounding, the effect of order grows further.
Data and reproduction
| Data | FX is Dukascopy-derived tick data (from 2019 onward, confirmed identical down to the millisecond, bid and ask). Gold is Dukascopy |
| Period | 2019–2024 (six years) |
| Instruments | USDJPY, EURUSD, GBPUSD, XAUUSD |
| Bars | One-hour bars, mid prices, closes of completed bars only. No bar is made where there are no ticks |
| Trades | One entry every 24 bars, exited 24 bars later (no overlap). 1,452 to 1,522 per instrument |
| Directions | Always buy / always sell / sign of the SMA(20) slope / sign of the deviation |
| Shuffles | 1,000, fixed seed |
| Position size | One fixed unit. No costs |
| Verification | 検算/F031.py (--zu also writes the figures). Every figure in the text comes from 検算/F031_output.txt |
| Figures | 図/F031_zu1, 図/F031_zu2 (png, svg, English versions) |
| Random seeds | Fixed. Re-running gives the same values |
| Foundation check | _ツール/audit_bars.py (bar look-ahead, daylight saving, day boundaries). The record is _土台の検査.txt |
References
- Yamagishi, Y. (2026). A Synthetic Random Walk Has No Volatility Clustering [F033]. Zenodo. 10.5281/zenodo.22893674
Reference
Yamagishi, Y. (2026). The Maximum Drawdown Belongs to the Order of the Trades [F031]. Zenodo.
DOI: 10.5281/zenodo.22893510
YOI: https://www.yamagishiyuuki.com/yoi/F031
ORCID: 0009-0006-8587-3450
PDF (English) · PDF (Japanese) · Date proof of the English PDF (OpenTimestamps .ots) · SHA256SUMS
The record page for this paper (in Japanese, with the PDFs in each language and the date proof): YOI F031. This paper is a preprint and has not been peer reviewed.