Abstract
What this paper asks is what gets selected when a quantity is normalized by a recent statistic — and the answer is that the denominator is being selected along with the numerator. No new mathematical theorem and no new law is claimed.
First, the top of the divided quantity and the top of the undivided quantity overlap only about half. The overlap is 0.4968 at N = 16 and 0.6695 at N = 256 (Section 3).
Second, ★ in the top of the divided quantity the denominator is smaller than the whole. In the top 5% by z the denominator is 0.6327 to 0.9330 times the whole. In the top by the undivided quantity it is 1.2989 to 1.4307 times (Section 3).
Third, and this is the core of the paper: ★ dividing drops the layer ratio to almost 1. Selecting without dividing gives a forward move 1.3795 times the whole; selecting after dividing gives 1.0440. Undivided ÷ divided has a median of 1.3081 (Section 4).
Fourth, ★ selecting by the denominator alone puts the layer ratio below 1. The bottom 5% by the denominator gives 0.6635. Dividing mixes this "pick the small ones" in with the numerator (Section 4).
Fifth, ★ the distribution of z differs sharply by hour. At N = 64 the median z runs from 0.3222 at 21:00 UTC to 1.3972 at 14:00 UTC, a factor of 4.3363. The denominator's window straddles hours (Section 5).
Sixth, ★ on a synthetic random walk all of this disappears. Undivided ÷ divided is 0.9969 and the hourly spread is 1.1260. So what this paper measures is specific to a series that has volatility clustering (Section 6).
Scope of this paper: no new mathematical theorem and no new law is claimed — normalization, volatility clustering and the intraday pattern of volatility are all known. No real course, author, or vendor is the subject here, and none is named. Normalization is not rejected — the paper measures what it brings in and does not say it should not be done (Section 7). Direction is not measured — only magnitude; buy and sell never appear (Section 7). No trading is discussed — neither cost nor performance is measured (Section 7). One numerator and one denominator are fixed — the absolute move of the previous bar and the standard deviation of the last N bars (Section 7). No mechanism for the hourly effect is offered (Section 7). The scope is intraday and few instruments — four instruments over six years on one-hour bars. Results documented at longer holding periods, such as monthly time-series momentum, are not contradicted. No prediction is claimed.
1. Notation and the question
"Normalized by dividing by a recent average." Indicators do this all the time.
| What gets said | What does not get said |
|---|---|
| Normalized, so the instruments line up | What the denominator brings in |
| Enter when z is large | Whether that is "a large numerator" or "a small denominator" |
| Normalizing is a neutral preprocessing step | That which moments get selected changes before and after |
Observation 1.1: ★ Division puts both the numerator and the denominator into the answer. A large z may mean a large numerator, or it may mean a small denominator.
Observation 1.2: And the denominator is built from "the last N bars". ★ So z always brings in the state of the market up to N bars back.
Observation 1.3: The separator is what you divided by. The numerator, the period, the instruments and the forward horizon are all held fixed, and only the window length N of the denominator — or whether to divide at all — is changed.
Question: when a quantity is normalized by a recent statistic, what is being selected?
2. State the quantities and the design first
Declared before the run and unchanged during it.
| Grid | 1-hour bars (mid price, completed bars only) |
| Numerator | r = |move of the previous bar| (pips) |
| Denominator | d = standard deviation of the last N moves. N = 16 / 64 / 256 |
| Quantity | z = r ÷ d |
| Top share | 5% |
| Forward horizon | 24 bars (four hours) |
| Layers | Top 5% by r / bottom 5% by d / top 5% by z |
| Baseline | Synthetic random walk down to within the bar (3 draws) |
| Separator | What you divided by (the window length N, or not dividing) |
| Instruments and period | USDJPY, EURUSD, GBPUSD, XAUUSD / 2019–2024 |
Observation 2.1: ★ The denominator is built up to the previous bar. Including bar i would put that bar's own size into its denominator, which is look-ahead.
Observation 2.2: ★ Including "bottom 5% by d" is the point. Without seeing what the denominator alone selects, there is no way to tell what the division mixed together.
Observation 2.3: Usable points run from 34,611 to 36,273. The mean forward move is 36.3662 pips for EURUSD and 129.3685 for XAUUSD.
Predictions (written before measuring)
① The top by z overlaps the top by the undivided move only about half.
② In the top by the divided quantity, the denominator is smaller than the whole (that is, quiet moments are being selected).
③ The forward-move ratio is smaller for the z layer than for the undivided layer.
④ The distribution of z differs by hour (the denominator's window straddles hours).
⑤ On a synthetic random walk the gap between the z layer and the undivided layer shrinks.
3. What the top by z is selecting
The same top 5%, selected by the undivided quantity and by the divided one.
Calculation 3.1 Overlap, and the numerator and denominator of the selected set (median of four instruments)
| N | Overlap | r of the z top | d of the z top | r of the r top | d of the r top |
|---|---|---|---|---|---|
| 16 | 0.4968 | 3.7525 | 0.6327 | 4.8803 | 1.4307 |
| 64 | 0.6022 | 4.1063 | 0.8377 | 4.8793 | 1.3736 |
| 256 | 0.6695 | 4.3332 | 0.9330 | 4.8758 | 1.2989 |
Observation 3.2: Prediction ① held. The overlap runs from 0.4968 to 0.6695, with a median of 0.6022. ★ For the same "top 5%", nearly half the members change depending on whether you divide.
Observation 3.3: ★ Prediction ② held, and the direction is exactly opposite. In the z top the denominator is 0.6327 to 0.9330 times the whole — smaller. In the r top it is 1.2989 to 1.4307 times — larger.
Observation 3.4: ★ So dividing brings "a medium-sized move during a quiet stretch" into the top. The numerator of the z top is 3.7525 to 4.3332 times the whole, below the r top's 4.8758 to 4.8803. Points that lost on the numerator got in on the smallness of the denominator.
Observation 3.5: The longer N is, the closer it gets to not dividing. The overlap goes 0.4968 → 0.6022 → 0.6695 and the denominator ratio 0.6327 → 0.8377 → 0.9330. ★ A longer window makes the denominator stop moving, and the division stops doing anything.
4. The layer ratio under three layerings
Layer ratio = the four-hour forward move of the selected side ÷ the whole.
Calculation 4.1 Three layerings (median of four instruments)
| N | Top by r | Top by z | Bottom by d | r ÷ z |
|---|---|---|---|---|
| 16 | 1.3795 | 1.0440 | 0.6635 | 1.3213 |
| 64 | 1.3789 | 1.0541 | 0.6020 | 1.3081 |
| 256 | 1.3795 | 1.1145 | 0.6016 | 1.2378 |
Observation 4.2: ★ This is the core of the paper: 1.3795 without dividing, 1.0440 with — that is, the same as the whole. Prediction ③ held.
Observation 4.3: ★ Selecting by the denominator alone puts it below 1. The bottom 5% by d gives 0.6635 down to 0.6016. After a quiet stretch, what follows is quiet too.
Observation 4.4: ★ Dividing mixes those two. The numerator pulls above 1 and the denominator pulls below 1, and the z layer settles near 1.
Observation 4.5: The same holds instrument by instrument. USDJPY gives 1.6855 by r, 1.0410 by z and 0.5387 by d. For EURUSD the z layer ratio is 0.9769, below 1.
Observation 4.6: Lengthening N brings the z layer ratio partly back: 1.0440 → 1.0541 → 1.1145. ★ The less the denominator moves, the closer it gets to not dividing.
Observation 4.7: ★ That layering by magnitude separates the forward move, and does not move with the grid, was measured in [F035]. What this paper shows is that inserting a division makes that separation almost disappear.
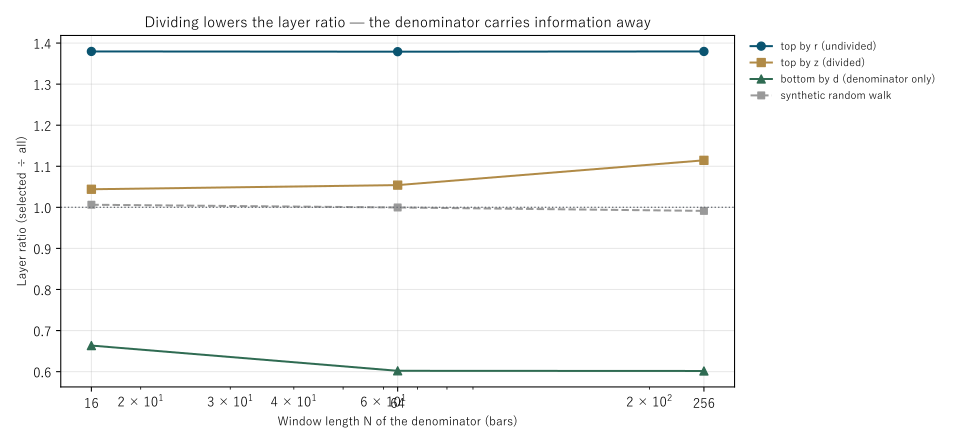
Figure 1: window length N of the denominator on the horizontal axis and the layer ratio on the vertical. From the top: top by r (undivided), top by z (divided), bottom by d (denominator only), and the grey dashed line for z on the synthetic random walk. The dotted line is 1, where selecting tells you nothing about the forward move.
5. The distribution of z depends on the window and the hour
Calculation 5.1 z by N (four instruments)
| Instrument | Median at N=16 | Median at N=64 | Median at N=256 | Max at N=16 | Max at N=64 | Max at N=256 |
|---|---|---|---|---|---|---|
| USDJPY | 0.8518 | 0.7087 | 0.6311 | 77.5291 | 54.2396 | 39.6234 |
| EURUSD | 0.7899 | 0.6735 | 0.6247 | 45.4594 | 34.4802 | 19.5921 |
| GBPUSD | 0.7873 | 0.6813 | 0.6312 | 38.0312 | 27.9930 | 35.0643 |
| XAUUSD | 0.7954 | 0.6681 | 0.6191 | 52.1277 | 36.3213 | 38.2047 |
Observation 5.2: The median z runs from 0.6279 to 0.7927 depending on N. ★ A condition like "once z exceeds 1" has no meaning until N is named.
Calculation 5.3 Median z by hour (median of four instruments, N=64)
| Hour (UTC) | Median z | Hour (UTC) | Median z |
|---|---|---|---|
| 04:00 | 0.4188 | 13:00 | 1.3755 |
| 07:00 | 1.0709 | 14:00 | 1.3972 |
| 12:00 | 1.1784 | 21:00 | 0.3222 |
Observation 5.4: ★ Prediction ④ held. The median z runs from 0.3222 at 21:00 UTC to 1.3972 at 14:00 UTC, a factor of 4.3363.
Observation 5.5: ★ The reason is that the denominator's window straddles hours. When a busy stretch follows a quiet one, the denominator is still quiet and z comes out large.
Observation 5.6: Changing N does not remove it. The hourly max ÷ min is 5.3367 (N=16), 4.5706 (N=64) and 4.2731 (N=256). ★ A longer window shrinks it a little; it does not disappear.
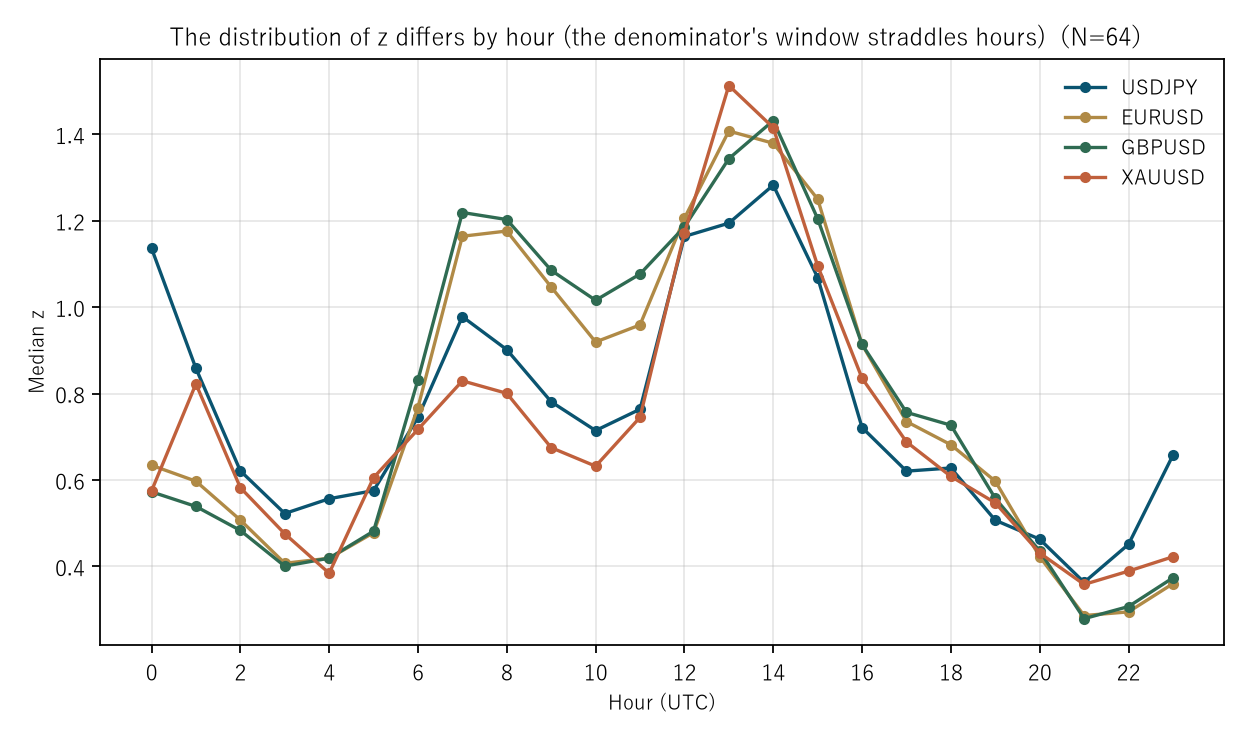
Figure 2: hour (UTC) on the horizontal axis and the median z on the vertical. Each instrument is drawn in its own colour (N=64). All four have the same shape.
6. The baseline — the same procedure on a synthetic random walk
A series with, by construction, no volatility clustering.
Calculation 6.1 Measurement against synthetic random walk
| N | Overlap, measurement | Overlap, random walk | d of the z top, measurement | d of the z top, random walk |
|---|---|---|---|---|
| 16 | 0.4968 | 0.6317 | 0.6327 | 0.8112 |
| 64 | 0.6022 | 0.8106 | 0.8377 | 0.9500 |
| 256 | 0.6695 | 0.9029 | 0.9330 | 0.9870 |
| N | r layer, meas. | z layer, meas. | r÷z, meas. | r layer, RW | z layer, RW | r÷z, RW |
|---|---|---|---|---|---|---|
| 16 | 1.3795 | 1.0440 | 1.3213 | 0.9972 | 1.0063 | 0.9909 |
| 64 | 1.3789 | 1.0541 | 1.3081 | 0.9965 | 0.9997 | 0.9969 |
| 256 | 1.3795 | 1.1145 | 1.2378 | 0.9940 | 0.9914 | 1.0026 |
Observation 6.2: ★ Prediction ⑤ held. On the synthetic random walk the layer ratio is 1 whether you divide or not. The r÷z median is 0.9969, clearly different from the measurement's 1.3081.
Observation 6.3: ★ On the random walk even the r layer gives only 0.9972. With no clustering, the moment after a large move is not special. That was measured in [F033].
Observation 6.4: ★ The hourly effect disappears too. The max ÷ min is 4.5706 on the measurement against 1.1260 on the random walk. The synthetic series has no hours, so this is expected — which makes it a check.
Observation 6.5: The overlap is higher on the random walk as well: 0.9029 against the measurement's 0.6695 at N=256. ★ With no clustering the denominator is nearly constant, so dividing barely changes the ranking.
Observation 6.6: ★ So what this paper measures is specific to a series with volatility clustering. It is not a property of division itself.
7. Limitations
- Normalization is not rejected. This paper measures what it brings in and does not say it should not be done.
- Direction is not measured. Only magnitude; buy and sell never appear.
- No trading is discussed. Neither cost nor performance is measured.
- One numerator is fixed: \|the move of the previous bar\|.
- One denominator is fixed: the standard deviation of the last N bars, not an ATR or a median absolute deviation.
- No mechanism for the hourly effect is offered. The window straddling hours is a plausible reading, but it is not decomposed.
- The top share is fixed at 5%. Other shares would give different numbers.
- Four instruments, six years, one-hour bars. Nothing is claimed about other markets or other periods.
Conclusion
"Normalized by dividing by a recent average." Indicators do this all the time. But division puts both the numerator and the denominator into the answer.
The same top 5% was selected with and without dividing. The overlap runs from 0.4968 to 0.6695 — nearly half the members change.
★ And the direction is exactly opposite. In the top by the divided quantity the denominator is 0.6327 to 0.9330 times the whole — small — while in the top by the undivided quantity it is 1.2989 to 1.4307 — large. Dividing brings "a medium-sized move during a quiet stretch" into the top.
★ As a result the layer ratio drops to almost 1. Selecting without dividing gives a forward move 1.3795 times the whole; selecting after dividing gives 1.0440. Undivided ÷ divided has a median of 1.3081.
★ Selecting by the denominator alone puts it below 1. The bottom 5% by d gives 0.6635. After a quiet stretch, what follows is quiet too. So the division is mixing a numerator that pulls above 1 with a denominator that pulls below it.
★ And z brings in the hour. At N = 64 the median z runs from 0.3222 at 21:00 UTC to 1.3972 at 14:00 UTC, a factor of 4.3363. The denominator's window straddles hours, so when a busy stretch follows a quiet one, z comes out large. Lengthening the window only shrinks it from 5.3367 to 4.2731; it does not disappear.
★ On a synthetic random walk all of this disappears. Undivided ÷ divided is 0.9969 and the hourly spread is 1.1260. With no clustering the denominator is nearly constant, so dividing barely changes the ranking.
So what is needed when writing "normalized" is what you divided by. ★ The window length of the denominator is not a detail of preprocessing: it decides which moments get selected. And selecting on the divided quantity makes the difference that was visible without it almost disappear.
Data and reproduction
| Data | Foreign exchange from Dukascopy-derived ticks (from 2019 onward, matching to the millisecond, bid and ask, has been verified). Gold from Dukascopy |
| Period | 2019–2024 (six years) |
| Instruments | USDJPY, EURUSD, GBPUSD, XAUUSD |
| Bars | 1-hour, mid price, closes of completed bars only. Bars with no ticks are not created |
| Numerator | r = |move of the previous bar| (pips) |
| Denominator | d = standard deviation of the last N moves (N = 16, 64, 256), built up to the previous bar |
| Quantity | z = r ÷ d |
| Layers | Top 5% by r / bottom 5% by d / top 5% by z |
| Forward horizon | 24 bars (four hours) |
| Baseline | Synthetic random walk down to within the bar (3 draws), built by adding differences of constant spread |
| Verification | 検算/F039.py (--zu also writes the figures). Every number in the text comes from 検算/F039_output.txt |
| Figures | 図/F039_zu1, 図/F039_zu2 (png, svg, English versions) |
| Random seeds | Fixed. Re-running gives the same values |
| Substrate check | _ツール/audit_bars.py (bar look-ahead, daylight saving, day boundary). The record is _土台の検査.txt |
References
- Yamagishi, Y. (2026). A Synthetic Random Walk Has No Volatility Clustering [F033]. Zenodo. 10.5281/zenodo.22893674
- Yamagishi, Y. (2026). Change the Grid and the Threshold Moves While the Shape Does Not [F035]. Zenodo. 10.5281/zenodo.22893852
Reference
Yamagishi, Y. (2026). Self-Normalization Brings In the Window You Divided By [F039]. Zenodo.
DOI: 10.5281/zenodo.22894073
YOI: https://www.yamagishiyuuki.com/yoi/F039
ORCID: 0009-0006-8587-3450
PDF (English) · PDF (Japanese) · Date proof of the English PDF (OpenTimestamps .ots) · SHA256SUMS
The record page for this paper (in Japanese, with the PDFs in each language and the date proof): YOI F039. This paper is a preprint and has not been peer reviewed.