Abstract
What this paper asks is how much the answer changes with when a renko turning point could have been known — and the answer is that it changes enough to flip the sign. No new mathematical theorem and no new law is claimed.
First, and this is the core of the paper: ★ the extreme bar gives 12.7910 pips and the bar where the brick completes gives −0.2713 pips. The daily t falls from 89.2402 to 1.4397. The turns, the directions and the holding time are the same; only the bar of entry differs (Section 3).
Second, the size of the look-ahead grows with the brick. The difference is 7.4202 → 13.0622 → 18.8533 pips. ★ But prediction ⑤ failed: divided by the brick size it is 2.2831 → 1.6077 → 1.1602, not constant (Sections 3 and 7).
Third, the two entries are many bars apart. The median gap is 2.0000 → 6.0000 → 15.0000 bars, and they were never on the same bar (0.0000) (Section 4).
Fourth, ★ prediction ② failed. The delay test does catch this. But delaying five bars drops it to 0.0887 at k=2 while leaving 0.5199 at k=10 (Section 5).
Fifth, ★ the way it failed is the answer. Whether it is caught is decided by "bars delayed ÷ bars of gap". At the same ratio the retained share is nearly the same whatever k is (ratio 2.5000 gives 0.0887, ratio 2.6667 gives 0.0685) (Section 5).
Sixth, ★ on a synthetic random walk the extreme bar still gives 16.8088 pips — more than the measurement's 12.7910. Look-ahead manufactures a number even when there is nothing in the market (Section 6).
Scope of this paper: no new mathematical theorem and no new law is claimed — renko charts, look-ahead and delay tests are all known. No real course, author, or vendor is the subject here, and none is named. Renko charts are not rejected — this paper treats only when a turning point could have been known (Section 7). No trading is discussed — neither cost nor slippage is included, and everything is measured on mid prices (Section 7). Predictions ② and ⑤ failed — the delay test does catch it, and the look-ahead was not proportional to the brick size (Sections 5 and 7). One way of building bricks is fixed — from bar closes, with the order inside a bar unexamined (Section 7). The scope is intraday and few instruments — four instruments over six years on five-minute bars. Results documented at longer holding periods, such as monthly time-series momentum, are not contradicted. No prediction is claimed.
1. Notation and the question
A renko "turning point" is obvious at a glance in hindsight.
| What gets said | What does not get said |
|---|---|
| It turned here | That at the time it was not yet known to be a turn |
| Enter at the turning point and you catch it | That a turn is known only after the opposite brick completes |
| It passed a delay test | That a delay test catches only look-ahead in time |
Observation 1.1: ★ A turn is known only when one brick in the opposite direction has completed. An extreme becomes an extreme only after it has been passed. That renko replaces the clock itself with a different one was measured in [F017].
Observation 1.2: Confusing the two does not advance the clock. ★ It changes which point on the same chart is counted as "could have been known". That is why it can be called look-ahead in the convention.
Observation 1.3: The separator is when the turning point could have been known. The set of turns, the directions, the holding time, the instruments and the period are all held fixed, and only the bar of entry is changed.
Question: how much does the answer change with when the turning point could have been known?
2. State the quantities and the design first
Declared before the run and unchanged during it.
| Grid | 5-minute bars (mid price, completed bars only) |
| Brick size | B = k × σ, with σ the median absolute move of one bar. k = 2 / 5 / 10 |
| Entry A | Before confirmation: the bar where the previous brick completed (near the extreme) |
| Entry B | After confirmation: the bar where the new-direction brick completed |
| Direction | The direction of the new brick (that is, after the turn) |
| Holding | 24 bars (two hours) |
| Delays | 0 / 1 / 5 bars |
| Quantities | D (pips), daily t, count, bars between the two entries |
| Baseline | Synthetic random walk down to within the bar (3 draws) |
| Separator | When the turning point could have been known |
| Instruments and period | USDJPY, EURUSD, GBPUSD, XAUUSD / 2019–2024 |
Observation 2.1: ★ Both entries use exactly the same set of turns. Only the bar of entry differs, so the difference comes not from choosing entries but from how "could have been known" was taken.
Observation 2.2: The brick size is set from each instrument's own σ, giving medians of 3.2500 / 8.1250 / 16.2500 pips across the four.
Observation 2.3: The number of turns is 57,862 / 19,378 / 6,950 by k. ★ A larger brick gives fewer turns.
Observation 2.4: Bricks are built from bar closes. ★ The order inside a bar is not examined, so several bricks can advance within one bar.
Predictions (written before measuring)
① Before and after confirmation, the directional value D changes a great deal.
② The delay test will not catch it. Delaying the entry by 1 or 5 bars should leave the before-confirmation version as good as it was.
③ After confirmation, D is about the same as an indiscriminate baseline.
④ On a synthetic random walk the before-confirmation version still comes out positive.
⑤ The size of the look-ahead is roughly proportional to the brick size.
3. How much the answer differs before and after confirmation
The same turns, the same directions, the same holding time. Only the bar of entry differs.
Calculation 3.1 Median of the four instruments
| k | Brick size | D before | t before | D after | t after | Difference |
|---|---|---|---|---|---|---|
| 2 | 3.2500 | 7.2162 | 95.1400 | −0.2040 | −1.2610 | 7.4202 |
| 5 | 8.1250 | 12.7910 | 89.2402 | −0.2713 | 1.4397 | 13.0622 |
| 10 | 16.2500 | 18.3789 | 58.5623 | −0.4744 | 3.9406 | 18.8533 |
Observation 3.2: ★ This is the core of the paper. Before confirmation it is 7.2162 to 18.3789 pips; after confirmation, −0.2040 to −0.4744. The sign flips.
Observation 3.3: ★ The daily t falls from 95.1400 to −1.2610. A value of 95 has no business appearing in a trading study. When it does, suspect the convention first.
Observation 3.4: Prediction ③ held. After confirmation D is −0.2040 to −0.4744 pips, near zero. ★ At k=10, however, the daily t is 3.9406, so it cannot be called exactly zero.
Observation 3.5: ★ Prediction ⑤ failed. Divided by the brick size the look-ahead is 2.2831 → 1.6077 → 1.1602, not constant. Multiplying the brick by 5 multiplies the look-ahead by only about 2.5: it grows more slowly than proportionally.
4. How far apart the two entries are
Calculation 4.1 Bars between them (median of the four instruments)
| k | Median gap | Mean gap | Share on the same bar |
|---|---|---|---|
| 2 | 2.0000 | 3.5648 | 0.0000 |
| 5 | 6.0000 | 10.9829 | 0.0000 |
| 10 | 15.0000 | 30.9589 | 0.0000 |
Observation 4.2: ★ They were never on the same bar: the share is 0.0000 for all three. That follows from the definition — a brick in the opposite direction requires the price to move one brick — so it is a check, not a finding.
Observation 4.3: The gap grows with the brick: medians of 2.0000 → 6.0000 → 15.0000 bars.
Observation 4.4: ★ The mean is much larger than the median (3.5648 / 10.9829 / 30.9589). Some turns keep you waiting, out in the tail.
Observation 4.5: ★ This gap decides the next section. If the look-ahead is that long, delaying by less than that leaves some of it in place.
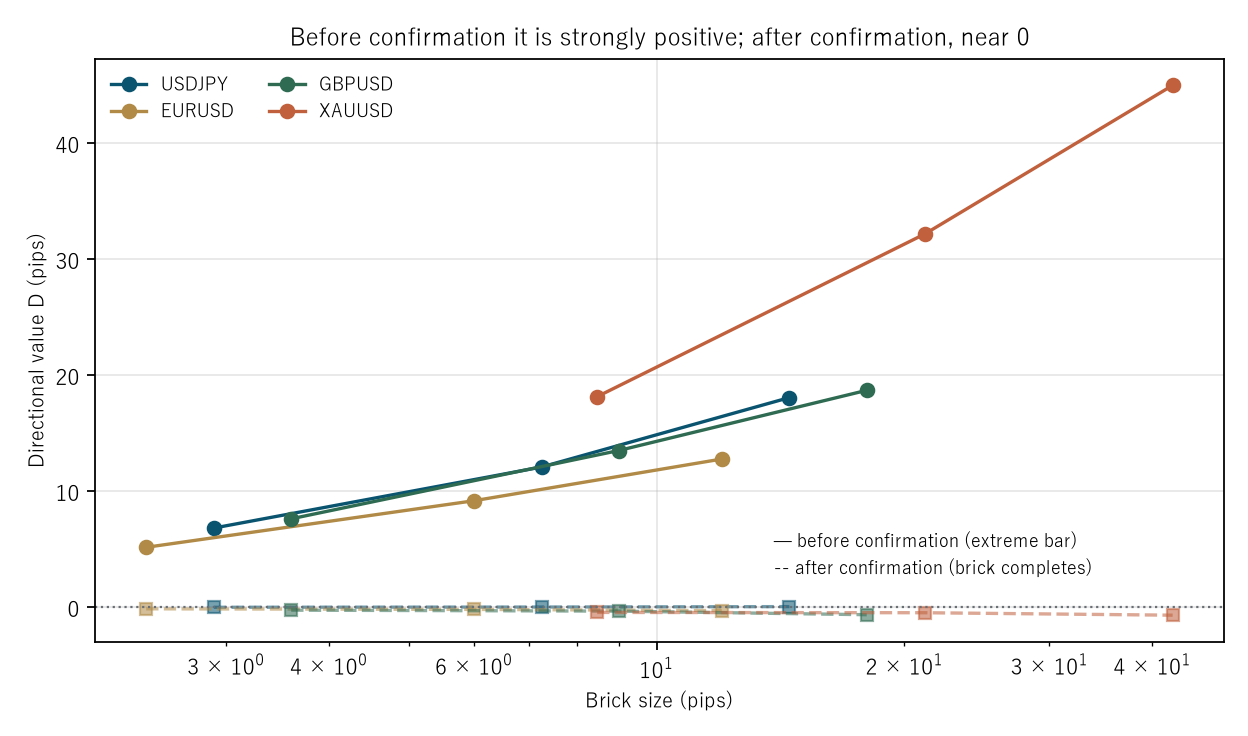
Figure 1: brick size (pips, logarithmic) on the horizontal axis and the directional value D (pips) on the vertical. Solid lines are before confirmation, dashed lines after, and colour is the instrument. The dotted line is 0.
5. Does the delay test catch this?
Delay the entry by 0 / 1 / 5 bars. If the look-ahead were in time, delaying should break it.
Calculation 5.1 Before confirmation (median of the four instruments)
| k | D at 0 | D at 1 | D at 5 | t at 0 | t at 1 | t at 5 |
|---|---|---|---|---|---|---|
| 2 | 7.2162 | 3.5895 | 0.6402 | 95.1400 | 56.9753 | 14.4081 |
| 5 | 12.7910 | 9.2946 | 4.0005 | 89.2402 | 72.0154 | 37.9465 |
| 10 | 18.3789 | 15.3585 | 9.5560 | 58.5623 | 52.7020 | 36.2913 |
Observation 5.2: ★ Prediction ② failed. The delay test does catch this. Five bars drops k=2 to 0.0887.
Observation 5.3: ★ But at k=10 it only falls to 0.5199. The declared five bars were enough for k=2 and not enough for k=10.
Observation 5.4: The count barely changes with the delay: 57,862 → 57,861 at k=2. ★ The t did not fall because the sample shrank.
Calculation 5.5 The retained share is decided by "bars delayed ÷ bars of gap" (★ added afterwards)
This part is after the fact. Once prediction ② had failed, 10/20/40 bars were added to the declared 0/1/5 and measured.
| Bars delayed ÷ bars of gap | Retained share | k | Delay |
|---|---|---|---|
| 0.0667 | 0.8357 | 10 | 1 |
| 0.1667 | 0.7267 | 5 | 1 |
| 0.3333 | 0.5199 | 10 | 5 |
| 0.5000 | 0.4974 | 2 | 1 |
| 0.6667 | 0.3341 | 10 | 10 |
| 0.8333 | 0.3128 | 5 | 5 |
| 1.3333 | 0.1688 | 10 | 20 |
| 1.6667 | 0.1521 | 5 | 10 |
| 2.5000 | 0.0887 | 2 | 5 |
| 2.6667 | 0.0685 | 10 | 40 |
| 3.3333 | 0.0482 | 5 | 20 |
| 5.0000 | 0.0225 | 2 | 10 |
Observation 5.6: ★ At the same ratio the retained share is nearly the same whatever k is. Ratio 1.3333 gives 0.1688 and ratio 1.6667 gives 0.1521; ratio 2.5000 gives 0.0887 and ratio 2.6667 gives 0.0685. The three values of k fall on one line.
Observation 5.7: ★ Even at k=10 (a gap of 15.0000 bars), delaying 40 bars drops it to 0.0685. The delay test works — but only if the delay is taken larger than the gap of the convention.
Observation 5.8: ★ So a delay test is not universal; it is a tool whose scale must be matched. "It survived a five-bar delay" says nothing if the convention's gap is longer than five bars.
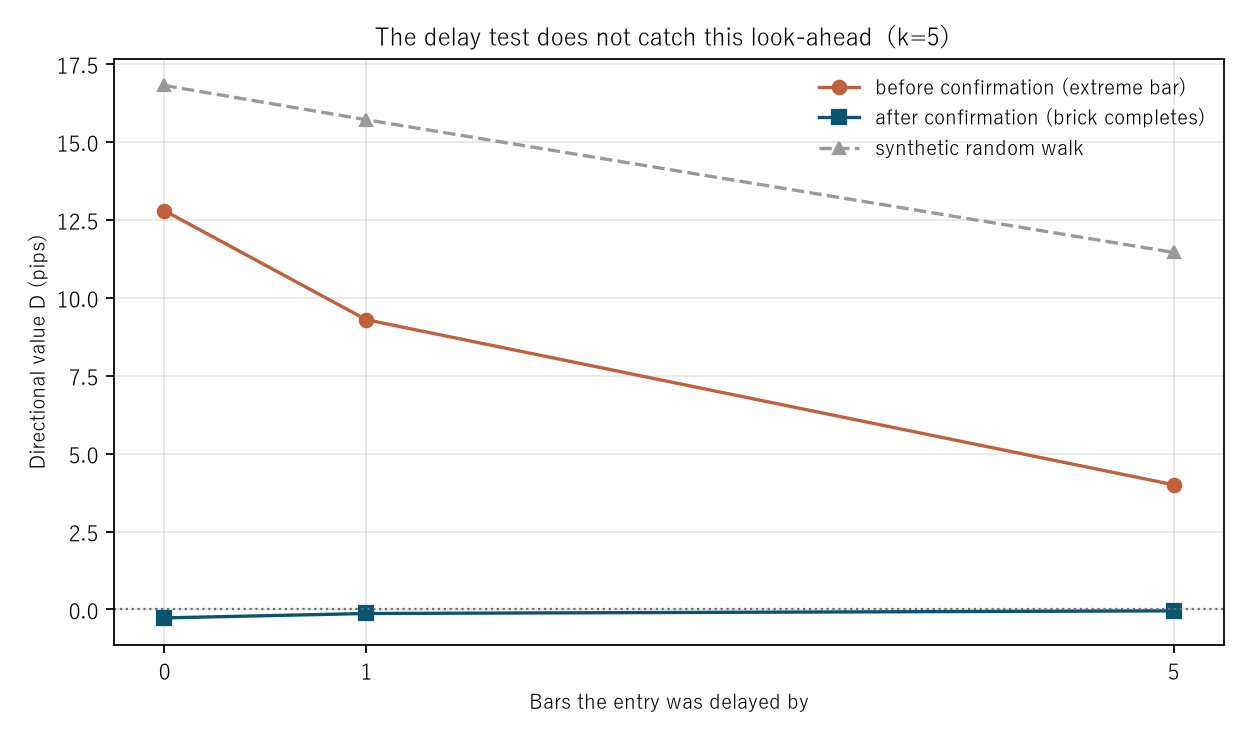
Figure 2: bars the entry was delayed by on the horizontal axis and the directional value D (pips) on the vertical. Upper is before confirmation, lower is after, and the grey dashed line is the synthetic random walk before confirmation (k=5).
6. The baseline — the same procedure on a synthetic random walk
A series with, by construction, zero directional information.
Calculation 6.1 Measurement against synthetic random walk
| k | Before, measurement | Before, random walk | After, measurement | After, random walk |
|---|---|---|---|---|
| 2 | 7.2162 | 10.3097 | −0.2040 | 0.0216 |
| 5 | 12.7910 | 16.8088 | −0.2713 | −0.0465 |
| 10 | 18.3789 | 14.3868 | −0.4744 | −0.1870 |
Observation 6.2: ★ Prediction ④ held, and the random walk is larger. At k=5 it is 16.8088 against the measurement's 12.7910 pips.
Observation 6.3: ★ Look-ahead manufactures a number even when there is nothing in the market. The synthetic random walk has no directional information, yet entering at the extreme bar gives a large positive. ★ In [F029], look-ahead leaked only magnitude and not direction. The look-ahead here manufactures direction. Even within "look-ahead", what leaks depends on the form.
Observation 6.4: After confirmation the random walk is near zero (0.0216 / −0.0465 / −0.1870). ★ Fix the convention and the value returns to where it should be.
Observation 6.5: The brick sizes differ, so compare them scaled. Look-ahead ÷ brick size is 2.2831 / 1.6077 / 1.1602 on the measurement against 1.7178 / 1.1257 / 0.4867 on the random walk. ★ The measurement is somewhat larger, but the order of magnitude is the same.
Observation 6.6: ★ What this baseline is zero about was measured in [F033]: zero for direction and zero for magnitude structure.
7. Limitations
- Predictions ② and ⑤ failed. The delay test does catch it, and the look-ahead was not proportional to the brick size. This paper writes those failures and, for ②, gets as far as the form "bars delayed ÷ bars of gap".
- Renko charts are not rejected. What this paper treats is only when a turning point could have been known.
- One way of building bricks is fixed: from bar closes, with the order inside a bar unexamined.
- The holding time is fixed at 24 bars.
- No trading is discussed. Neither cost nor slippage is included, and everything is on mid prices.
- After confirmation is not exactly zero. At k=10 the daily t is 3.9406. The mechanism is not measured.
- The delays are not evenly spaced. They are 0/1/5 with 10/20/40 added afterwards.
- Four instruments, six years, five-minute bars. Nothing is claimed about other markets or other periods.
Conclusion
A renko "turning point" is obvious at a glance in hindsight. But at the time it is not. A turn is known only when one brick in the opposite direction has completed.
With the same turns, the same directions and the same holding time, only the bar of entry was changed. The extreme bar gives a directional value of 12.7910 pips with a daily t of 89.2402; the bar where the brick completes gives −0.2713 pips with a daily t of 1.4397. ★ The sign flips.
★ A daily t of 95.1400 has no business appearing in a trading study. When it does, suspect the convention first.
★ And on a synthetic random walk the extreme bar still gives 16.8088 pips — more than the measurement's 12.7910. Look-ahead manufactures a number even when there is nothing in the market.
★ Two predictions failed. The look-ahead was not proportional to the brick (divided by it: 2.2831 → 1.1602), and the delay test did catch it.
★ But the way it failed is the answer. Five bars drops k=2 to 0.0887 while leaving 0.5199 at k=10. The gap between the two conventions is 2.0000 bars at k=2 and 15.0000 at k=10, and five bars is enough for the first and not the second.
★ The retained share is decided by "bars delayed ÷ bars of gap". Ratio 1.3333 gives 0.1688 and 1.6667 gives 0.1521; 2.5000 gives 0.0887 and 2.6667 gives 0.0685. At the same ratio the fall is the same whatever k is. Even at k=10, delaying 40 bars drops it to 0.0685.
So a delay test works — but only with its scale matched. ★ "It survived a five-bar delay" says nothing if the convention's gap is longer than five bars. The delay must be taken larger than the gap of the convention under suspicion.
Data and reproduction
| Data | Foreign exchange from Dukascopy-derived ticks (from 2019 onward, matching to the millisecond, bid and ask, has been verified). Gold from Dukascopy |
| Period | 2019–2024 (six years) |
| Instruments | USDJPY, EURUSD, GBPUSD, XAUUSD |
| Bars | 5-minute, mid price, closes of completed bars only. Bars with no ticks are not created |
| Brick size | B = k × σ (σ = the median absolute move of one bar). k = 2, 5, 10 |
| Entries | Before confirmation (the bar where the previous brick completed) / after confirmation (the bar where the new-direction brick completed) |
| Direction | The direction of the new brick |
| Holding | 24 bars (two hours) |
| Delays | 0, 1, 5 bars (★ 10, 20, 40 added afterwards) |
| Quantities | D (pips), daily t, count, bars between the two entries |
| Baseline | Synthetic random walk down to within the bar (3 draws), built by adding differences of constant spread |
| Verification | 検算/F040.py (--zu also writes the figures). Every number in the text comes from 検算/F040_output.txt |
| Figures | 図/F040_zu1, 図/F040_zu2 (png, svg, English versions) |
| Random seeds | Fixed. Re-running gives the same values |
| Substrate check | _ツール/audit_bars.py (bar look-ahead, daylight saving, day boundary). The record is _土台の検査.txt |
References
- Yamagishi, Y. (2026). A Renko Chart Is a Different Clock [F017]. Zenodo. 10.5281/zenodo.22891823
- Yamagishi, Y. (2026). Look-Ahead Leaks Only Magnitude; What Manufactures a Number Is Deciding the Assignment Afterwards [F029]. Zenodo. 10.5281/zenodo.22893385
- Yamagishi, Y. (2026). A Synthetic Random Walk Has No Volatility Clustering [F033]. Zenodo. 10.5281/zenodo.22893674
Reference
Yamagishi, Y. (2026). A Renko Turning Point Is Not a Turning Point Until the Brick Completes [F040]. Zenodo.
DOI: 10.5281/zenodo.22894529
YOI: https://www.yamagishiyuuki.com/yoi/F040
ORCID: 0009-0006-8587-3450
PDF (English) · PDF (Japanese) · Date proof of the English PDF (OpenTimestamps .ots) · SHA256SUMS
The record page for this paper (in Japanese, with the PDFs in each language and the date proof): YOI F040. This paper is a preprint and has not been peer reviewed.