Abstract
What this paper asks is what changes and what does not when a different lot rule is applied to the same sequence of trades — and the answer is that the look changes while the final value's independence of order does not (neither rule depends on it). No new mathematical theorem and no new law is claimed.
First, the pips per trade and the win rate do not move with the lot rule. A lot only multiplies each trade's result by the same number, changing neither sign nor order. That follows from the definition: a check, not a finding (Section 3).
Second, and this is the core of the paper: ★ prediction ② failed. The compounded final equity does not move under shuffling either. Over 1,000 shuffles the maximum ÷ minimum is 1.0000000000 and the relative span runs from 1.052e-14 to 1.332e-14 — floating-point rounding. I had written that multiplication depends on order; a product is commutative (Section 5).
Third, ★ what depends on the order is only the shape in between. Shuffling alone moves the fixed-lot maximum drawdown by a median maximum ÷ minimum of 4.4694 times and the compounded one by 1.2414. The synthetic random walk gives 3.1520 and 1.0308: this is the arithmetic of shuffling (Sections 5 and 7).
Fourth, ★ what the lot rule moves is the look. The same GBPUSD trades give 1.8028 times at g = 0.05, 0.0636 at g = 0.10 and 0.0000 at g = 0.20 (Section 4).
Fifth, ★ and it ruins the account. Equity fell to zero or below in 6 of 16 combinations. GBPUSD at g = 0.40 does so on the 45th trade (Section 4).
Sixth, ★ prediction ④ half held and prediction ⑤ failed. The final equity is largest at g = 0.05 for every instrument among the four declared values, so the peak lies outside the declared range; adding finer values afterwards brought the peak inside for 2 of the four instruments. And the ranking changed while all four were above zero 0 times (Sections 4 and 6).
Scope of this paper: no new mathematical theorem and no new law is claimed — the commutativity of sums and products, volatility drag and the probability of ruin are all known. No real course, author, or vendor is the subject here, and none is named. No trading is discussed — neither cost nor slippage is included, and everything is measured on mid prices (Section 8). No optimal g is sought — the location of the peak is shown but nothing is recommended (Section 8). One sequence of trades is fixed — a 20/80 moving-average cross held 24 bars (Section 8). Predictions ②, ④ and ⑤ failed — the compounded final value is order-independent, the peak lay outside the declared range, and the ranking did not change (Sections 5, 6 and 8). The scope is intraday and few instruments — four instruments over six years on one-hour bars. Results documented at longer holding periods, such as monthly time-series momentum, are not contradicted. No prediction is claimed.
1. Notation and the question
An equity curve is shown as the performance of a method.
| What gets said | What does not get said |
|---|---|
| This is the method's equity curve | How the lot was decided |
| The maximum drawdown was N% | How that moves when the same trades are shuffled |
| Equity grew N times | That nothing about the per-trade result changed |
Observation 1.1: ★ A lot rule does not touch the trades themselves. It only multiplies each result by a number; when the position was opened and closed is unchanged.
Observation 1.2: The shape of the curve changes anyway. ★ So what changes and what does not?
Observation 1.3: The separator is the lot rule. The sequence of trades, the instruments and the period are all held fixed, and only "fixed lot or compounding" is changed.
Question: applying a different lot rule to the same sequence of trades, what changes and what does not?
2. State the quantities and the design first
Declared before the run and unchanged during it.
| Grid | 1-hour bars (mid price, completed bars only) |
| Trades | Direction from a 20/80 moving-average cross, one trade every 24 bars (non-overlapping) |
| Unit | Return per trade = g × pips ÷ σ |
| σ | Standard deviation of one trade over the selection period (up to 2022-01-01) |
| Lot rules | Fixed (the same every time) / compounding at g = 0.05 / 0.10 / 0.20 / 0.40 |
| Shuffles | 1,000 (fixed seed) |
| Quantities | Final equity (multiple), maximum drawdown, total pips, pips per trade, win rate, span under shuffling |
| Baseline | Synthetic random walk down to within the bar (3 draws) |
| Separator | The lot rule (fixed or compounding) |
| Instruments and period | USDJPY, EURUSD, GBPUSD, XAUUSD / 2019–2024 |
Observation 2.1: The trades do not overlap. One trade every 24 bars means there are never two positions at once.
Observation 2.2: ★ Under compounding, once 1 + return falls to zero or below the account is ruined and stays at zero. Without this, negative factors keep multiplying and the sign flips.
Observation 2.3: Counts run from 1,450 to 1,519 trades, and σ is estimated on the selection period.
Predictions (written before measuring)
① Under a fixed lot, shuffling does not move the final equity at all (a check).
② Under compounding, shuffling alone moves the final equity.
③ The pips per trade and the win rate do not move with the lot rule, identically (a check).
④ Raising the betting fraction g raises the final equity, but past some point it falls.
⑤ The ranking of instruments by total pips and by compounded final equity changes places.
3. What does not move with the lot rule (checks)
Calculation 3.1 The trades themselves
| Instrument | Trades | Pips per trade | Win rate | Total pips |
|---|---|---|---|---|
| USDJPY | 1,518 | −2.0112 | 0.5013 | −3053.00 |
| EURUSD | 1,519 | 0.3078 | 0.5056 | 467.50 |
| GBPUSD | 1,518 | 2.3329 | 0.5066 | 3541.35 |
| XAUUSD | 1,450 | 2.0181 | 0.4917 | 2926.28 |
Observation 3.2: Neither the pips per trade nor the win rate moves with the lot rule, by definition. ★ A lot only multiplies each result by the same number, changing neither sign nor order. Agreement here is a check, not a finding.
Observation 3.3: The fixed-lot total does not move under shuffling. Over 1,000 shuffles the largest deviation across the four instruments is 0.000000 pips. ★ Only the order of addition changed. Prediction ① held.
4. What does move with the lot rule
Calculation 4.1 GBPUSD (the same 1,518 trades)
| Lot rule | Final equity | Max DD | Worst trade | |
|---|---|---|---|---|
| Fixed | 3541.35 | 2956.80 | −329.10 | in pips |
| Compounding g=0.05 | 1.8028 | 0.9444 | −0.2341 | multiple and share |
| Compounding g=0.10 | 0.0636 | 0.9997 | −0.4682 | multiple and share |
| Compounding g=0.20 | 0.0000 | 1.0000 | −0.9365 | multiple and share |
| Compounding g=0.40 | 0.0000 | 1.0000 | −1.8730 | ★ ruined |
Observation 4.2: ★ The same sequence of trades gives 1.8028 times at g = 0.05 and 0.0000 at g = 0.20. The entry times, the exit times and the directions are all identical.
Calculation 4.3 Final equity (multiple) across the four instruments
| Instrument | g=0.05 | g=0.10 | g=0.20 | g=0.40 |
|---|---|---|---|---|
| USDJPY | 0.0001 | 0.0000 | 0.0000 | 0.0000 |
| EURUSD | 0.1416 | 0.0001 | 0.0000 | 0.0000 |
| GBPUSD | 1.8028 | 0.0636 | 0.0000 | 0.0000 |
| XAUUSD | 0.2901 | 0.0011 | 0.0000 | 0.0000 |
Observation 4.4: ★ Ruin occurred in 6 of 16 combinations. USDJPY runs out on trade 998 at g=0.10, trade 857 at g=0.20 and trade 148 at g=0.40, and GBPUSD at g=0.40 on trade 45.
Observation 4.5: ★ Prediction ④ failed within the declared range. The final equity is largest at g=0.05 — the left edge — for all four instruments. Only the falling side of "past some point it falls" is visible; the peak lies outside the four declared values.
Calculation 4.6 Looking for the peak at finer g (★ added afterwards)
This part is after the fact. The declared four values did not locate the peak, so smaller ones were added and measured.
| Instrument | g=0.005 | g=0.010 | g=0.020 | g=0.050 | Peak at |
|---|---|---|---|---|---|
| USDJPY | 0.6748 | 0.4066 | 0.1042 | 0.0001 | g=0.005 |
| EURUSD | 1.0303 | 1.0100 | 0.8356 | 0.1416 | g=0.005 |
| GBPUSD | 1.2618 | 1.5317 | 2.0106 | 1.8028 | g=0.020 |
| XAUUSD | 1.0714 | 1.0996 | 1.0185 | 0.2901 | g=0.010 |
Observation 4.7: ★ Made finer, the peak came inside the range for 2 of the four instruments. GBPUSD peaks at g=0.020 with 2.0106 times and XAUUSD at g=0.010 with 1.0996. For the other two the peak lies further left still.
Observation 4.8: ★ So "raising the betting fraction improves things" appears nowhere in this paper's range. Even for GBPUSD the best is 2% of equity.
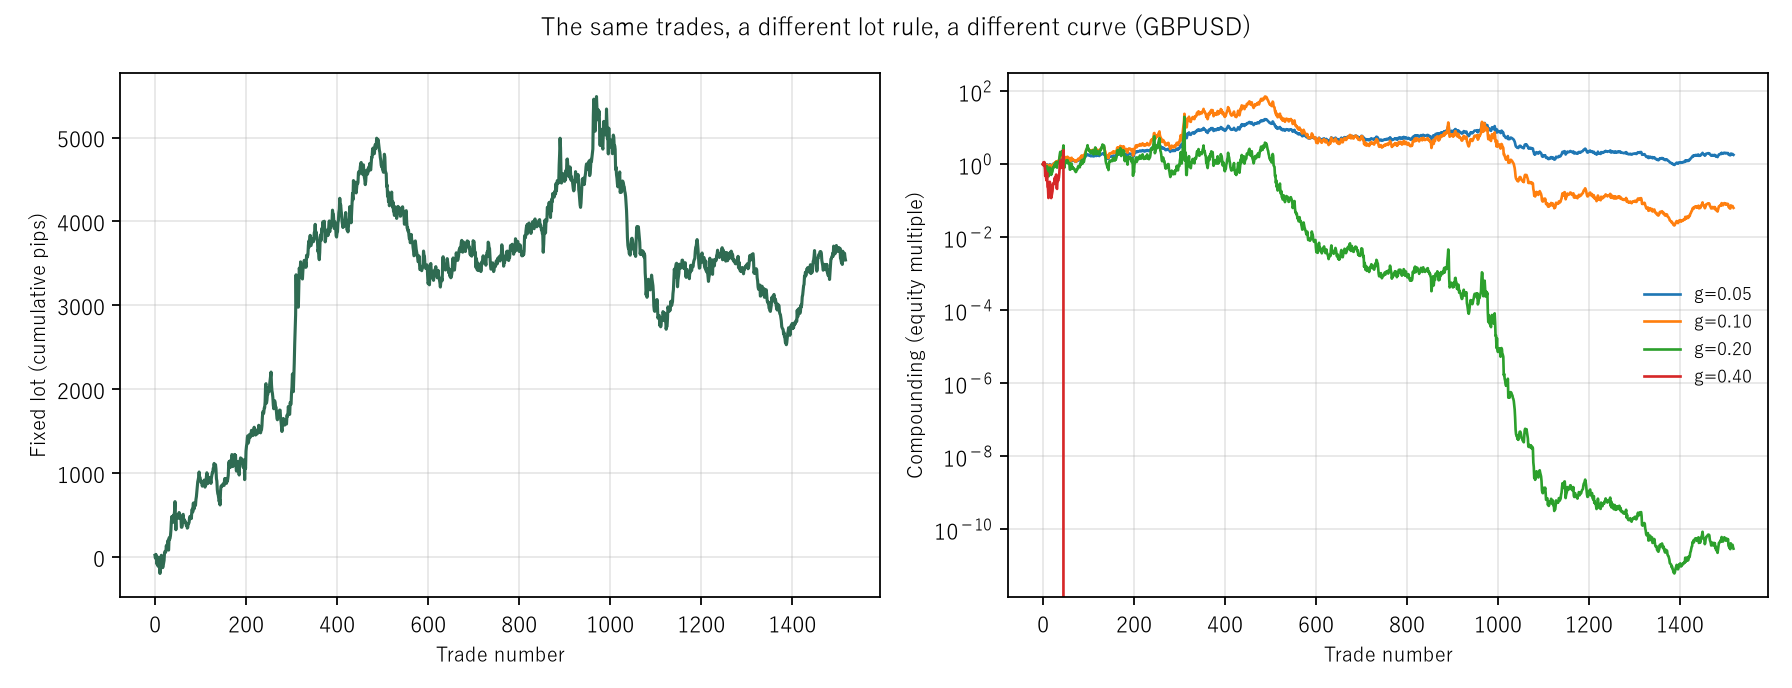
Figure 1: fixed lot (cumulative pips) on the left and compounding (equity multiple, logarithmic) on the right. Both are the same 1,518 GBPUSD trades. The four lines on the right differ only in the betting fraction g.
5. What shuffling moves
Calculation 5.1 The final value moves under neither rule
| Instrument | Fixed total | Span under shuffling | Compounded final | Shuffle minimum | Shuffle maximum |
|---|---|---|---|---|---|
| USDJPY | −3053.00 | 0.000000 | 0.0001 | 0.0001 | 0.0001 |
| EURUSD | 467.50 | 0.000000 | 0.1416 | 0.1416 | 0.1416 |
| GBPUSD | 3541.35 | 0.000000 | 1.8028 | 1.8028 | 1.8028 |
| XAUUSD | 2926.28 | 0.000000 | 0.2901 | 0.2901 | 0.2901 |
Observation 5.2: ★ Prediction ② failed. The compounded final equity does not move under shuffling either. The maximum ÷ minimum is 1.0000000000 and the relative span runs from 1.052e-14 to 1.332e-14, which is floating-point rounding.
Observation 5.3: ★ The reason is simple: a product is commutative. I had written that multiplication depends on order, and that was wrong. Changing the order of a sum or of a product leaves the answer the same.
Calculation 5.4 What depends on the order is the shape in between
| Instrument | Fixed DD actual | Fixed DD min | Fixed DD max | Comp DD actual | Comp DD min | Comp DD max |
|---|---|---|---|---|---|---|
| USDJPY | 4841.90 | 3147.35 | 9214.05 | 1.0000 | 0.9999 | 1.0000 |
| EURUSD | 2923.25 | 946.30 | 4080.40 | 0.9854 | 0.8732 | 0.9979 |
| GBPUSD | 2956.80 | 1069.40 | 4947.90 | 0.9444 | 0.6111 | 0.9837 |
| XAUUSD | 8007.38 | 3219.58 | 16296.08 | 0.9746 | 0.7447 | 0.9979 |
Observation 5.5: ★ Shuffling alone moves the maximum drawdown a great deal. GBPUSD's fixed lot runs from 1069.40 to 4947.90 pips and XAUUSD's from 3219.58 to 16296.08.
Observation 5.6: ★ So the only part of an equity curve that belongs to the order is the dip in the middle. The final value does not belong to the order. That the maximum drawdown belongs to the order of the trades was measured in [F031].
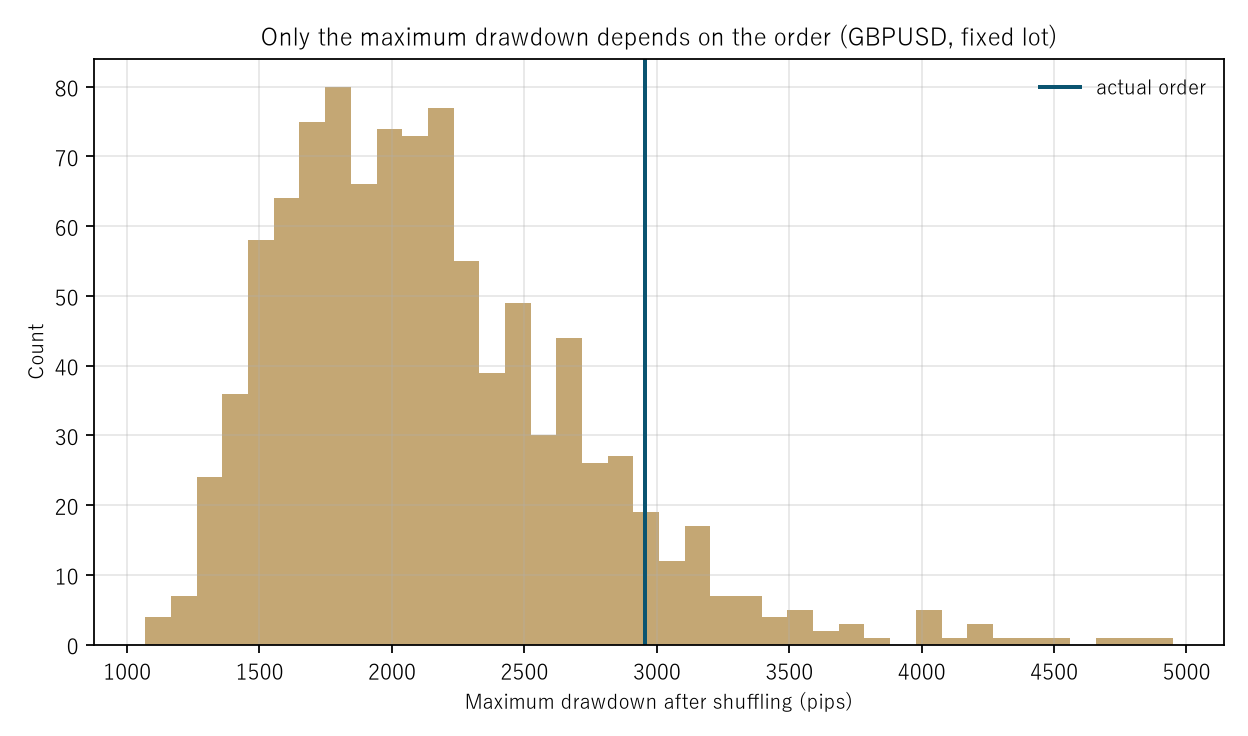
Figure 2: the maximum drawdown (pips) over 1,000 shuffles on the horizontal axis and the count on the vertical. GBPUSD with a fixed lot; the vertical line is the actual order.
6. Does the ranking change?
Calculation 6.1 The four instruments under two yardsticks
| Yardstick | Order | |
|---|---|---|
| Total pips | GBPUSD > XAUUSD > EURUSD > USDJPY | |
| Compounding g=0.05 | GBPUSD > XAUUSD > EURUSD > USDJPY | same |
| Compounding g=0.10 | GBPUSD > XAUUSD > EURUSD > USDJPY | 1 instrument at 0 |
| Compounding g=0.20 | GBPUSD > XAUUSD > EURUSD > USDJPY | 1 instrument at 0 |
| Compounding g=0.40 | — | 4 instruments at 0, no ranking |
Observation 6.2: ★ Prediction ⑤ failed. The ranking changed while all four were above zero in 0 of the four values of g.
Observation 6.3: ★ At g=0.40 all four are at zero, so there is no ranking to speak of. Zeros are ties. Sorting them produces an order on paper that means nothing.
Observation 6.4: So this paper does not show that compounding changes the ranking. ★ What it shows is that compounding sends instruments to zero one after another.
7. The baseline — the same procedure on a synthetic random walk
Calculation 7.1 How far shuffling moves the maximum drawdown
| Measurement | Synthetic random walk | |
|---|---|---|
| Median max ÷ min of the fixed-lot DD | 4.4694 | 3.1520 |
| Median max ÷ min of the compounded DD | 1.2414 | 1.0308 |
Observation 7.2: ★ That shuffling moves the maximum drawdown happens just as much on the synthetic random walk. This is not a property of the market but the arithmetic of shuffling. What that synthetic random walk is zero about was measured in [F033].
Observation 7.3: The measurement is larger, but the order of magnitude is the same: 4.4694 against 3.1520 for the fixed lot and 1.2414 against 1.0308 for compounding.
8. Limitations
- Predictions ②, ④ and ⑤ failed. The compounded final value is order-independent, the peak lay outside the declared range, and the ranking did not change. This paper writes all three, and for ② gives the reason: a product is commutative.
- No optimal g is sought. The location of the peak is shown; which g to use is not stated.
- One sequence of trades is fixed: a 20/80 moving-average cross held 24 bars.
- One form of compounding is fixed. The same fraction is bet every time; forms that vary the fraction with wins and losses are not measured.
- No cost is included. Everything is on mid prices, with no slippage and no rejected fills.
- Ruin is handled one way. Once 1 + return falls to zero or below, equity stays at zero.
- There are 1,000 shuffles. Nothing finer than that can be said.
- Four instruments, six years, one-hour bars. Nothing is claimed about other markets or other periods.
Conclusion
An equity curve is shown as the performance of a method. But a lot rule does not touch the trades themselves; it only multiplies each result by a number.
The look changes anyway. The same 1,518 GBPUSD trades grow to 1.8028 times at a betting fraction of g = 0.05, fall to 0.0636 at g = 0.10 and to 0.0000 at g = 0.20. ★ The entry times, the exit times and the directions are all identical. And equity runs out in 6 of 16 combinations; GBPUSD at g = 0.40 does so on the 45th trade.
Meanwhile the pips per trade and the win rate do not move. ★ They cannot, by definition, so this is a check and not a finding.
★ And a prediction failed. The compounded final equity does not move under shuffling either. Over 1,000 shuffles the maximum ÷ minimum is 1.0000000000 and the relative span runs from 1.052e-14 to 1.332e-14 — floating-point rounding. The reason is simple: a product is commutative. I had written that multiplication depends on order, and that was wrong.
★ What belongs to the order is only the shape in between. Shuffling alone moves the fixed-lot maximum drawdown from 1069.40 to 4947.90 pips for GBPUSD and from 3219.58 to 16296.08 for XAUUSD. The synthetic random walk moves just as much, so this is the arithmetic of shuffling.
★ Two more predictions failed. The final equity is largest at g = 0.05, the left edge, for every instrument among the four declared values, so the peak lay outside the declared range. Adding finer values afterwards puts GBPUSD's peak at g = 0.020 with 2.0106 times and XAUUSD's at g = 0.010 with 1.0996, bringing it inside the range for 2 of the four. And the ranking changed while all four were above zero 0 times. At g = 0.40 all four are at zero, so there is no ranking to speak of.
So what is needed when showing an equity curve is the lot rule and the shuffled distribution. ★ The height of the curve belongs to the lot rule, the dip in the middle belongs to the order of the trades, and the per-trade result belongs to neither.
Data and reproduction
| Data | Foreign exchange from Dukascopy-derived ticks (from 2019 onward, matching to the millisecond, bid and ask, has been verified). Gold from Dukascopy |
| Period | 2019–2024 (six years) |
| Instruments | USDJPY, EURUSD, GBPUSD, XAUUSD |
| Bars | 1-hour, mid price, completed bars only. Bars with no ticks are not created |
| Trades | Direction from a 20/80 moving-average cross, one trade every 24 bars (non-overlapping) |
| Unit | Return per trade = g × pips ÷ σ, with σ the standard deviation of one trade over the selection period (up to 2022-01-01) |
| Lot rules | Fixed; compounding at g = 0.05, 0.10, 0.20, 0.40 (★ finer values added afterwards: 0.005, 0.010, 0.020, 0.050) |
| Ruin | Once 1 + return falls to zero or below, equity stays at zero |
| Shuffles | 1,000 (fixed seed) |
| Quantities | Final equity, maximum drawdown, total pips, pips per trade, win rate, span under shuffling |
| Baseline | Synthetic random walk down to within the bar (3 draws), built by adding differences of constant spread |
| Verification | 検算/F038.py (--zu also writes the figures). Every number in the text comes from 検算/F038_output.txt |
| Figures | 図/F038_zu1, 図/F038_zu2 (png, svg, English versions) |
| Random seeds | Fixed. Re-running gives the same values |
| Substrate check | _ツール/audit_bars.py (bar look-ahead, daylight saving, day boundary). The record is _土台の検査.txt |
References
- Yamagishi, Y. (2026). The Maximum Drawdown Belongs to the Order of the Trades [F031]. Zenodo. 10.5281/zenodo.22893510
- Yamagishi, Y. (2026). A Synthetic Random Walk Has No Volatility Clustering [F033]. Zenodo. 10.5281/zenodo.22893674
Reference
Yamagishi, Y. (2026). The Look of an Equity Curve Belongs to the Lot Rule [F038]. Zenodo.
DOI: 10.5281/zenodo.22894016
YOI: https://www.yamagishiyuuki.com/yoi/F038
ORCID: 0009-0006-8587-3450
PDF (English) · PDF (Japanese) · Date proof of the English PDF (OpenTimestamps .ots) · SHA256SUMS
The record page for this paper (in Japanese, with the PDFs in each language and the date proof): YOI F038. This paper is a preprint and has not been peer reviewed.