Abstract
What this paper asks is whether the "volume" in foreign exchange — the tick count — is merely a restatement of the move: and the answer is that it is not. But what it separates is magnitude only, not direction. No new mathematical theorem and no new law is claimed.
First, ★ prediction ① failed. The rank correlation between the tick count and the move is only 0.4860, running from 0.4695 to 0.5173 across the four instruments. Not high enough to call them restatements of one another (Section 3).
Second, the shape of the layer ratio is very similar. Layered by the count or by the move, the quintile ratios differ by a median absolute value of 0.0335 (Section 4).
Third, and this is the core of the paper: ★ prediction ⑤ failed too. Hold the move equal and the count still separates by 0.1581 — nearly half of the 0.3644 it separates by when nothing is held equal (Section 5).
Fourth, ★ the reverse is much smaller: hold the count equal and split by the move and only 0.0521 remains. A ratio of 3.0323. The count separates the forward move better (Section 5).
Fifth, the count varies a great deal by hour. Max ÷ min is 6.7719 at the median of the four instruments, from 8,385 at 14:00 UTC to 1,516 at 21:00 (Section 6).
Sixth, ★ but the count carries no direction. Across the count quintiles the daily t exceeds 2 in absolute value in 0 of 20 combinations. What it separates is magnitude alone (Section 6).
Scope of this paper: no new mathematical theorem and no new law is claimed — that foreign exchange has no central exchange, that a tick is a quote update, and the relation between trading activity and variation are all known. No real course, author, or vendor is the subject here, and none is named. No particular data feed is the subject — the count depends on the feed, and no claim is made about which is correct (Section 7). No trading is discussed — neither cost nor slippage is included, and the directional D is not significant (Sections 6 and 7). Predictions ① and ⑤ failed — the correlation is moderate, and the count separated even with the move held equal (Sections 3, 5 and 7). No mechanism is offered — why the count separates better is not measured (Section 7). The scope is intraday and few instruments — four instruments over six years on one-hour bars. Results documented at longer holding periods, such as monthly time-series momentum, are not contradicted. No prediction is claimed.
1. Notation and the question
Foreign exchange has no central exchange, so nobody knows how many lots changed hands.
| What gets said | What does not get said |
|---|---|
| Volume is rising | That it counts quote updates, not trades |
| A breakout on volume | The difference between volume rising and the price moving |
| Volume shows liquidity | That a different feed gives a different count |
Observation 1.1: ★ The "volume" shown by trading software is the number of ticks inside that bar. A tick is a quote update, not a trade.
Observation 1.2: So two suspicions arise. ★ One is that it merely restates that the price moved; the other is that it merely measures how busy the feed was.
Observation 1.3: The separator is what was counted. The instruments, the period, the grid and the forward horizon are all held fixed, and only whether the layering quantity is the count or the move is changed.
Question: is the tick count merely a restatement of the move?
2. State the quantities and the design first
Declared before the run and unchanged during it.
| Grid | 1-hour bars (mid price, completed bars only) |
| Count | The number of ticks in the bar, n |
| Move | |that bar's close − open| (pips) |
| Forward | The |move| 24 bars ahead (one day, pips) and the signed move |
| Layers | Quintiles (of n and of |move| separately) |
| Double layering | Within each |move| quintile, the upper and lower half by n |
| Quantities | Rank correlation, layer ratio (layer mean ÷ overall mean), D and daily t, n by hour |
| Baseline | A synthetic random walk cannot produce a count, so the count is randomly shuffled instead |
| Separator | What was counted (quote updates, or the move) |
| Instruments and period | USDJPY, EURUSD, GBPUSD, XAUUSD / 2019–2024 |
Observation 2.1: ★ The baseline is unusual here. A count cannot be built from a price series, so this series' usual synthetic random walk does not apply. Shuffling the count alone is used as the control instead.
Observation 2.2: Usable bars run from 34,868 to 36,530. The median count runs from EURUSD's 3,369 to XAUUSD's 6,743.
Observation 2.3: ★ The double layering is the point. Hold one equal and split by the other, and it shows which carries the extra information.
Observation 2.4: The mean forward move differs by instrument (EURUSD 36.3991, XAUUSD 128.8386 pips). ★ So everything is reported as a ratio.
Predictions (written before measuring)
① The correlation between the tick count and \|a bar's move\| is high (volume restates the move).
② The layer ratio under the count matches the one under \|move\| closely.
③ The count varies a great deal by hour.
④ The count carries no direction (D ≈ 0).
⑤ Hold \|move\| equal and layering by the count leaves almost no information.
3. How much the count and the move are the same thing
Calculation 3.1 Rank correlation
| Instrument | Rank correlation | Median count | Interquartile ratio of the count |
|---|---|---|---|
| USDJPY | 0.5173 | 3,670 | 3.1231 |
| EURUSD | 0.4879 | 3,369 | 3.0278 |
| GBPUSD | 0.4841 | 3,741 | 2.8826 |
| XAUUSD | 0.4695 | 6,743 | 2.8092 |
Observation 3.2: ★ Prediction ① failed. The rank correlation has a median of 0.4860 and a range of 0.4695 to 0.5173. Moderate, not high enough to call them restatements of one another.
Observation 3.3: All four instruments give almost the same value. ★ The spread is about 0.05.
Observation 3.4: The count itself is widely spread. Its interquartile ratio runs from 2.8092 to 3.1231.
Calculation 3.5 The move by count quintile (median of the four instruments)
| Quintile | Median count | Median move |
|---|---|---|
| 1 | 1,279 | 2.6375 |
| 2 | 2,402 | 4.0500 |
| 3 | 3,706 | 5.7750 |
| 4 | 5,653 | 8.2000 |
| 5 | 9,800 | 13.9000 |
Observation 3.6: ★ From the first quintile to the fifth the count rises 7.6618 times while the move rises 5.2701 times. Monotone, but not one to one.
4. Comparing the layer ratio under the two layerings
Layer ratio = that layer's one-day-ahead move ÷ the overall mean.
Calculation 4.1 The two layerings (median of the four instruments)
| Quintile | Layered by count | Layered by move | Difference |
|---|---|---|---|
| 1 | 0.8593 | 0.9080 | −0.0488 |
| 2 | 0.8990 | 0.9203 | −0.0214 |
| 3 | 0.9600 | 0.9661 | −0.0062 |
| 4 | 1.0627 | 1.0292 | 0.0335 |
| 5 | 1.2237 | 1.1793 | 0.0443 |
Observation 4.2: Prediction ② held. The absolute difference has a median of 0.0335 and a maximum of 0.0488. ★ The shapes are very similar.
Observation 4.3: ★ But the count spreads wider. The fifth ÷ first quintile is 1.4238 by count and 1.2993 by move.
Observation 4.4: The direction is the same instrument by instrument: USDJPY 2.4157 against 1.7316, EURUSD 1.3303 against 1.2188, GBPUSD 1.4636 against 1.2650, XAUUSD 1.3839 against 1.3336. ★ The count is larger in all four.
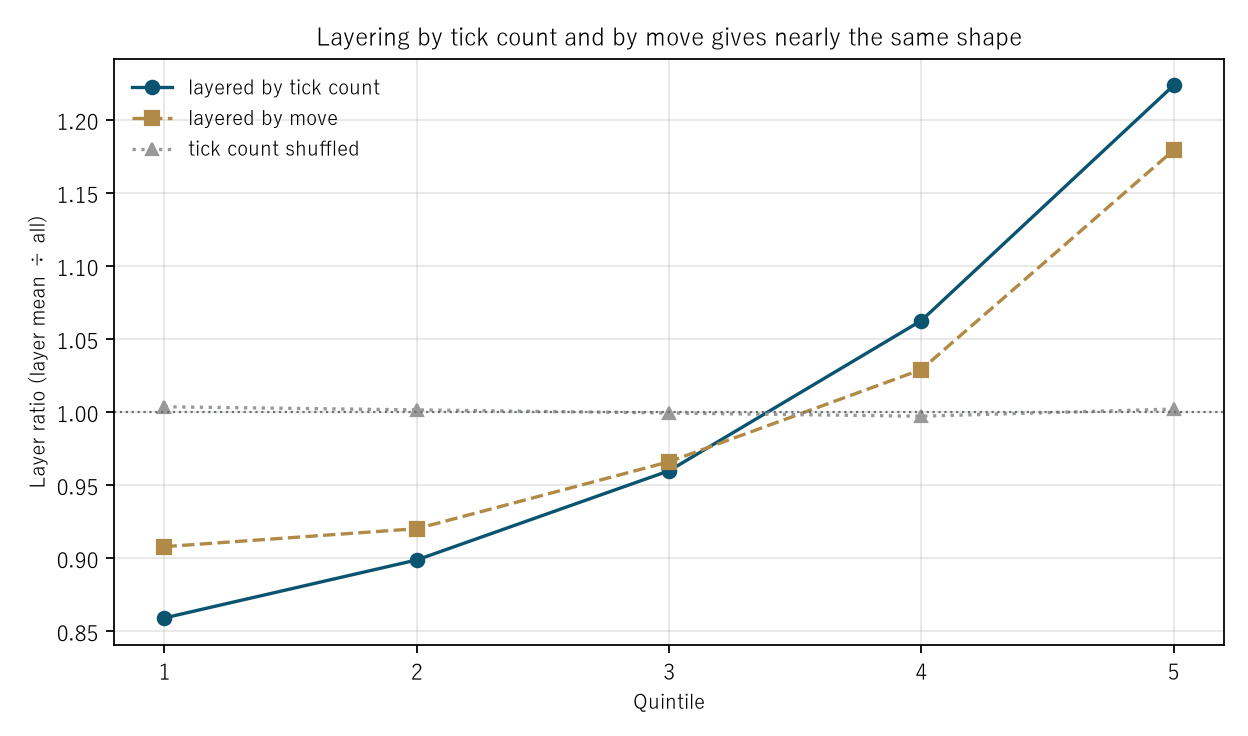
Figure 1: quintile on the horizontal axis and the layer ratio on the vertical. Circles are layered by count, squares by move, and grey is the shuffled count. The dotted line is 1.
5. Which one carries the extra information
Hold one equal and split by the other.
Calculation 5.1 Hold the move equal and split by the count (median of the four instruments)
| Move quintile | Higher count | Lower count | Difference |
|---|---|---|---|
| 1 | 0.9748 | 0.8363 | 0.1385 |
| 2 | 1.0045 | 0.8465 | 0.1581 |
| 3 | 1.0466 | 0.8876 | 0.1591 |
| 4 | 1.0954 | 0.9472 | 0.1483 |
| 5 | 1.2872 | 1.0800 | 0.2072 |
Observation 5.2: ★ Prediction ⑤ failed. With the move held equal the count still separates by 0.1581 — nearly half of the 0.3644 when nothing is held equal.
Observation 5.3: The direction is the same in all five layers. The difference runs from 0.1385 to 0.2072: ★ whatever the size of the move, the side with the higher count moves more afterwards.
Calculation 5.4 Reversed: hold the count equal and split by the move (★ added afterwards)
This part is after the fact. Once prediction ⑤ had failed, this was measured to decide which separates better.
| Count quintile | Larger move | Smaller move | Difference |
|---|---|---|---|
| 1 | 0.8826 | 0.8256 | 0.0571 |
| 2 | 0.9227 | 0.8706 | 0.0521 |
| 3 | 0.9740 | 0.9313 | 0.0427 |
| 4 | 1.0835 | 1.0420 | 0.0415 |
| 5 | 1.2896 | 1.1593 | 0.1303 |
Observation 5.5: ★ The reverse separates by only 0.0521. A ratio of 3.0323.
Observation 5.6: ★ So the count separates the forward move better. A bar's move is one draw from that bar, while the count sums how busy the whole hour was — a plausible reading, but the mechanism is not measured here.
Observation 5.7: So "volume restates the move" does not hold. ★ If anything, the move is the poorer stand-in for the count.
6. Does the count vary by hour, and does it carry direction?
Calculation 6.1 Median count by hour (UTC, median of the four instruments)
| Hour | Count | Hour | Count |
|---|---|---|---|
| 04:00 | 2,214 | 13:00 | 7,653 |
| 08:00 | 5,940 | 14:00 | 8,385 |
| 12:00 | 6,152 | 21:00 | 1,516 |
Observation 6.2: Prediction ③ held. Max ÷ min is 6.7719 at the median of the four instruments, and 4.6616 to 9.4111 instrument by instrument.
Observation 6.3: ★ At the median of the four it runs from 8,385 at 14:00 UTC to 1,516 at 21:00, a factor of 5.5330. The same count can be called high or low depending on the hour. That dividing by a recent window brings the hour in with it was measured in [F039]; normalizing the count runs into the same problem.
Calculation 6.4 Direction by count quintile (median of the four instruments)
| Quintile | D | Daily t | Count |
|---|---|---|---|
| 1 | 0.2143 | 0.4203 | 7,304 |
| 2 | 1.0378 | 1.0339 | 7,305 |
| 3 | 0.1113 | 0.2841 | 7,298 |
| 4 | 0.2545 | 0.2077 | 7,301 |
| 5 | −0.1672 | −0.7585 | 7,302 |
Observation 6.5: Prediction ④ held. D runs from −1.6683 to 2.3394 pips, and the daily t exceeds 2 in absolute value in 0 of 20 combinations.
Observation 6.6: ★ So what the count separates is magnitude alone, not direction. A claim that "a breakout on volume" tells you the way is not supported by this measurement. That a quantity without a sign does not separate direction was measured in [F030]; the count is such a quantity.
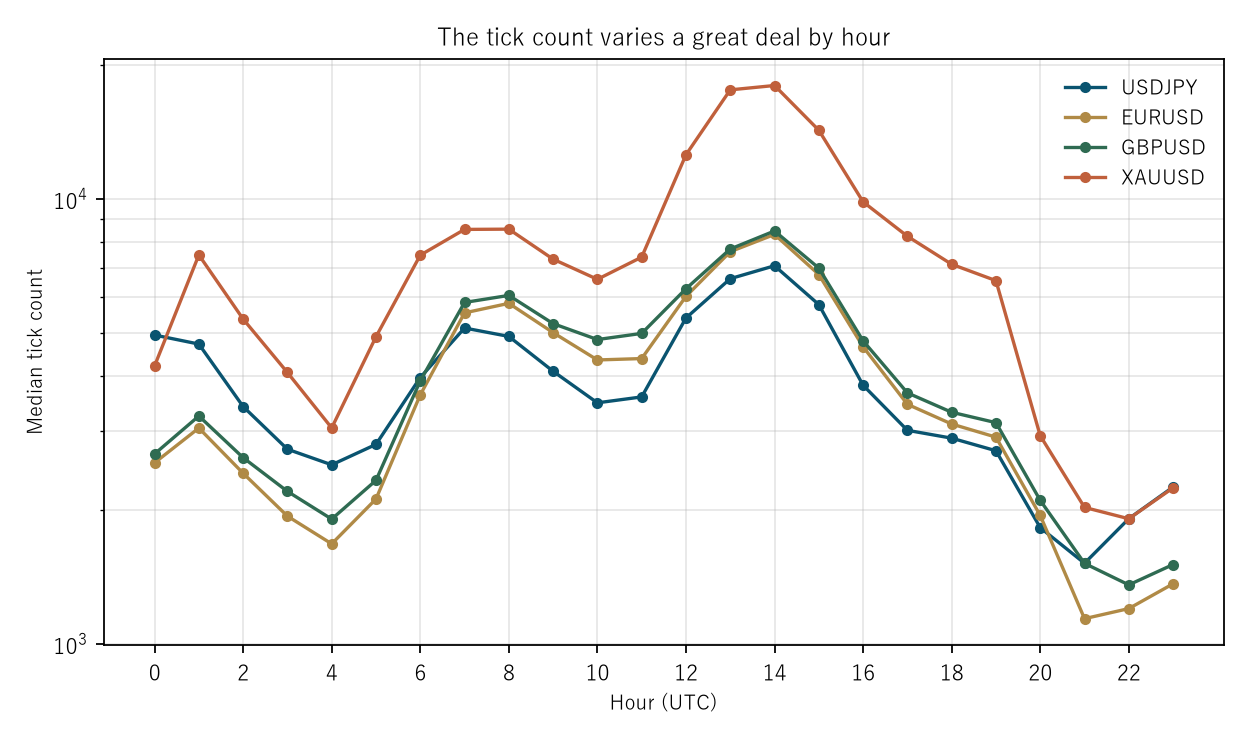
Figure 2: hour (UTC) on the horizontal axis and the median tick count on the vertical (logarithmic). Each instrument is drawn in its own colour.
7. The baseline and limitations
Calculation 7.1 Shuffling the count at random
| Measurement | Shuffled | |
|---|---|---|
| Rank correlation | 0.4860 | 0.0022 |
| Layer ratio of the fifth count quintile | 1.2237 | 1.0022 |
| Layer ratio of the first count quintile | 0.8593 | 1.0037 |
| Max ÷ min by hour | 6.7719 | 1.1043 |
Observation 7.2: Shuffled, layering by the count separates nothing. ★ The fifth and first quintiles give layer ratios of 1.0022 and 1.0037. A check, not a finding.
Limitations
- Predictions ① and ⑤ failed. The correlation is moderate, and the count separated even with the move held equal. This paper writes those failures and measures the reversed layering as well.
- No mechanism is offered. Why the count separates better is not measured.
- One feed is fixed. The count depends on the feed, and no claim is made about which is correct.
- One grid is fixed. Only one-hour bars; on another bar size the count means something else.
- One forward horizon is fixed: 24 bars ahead.
- No trading is discussed. Neither cost nor slippage is included, and the directional D is not significant.
- The baseline is not a synthetic random walk. A count cannot be built from prices, so shuffling is used as the control.
- Four instruments, six years, one-hour bars. Nothing is claimed about other markets or other periods.
Conclusion
Foreign exchange has no central exchange, so nobody knows how many lots changed hands. The "volume" shown by trading software is the number of ticks in that bar, and a tick is a quote update.
★ Two predictions failed. First, the rank correlation between the count and a bar's move is only 0.4860, running from 0.4695 to 0.5173. Not high enough to call them restatements of one another.
The shape of the layer ratio is very similar — the absolute difference has a median of 0.0335. ★ But the count spreads wider: the fifth ÷ first quintile is 1.4238 against 1.2993, and the count is larger in all four instruments.
★ And here is the core. With the move held equal, the count still separates by 0.1581 — nearly half of the 0.3644 when nothing is held equal, and in the same direction in all five layers.
★ The reverse is much smaller: holding the count equal and splitting by the move leaves 0.0521, a ratio of 3.0323. So the count separates the forward move better. "Volume restates the move" does not hold; if anything, the move is the poorer stand-in for the count.
The count varies a great deal by hour. Max ÷ min is 6.7719 at the median, running from 8,385 at 14:00 UTC to 1,516 at 21:00, a factor of 5.5330. ★ The same count can be called high or low depending on the hour.
★ But the count carries no direction. Across the quintiles the daily t exceeds 2 in absolute value in 0 of 20 combinations. What it separates is magnitude alone.
So the "volume" in foreign exchange is not a restatement of the move. ★ It is a different quantity that separates the forward magnitude better than a bar's own move does. But it does not tell you the way. And read without holding the hour equal, the number changes its meaning by up to 5.5330 times.
Data and reproduction
| Data | Foreign exchange from Dukascopy-derived ticks (from 2019 onward, matching to the millisecond, bid and ask, has been verified). Gold from Dukascopy |
| Period | 2019–2024 (six years) |
| Instruments | USDJPY, EURUSD, GBPUSD, XAUUSD |
| Bars | 1-hour, mid price, completed bars only. Bars with no ticks are not created |
| Count | The number of ticks in the bar |
| Move | |close − open| (pips) |
| Forward | The |move| 24 bars ahead (one day) and the signed move |
| Layers | Quintiles of the count and of the move; the double layering splits the upper and lower half within each quintile of the other |
| Quantities | Rank correlation, layer ratio, D and daily t, count by hour |
| Baseline | The count shuffled at random (3 draws, fixed seed) |
| Verification | 検算/F043.py (--zu also writes the figures). Every number in the text comes from 検算/F043_output.txt |
| Figures | 図/F043_zu1, 図/F043_zu2 (png, svg, English versions) |
| Substrate check | _ツール/audit_bars.py (bar look-ahead, daylight saving, day boundary). The record is _土台の検査.txt |
References
- Yamagishi, Y. (2026). Layering on a Magnitude Does Not Produce a Direction [F030]. Zenodo. 10.5281/zenodo.22893420
- Yamagishi, Y. (2026). Self-Normalization Brings In the Window You Divided By [F039]. Zenodo. 10.5281/zenodo.22894073
Reference
Yamagishi, Y. (2026). The "Volume" in Foreign Exchange Is Not a Restatement of the Move [F043]. Zenodo.
DOI: 10.5281/zenodo.22894928
YOI: https://www.yamagishiyuuki.com/yoi/F043
ORCID: 0009-0006-8587-3450
PDF (English) · PDF (Japanese) · Date proof of the English PDF (OpenTimestamps .ots) · SHA256SUMS
The record page for this paper (in Japanese, with the PDFs in each language and the date proof): YOI F043. This paper is a preprint and has not been peer reviewed.