Abstract
What this paper asks is how many losses in a row count as abnormal — and the answer is that the guide is set by the win rate and the count alone. No new mathematical theorem and no new law is claimed.
First, and this is the core of the paper: ★ the longest losing streak sits on the guide log(count) ÷ log(1 ÷ loss rate). The four settings give 1.0219, 0.8255, 1.0863 and 1.0808, with a median of 1.0514 (Section 4).
Second, ★ a synthetic random walk sits on the same guide, with a median of 0.8727. The guide is not a property of the market but the arithmetic of independent wins and losses (Section 7).
Third, ★ shuffling alone moves the longest streak a great deal. At the median of the four instruments it runs from 7.0 to 23.0, a maximum ÷ minimum of 3.3333 (Section 5).
Fourth, ★ prediction ③ failed: 3 of 16 combinations exceeded the 0.95 percentile. All three are GBPUSD, however, so they are not three independent cases (Section 5).
Fifth, ★ prediction ① failed too: the win rate moved only from 0.4682 to 0.6077. A distant take-profit is decided by the deadline instead, and the share decided that way rises from 0.2203 to 0.7034 (Section 3).
Sixth, the win rate and the count do not move under shuffling. ★ They cannot, by definition: a check, not a finding (Section 6).
Scope of this paper: no new mathematical theorem and no new law is claimed — the guide for the longest run in independent trials is a classical result. No real course, author, or vendor is the subject here, and none is named. No trading is discussed — only the sequence of wins and losses, not the profit and loss, and no cost is included (Section 7). Predictions ① and ③ failed — the win rate did not spread, and 3 of 16 came out at the edge (Sections 3, 5 and 7). The guide is an approximation — not an exact distribution, only a way to see the order of magnitude (Section 7). The three at the edge are the same instrument — they must not be counted as three independent cases (Section 5). The scope is intraday and few instruments — four instruments over six years on one-hour bars. Results documented at longer holding periods, such as monthly time-series momentum, are not contradicted. No prediction is claimed.
1. Notation and the question
"Seventeen losses in a row." "The method is broken." Both get said often.
| What gets said | What does not get said |
|---|---|
| Seventeen losses in a row | How many in a row would count as abnormal |
| The method broke | That at the same win rate and count it might be ordinary |
| It cannot keep going like this | That more trades make the longest streak longer |
Observation 1.1: ★ The length of a losing streak has a guide made of the win rate and the count alone. For independent trials the longest run lands near log(count) ÷ log(1 ÷ loss rate).
Observation 1.2: And changing the order changes the longest streak for the same set of wins and losses. ★ The total and the win rate do not change; only the arrangement in between does. That the maximum drawdown belongs to the order of the trades was measured in [F031]. This paper poses the same question for the sequence of wins and losses rather than the profit and loss.
Observation 1.3: The separator is the order the trades are placed in. The set of wins and losses, the count and the win rate are all held fixed, and only the order is changed.
Question: how far is the actual arrangement's longest losing streak from the guide?
2. State the quantities and the design first
Declared before the run and unchanged during it.
| Grid | 1-hour bars (mid price, completed bars only) |
| Trades | Direction from a 20/80 moving-average cross, one trade every 24 bars (non-overlapping) |
| Win or loss | Whichever comes first, take-profit = k × σ or stop = σ. On reaching the deadline (24 bars), the final sign decides |
| σ | The standard deviation of the 24-bar forward move over the selection period (up to 2022-01-01) |
| k | 0.5 / 1 / 2 / 4 |
| Shuffles | 1,000 (fixed seed) |
| Guide | log(count) ÷ log(1 ÷ loss rate) |
| Quantities | Win rate, longest losing streak, longest winning streak, the shuffled distribution and percentile, the ratio to the guide |
| Baseline | Synthetic random walk down to within the bar (3 draws) |
| Separator | The order the trades are placed in |
| Instruments and period | USDJPY, EURUSD, GBPUSD, XAUUSD / 2019–2024 |
Observation 2.1: ★ If both the take-profit and the stop are touched on the same bar, the stop counts as first. The adverse side is taken first by convention.
Observation 2.2: The counts run from 1,450 to 1,519. σ runs from USDJPY's 44.8971 to XAUUSD's 167.3431 pips.
Observation 2.3: ★ k is varied in order to move the win rate. A nearer take-profit should raise it and a more distant one lower it.
Observation 2.4: The guide is an approximation. ★ Not an exact distribution, only a way to see the order of magnitude.
Predictions (written before measuring)
① Changing the take-profit-to-stop ratio moves the win rate a great deal, as designed.
② The longest losing streak sits close to log(count) ÷ log(1 ÷ loss rate).
③ The actual arrangement's longest streak lies inside the shuffled distribution (percentile not above 0.95).
④ The total and the win rate do not move at all under shuffling (a check).
⑤ A synthetic random walk also satisfies ②.
3. Moving the win rate by design
The same trades and the same directions. Only the take-profit-to-stop ratio differs.
Calculation 3.1 The four settings (median of the four instruments)
| k | Count | Win rate | Loss rate | Longest losing | Longest winning |
|---|---|---|---|---|---|
| 0.5 | 1,518 | 0.6077 | 0.3923 | 8.0 | 13.0 |
| 1.0 | 1,518 | 0.5091 | 0.4909 | 8.5 | 10.5 |
| 2.0 | 1,518 | 0.4699 | 0.5301 | 12.5 | 9.5 |
| 4.0 | 1,518 | 0.4682 | 0.5318 | 12.5 | 9.5 |
Observation 3.2: ★ Prediction ① failed. The win rate moves only from 0.4682 to 0.6077 (a factor of 1.2980). k=2 and k=4 are almost the same.
Calculation 3.3 Why the win rate did not move as expected (★ added afterwards)
This part is after the fact. Once prediction ① had failed, the reason was measured.
| k | Win rate | Share decided by the deadline |
|---|---|---|
| 0.5 | 0.6077 | 0.2203 |
| 1.0 | 0.5091 | 0.4440 |
| 2.0 | 0.4699 | 0.6402 |
| 4.0 | 0.4682 | 0.7034 |
Observation 3.4: ★ A distant take-profit is never touched before the deadline, so the final sign decides instead. The share decided that way rises from 0.2203 to 0.7034.
Observation 3.5: ★ That is why k=2 and k=4 give almost the same win rate. In both, most trades are decided by "the sign 24 bars later", and the take-profit's position no longer does anything.
Observation 3.6: The same holds instrument by instrument. The win rate at k=4 runs from 0.4460 to 0.4862.
4. Does the longest losing streak sit on the guide?
Guide = log(count) ÷ log(1 ÷ loss rate), set by the win rate and the count alone.
Calculation 4.1 Measurement against guide (median of the four instruments)
| k | Loss rate | Longest losing, measured | Guide | Measured ÷ guide | Shuffled median |
|---|---|---|---|---|---|
| 0.5 | 0.3923 | 8.0 | 7.8282 | 1.0219 | 7.0 |
| 1.0 | 0.4909 | 8.5 | 10.2969 | 0.8255 | 9.2 |
| 2.0 | 0.5301 | 12.5 | 11.5069 | 1.0863 | 10.0 |
| 4.0 | 0.5318 | 12.5 | 11.5650 | 1.0808 | 10.5 |
Observation 4.2: ★ This is the core of the paper, and prediction ② held. Measured ÷ guide is 1.0219, 0.8255, 1.0863 and 1.0808, with a median of 1.0514.
Observation 4.3: ★ The shuffled median sits on the guide too: 0.8942, 0.8983, 0.8690 and 0.9079, with a median of 0.8963. The guide runs a little large, but the order of magnitude agrees.
Calculation 4.4 By instrument (longest losing, measured / guide)
| Instrument | k=0.5 | k=1.0 | k=2.0 | k=4.0 |
|---|---|---|---|---|
| USDJPY | 8 / 7.86 | 8 / 10.29 | 13 / 11.82 | 13 / 12.40 |
| EURUSD | 7 / 7.38 | 8 / 10.30 | 9 / 11.56 | 9 / 11.61 |
| GBPUSD | 11 / 7.79 | 11 / 10.16 | 15 / 10.92 | 15 / 11.00 |
| XAUUSD | 8 / 7.87 | 9 / 10.52 | 12 / 11.45 | 12 / 11.52 |
Observation 4.5: ★ GBPUSD alone runs longer than the guide in all four settings: 11 against 7.79, 11 against 10.16, 15 against 10.92 and 15 against 11.00.
Observation 4.6: The other three fall on both sides of the guide. ★ EURUSD at k=2 and k=4 is 9 against 11.56 — shorter, if anything.
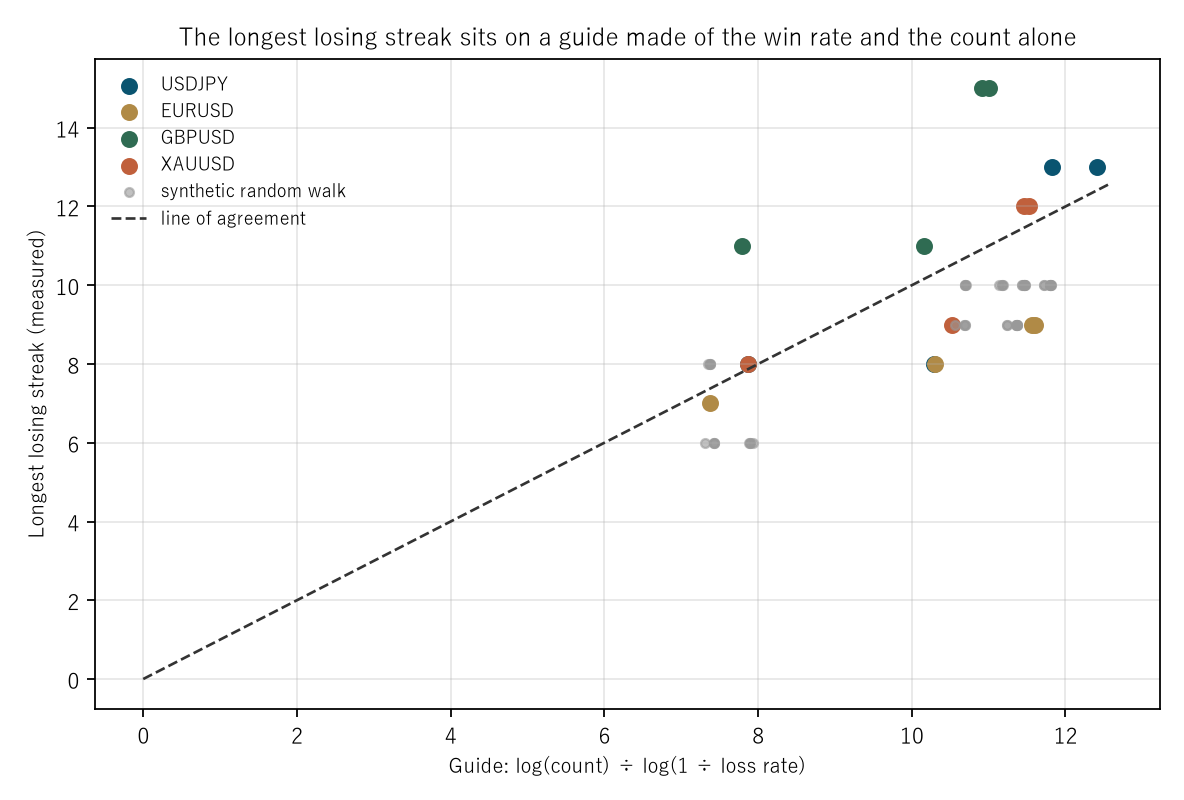
Figure 1: the guide log(count) ÷ log(1 ÷ loss rate) on the horizontal axis and the measured longest losing streak on the vertical. Coloured points are the four instruments, grey is the synthetic random walk, and the dashed line is where they would agree.
5. Where the actual arrangement falls in the distribution
Calculation 5.1 One thousand shuffles (median of the four instruments)
| k | Measured | Shuffled min | Shuffled median | Shuffled max | Percentile |
|---|---|---|---|---|---|
| 0.5 | 8.0 | 5.0 | 7.0 | 14.5 | 0.5670 |
| 1.0 | 8.5 | 6.0 | 9.2 | 20.0 | 0.1430 |
| 2.0 | 12.5 | 7.0 | 10.0 | 23.0 | 0.7670 |
| 4.0 | 12.5 | 7.0 | 10.5 | 19.5 | 0.7115 |
Observation 5.2: ★ Shuffling alone moves the longest streak a great deal. At k=1.0 it runs from 6.0 to 20.0, a maximum ÷ minimum of 3.3333.
Observation 5.3: ★ Prediction ③ failed. The percentile has a median of 0.6325 and a range of 0.0540 to 0.9720, and 3 of 16 exceeded 0.95.
Observation 5.4: For the longest winning streak the median is 0.4440 and 2 exceed 0.95. ★ Losses and wins reach the edge about equally often.
Calculation 5.5 The three at the edge (★ added afterwards)
| Instrument | k | Measured | Shuffled median | Percentile | Guide |
|---|---|---|---|---|---|
| GBPUSD | 0.5 | 11 | 7.0 | 0.9650 | 7.7931 |
| GBPUSD | 2.0 | 15 | 10.0 | 0.9700 | 10.9168 |
| GBPUSD | 4.0 | 15 | 10.0 | 0.9720 | 11.0011 |
Observation 5.6: ★ All three are GBPUSD. They are not three independent cases: it is one sequence of trades looked at under three values of k.
Observation 5.7: ★ And even at the edge they are not far from the guide itself: 11 against 7.7931, 15 against 10.9168 and 15 against 11.0011.
Observation 5.8: Neutrally, 0.8 of the 16 would exceed 0.95. ★ Three is a little many, but as three non-independent cases nothing is concluded from it.
6. What does not move (checks)
Observation 6.1: The win rate does not move under shuffling, because only the order of the same list changed.
Observation 6.2: Nor does the count. ★ Neither can move, by definition: a check, not a finding.
Observation 6.3: A higher win rate gives a shorter losing streak and a longer winning one. At k=0.5 they are 8.0 and 13.0; at k=4.0, 12.5 and 9.5. ★ The direction the guide's formula requires.
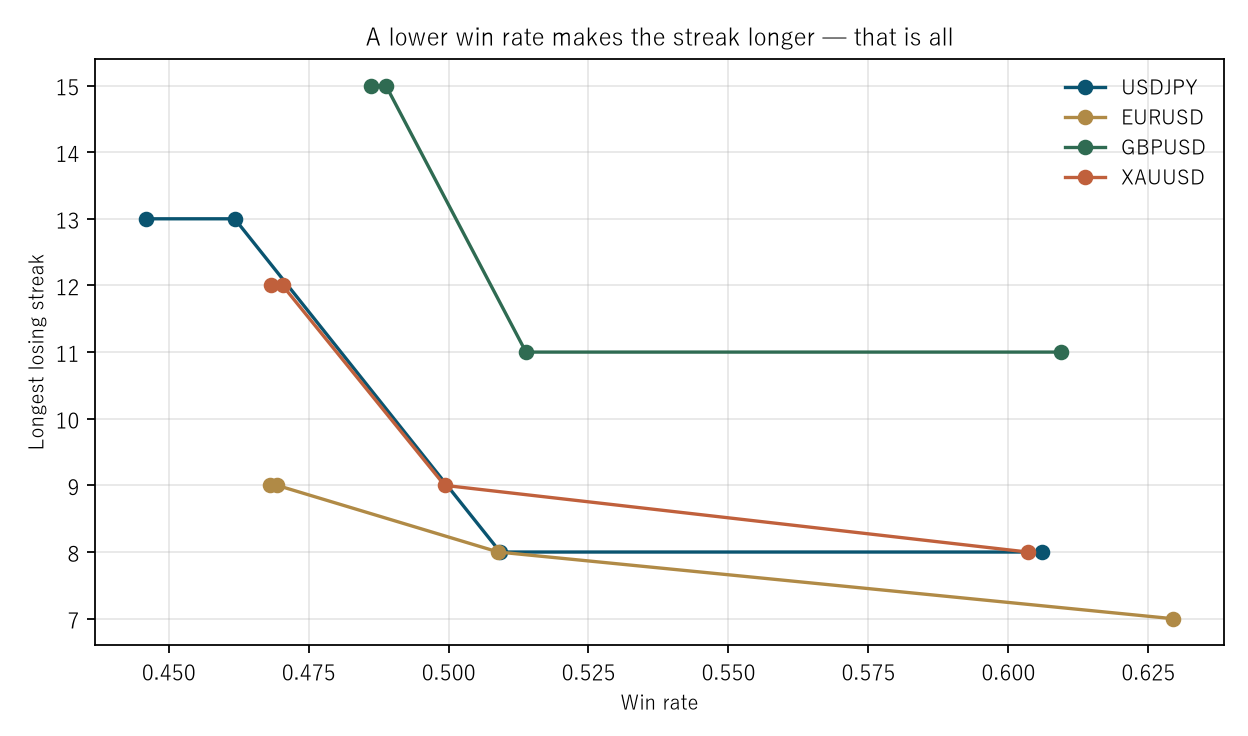
Figure 2: win rate on the horizontal axis and the longest losing streak on the vertical. Each instrument is drawn in its own colour.
7. The baseline and limitations
Calculation 7.1 The same procedure on a synthetic random walk
| k | Measured ÷ guide | Random walk ÷ guide | Measured percentile | Random walk percentile |
|---|---|---|---|---|
| 0.5 | 1.0219 | 0.8083 | 0.5670 | 0.0765 |
| 1.0 | 0.8255 | 0.9354 | 0.1430 | 0.3680 |
| 2.0 | 1.0863 | 0.8727 | 0.7670 | 0.2460 |
| 4.0 | 1.0808 | 0.8727 | 0.7115 | 0.2545 |
Observation 7.2: ★ Prediction ⑤ held: the synthetic random walk sits on the same guide, with a median of 0.8727.
Observation 7.3: ★ So the guide is not a property of the market but the arithmetic of independent wins and losses. A series with zero directional information produces streaks of the same length. What this baseline is zero about was measured in [F033].
Observation 7.4: The random walk's percentiles are lower at the median than the measurement's. ★ But in the sense that none of the four exceeds 0.95, they are the same.
Limitations
- Predictions ① and ③ failed. The win rate did not spread, and 3 of 16 came out at the edge. This paper writes those failures and, for ①, measures the reason (the share decided by the deadline).
- The three at the edge are the same instrument. They must not be counted as three independent cases.
- The guide is an approximation. Not an exact distribution, only a way to see the order of magnitude.
- One way of deciding win or loss is fixed: on reaching the deadline, the final sign decides.
- One sequence of trades is fixed: the direction of a 20/80 moving-average cross.
- The profit and loss is not examined. Only the sequence of wins and losses, with no cost included.
- There are 1,000 shuffles. The percentile resolves to a thousandth at best.
- Four instruments, six years, one-hour bars. Nothing is claimed about other markets or other periods.
Conclusion
"Seventeen losses in a row." "The method is broken." But how many in a row counts as abnormal has a guide made of the win rate and the count alone.
★ The longest losing streak sits on log(count) ÷ log(1 ÷ loss rate). Across the four settings, measured ÷ guide is 1.0219, 0.8255, 1.0863 and 1.0808, with a median of 1.0514.
★ A synthetic random walk sits on the same guide, with a median of 0.8727. The guide is not a property of the market but the arithmetic of independent wins and losses. A series with zero directional information produces streaks of the same length.
★ And shuffling alone moves the longest streak a great deal. At k=1.0 it runs from 6.0 to 20.0, a factor of 3.3333. The total, the win rate and the count are unchanged; only the arrangement in between differs.
★ Two predictions failed. The win rate moved only from 0.4682 to 0.6077. A distant take-profit is never touched before the deadline, so the final sign decides instead, and the share decided that way rises from 0.2203 to 0.7034 — which is why k=2 and k=4 give almost the same win rate.
★ The other was that 3 of 16 exceeded the 0.95 percentile. Neutrally 0.8 would, so three is a little many. But all three are GBPUSD: one sequence of trades looked at under three values of k, not three independent cases. And even at the edge they are not far from the guide (11 against 7.7931, 15 against 10.9168, 15 against 11.0011).
So what is needed when reporting a losing streak is the guide that follows from the win rate and the count. ★ Whether "seventeen in a row" is abnormal cannot be judged without stating those two. And for the same set of wins and losses, rearranging them moves the longest streak by more than three times.
Data and reproduction
| Data | Foreign exchange from Dukascopy-derived ticks (from 2019 onward, matching to the millisecond, bid and ask, has been verified). Gold from Dukascopy |
| Period | 2019–2024 (six years) |
| Instruments | USDJPY, EURUSD, GBPUSD, XAUUSD |
| Bars | 1-hour, mid price, completed bars only. Bars with no ticks are not created |
| Trades | Direction from a 20/80 moving-average cross, one trade every 24 bars (non-overlapping) |
| Win or loss | Whichever comes first, take-profit = k × σ or stop = σ (k = 0.5, 1, 2, 4). On the deadline (24 bars), the final sign. Both on the same bar counts as the stop |
| σ | The standard deviation of the 24-bar forward move over the selection period (up to 2022-01-01) |
| Shuffles | 1,000 (fixed seed) |
| Guide | log(count) ÷ log(1 ÷ loss rate) |
| Quantities | Win rate, longest losing and winning streaks, the shuffled distribution and percentile, the ratio to the guide, the share decided by the deadline |
| Baseline | Synthetic random walk down to within the bar (3 draws), built by adding differences of constant spread |
| Verification | 検算/F044.py (--zu also writes the figures). Every number in the text comes from 検算/F044_output.txt |
| Figures | 図/F044_zu1, 図/F044_zu2 (png, svg, English versions) |
| Random seeds | Fixed. Re-running gives the same values |
| Substrate check | _ツール/audit_bars.py (bar look-ahead, daylight saving, day boundary). The record is _土台の検査.txt |
References
- Yamagishi, Y. (2026). The Maximum Drawdown Belongs to the Order of the Trades [F031]. Zenodo. 10.5281/zenodo.22893510
- Yamagishi, Y. (2026). A Synthetic Random Walk Has No Volatility Clustering [F033]. Zenodo. 10.5281/zenodo.22893674
Reference
Yamagishi, Y. (2026). The Longest Losing Streak Is Set by the Win Rate and the Count [F044]. Zenodo.
DOI: 10.5281/zenodo.22895010
YOI: https://www.yamagishiyuuki.com/yoi/F044
ORCID: 0009-0006-8587-3450
PDF (English) · PDF (Japanese) · Date proof of the English PDF (OpenTimestamps .ots) · SHA256SUMS
The record page for this paper (in Japanese, with the PDFs in each language and the date proof): YOI F044. This paper is a preprint and has not been peer reviewed.