Abstract
What this paper asks is how long an exponential moving average remembers where it was started — and the answer is about six times the period in bars. No new mathematical theorem and no new law is claimed.
First, and this is the core of the paper: ★ started from zero, an exponential moving average takes 116 bars at N=20, 292 at N=50 and 1,168 at N=200 to catch up. Bars ÷ N is 5.83, 5.84 and 5.84, with a maximum ÷ minimum of 1.0026 — almost perfectly proportional (Section 3).
Second, a simple moving average forgets in N bars. It catches up in 19, 49 and 199, and never exceeds N (Section 4).
Third, ★ at the same N and the same initialization, the exponential takes 5.87 to 6.13 times as long as the simple. Under the same name, "a twenty-bar moving average", the warm-up required differs sixfold (Section 4).
Fourth, ★ prediction ③ failed. The verdict stops disagreeing sooner than the value does. Bars until the verdict agrees ÷ bars until the value catches up has a median of 0.4787. The price is usually well away from the average, so a small error rarely flips which side it is on (Section 5).
Fifth, ★ prediction ④ half held. Pooling the three initializations, bars ÷ N has a maximum ÷ minimum of 3.1064; for the start from zero alone it is 1.0026. Proportionality breaks because the initial error itself changes with N (Section 3).
Sixth, ★ none of this is a property of the market. A synthetic random walk needs the same number of bars (measurement ÷ random walk, median 0.9278). It is the arithmetic of a recurrence (Section 7).
Scope of this paper: no new mathematical theorem and no new law is claimed — the decay of the initial value in exponential smoothing is elementary. No real course, author, or vendor is the subject here, and none is named. No particular implementation is the subject — which trading software initializes how was not examined (Section 7). No trading is discussed — neither performance nor profit and loss is measured (Section 7). Prediction ③ failed — the verdict stopped disagreeing sooner than the value did (Sections 5 and 7). One criterion for agreement is fixed — 0.1 of a price tick; a different criterion gives different counts (Section 7). The scope is intraday and few instruments — four instruments over six years on one-hour bars. Results documented at longer holding periods, such as monthly time-series momentum, are not contradicted. No prediction is claimed.
1. Notation and the question
An exponential moving average is a recurrence: x[t] = a·v[t] + (1−a)·x[t−1].
| What gets said | What does not get said |
|---|---|
| A twenty-bar moving average was used | Where that average was started |
| The indicator read this | That the early values depend on the initialization |
| Enough data was used | How many bars "enough" is |
Observation 1.1: ★ A recurrence never discards the past. The weight on the initial value decays as (1−a)^n, but it never reaches zero.
Observation 1.2: A simple moving average is different. ★ A value that leaves the window is gone for good. It forgets completely in N bars.
Observation 1.3: The separator is the initialization. The series, the period and the instruments are all held fixed, and only where it was started is changed.
Question: up to which bar do the value and the verdict disagree between two initializations?
2. State the quantities and the design first
Declared before the run and unchanged during it.
| Grid | 1-hour bars (mid price, completed bars only) |
| Smoothing | Exponential (a = 2/(N+1)) / Wilder (a = 1/N) / simple moving average |
| Period | N = 20 / 50 / 200 (RSI fixed at 14) |
| Initialization | A the first value / B the mean of the first N / C zero |
| Correct version | Started 5,000 bars before the comparison window |
| Verdict | Whether the price is above or below the average / whether RSI exceeds 70 |
| Criterion for agreement | The difference falls below 0.1 of a price tick (0.1 for RSI) and never exceeds it again |
| Baseline | Synthetic random walk down to within the bar (3 draws) |
| Separator | The initialization (where it was started) |
| Instruments and period | USDJPY, EURUSD, GBPUSD, XAUUSD / 2019–2024 |
Observation 2.1: ★ The definition of "catches up" is the point. Falling below once is not enough; the position taken is where it never exceeds the criterion again.
Observation 2.2: The comparison window runs from 29,892 to 31,534 bars. ★ The correct version starts 5,000 bars earlier, which is 25 times N=200.
Observation 2.3: ★ Initialization C (zero) is extreme. But because the initial error does not depend on N, it is the right one for testing proportionality.
Observation 2.4: For the simple average too, the first N−1 bars use a window padded with the initial value. ★ A form commonly seen in implementations.
Predictions (written before measuring)
① The difference between two initializations decays as (1−a)^n.
② A simple moving average agrees exactly at N bars (a finite memory).
③ Even once the values are close, the verdict keeps disagreeing for a long time, because near a threshold a small difference flips the side.
④ The warm-up required is roughly proportional to the period.
⑤ A synthetic random walk needs the same number of bars (arithmetic, not the market).
3. How many bars until the value catches up
"Catches up" = the difference falls below 0.1 of a price tick and never exceeds it again.
Calculation 3.1 Exponential moving average (median of the four instruments)
| N | Initialization | Initial difference (pips) | Bars to catch up | Bars ÷ N |
|---|---|---|---|---|
| 20 | A first value | 8.6839 | 45 | 2.25 |
| 20 | B mean of first N | 7.4321 | 44 | 2.17 |
| 20 | C zero | 10907.5908 | 116 | 5.83 |
| 50 | A first value | 6.7104 | 106 | 2.11 |
| 50 | B mean of first N | 4.6803 | 94 | 1.88 |
| 50 | C zero | 11555.5884 | 292 | 5.84 |
| 200 | A first value | 64.8450 | 647 | 3.23 |
| 200 | B mean of first N | 59.1305 | 636 | 3.18 |
| 200 | C zero | 11774.4125 | 1,168 | 5.84 |
Observation 3.2: ★ This is the core of the paper. Started from zero, N=200 takes 1,168 bars. On one-hour bars that is about seven weeks.
Observation 3.3: ★ Prediction ① held. Bars ÷ N is nearly constant across N, with a median of 3.18. If the difference decays as (1−a)^n, the bars needed to fall to a fixed fraction are 1/a, that is, proportional to N.
Calculation 3.4 Initialization by initialization (★ added afterwards)
| Initialization | Range of bars ÷ N | Max ÷ min |
|---|---|---|
| A first value | 2.11 – 3.23 | 1.5332 |
| B mean of first N | 1.88 – 3.18 | 1.6928 |
| C zero | 5.83 – 5.84 | 1.0026 |
Observation 3.5: ★ Prediction ④ half held. Pooled, the maximum ÷ minimum is 3.1064; for the start from zero alone it is 1.0026.
Observation 3.6: ★ Proportionality breaks because the initial error itself changes with N. Under A and B the initial difference runs from 4.6803 pips at N=50 to 64.8450 at N=200. Started from zero, the initial difference is the price itself, whatever N is.
4. A simple moving average forgets with a finite memory
Calculation 4.1 Simple moving average (median of the four instruments)
| N | Initialization | Initial difference (pips) | Bars to catch up |
|---|---|---|---|
| 20 | A first value | 10.1613 | 19 |
| 20 | C zero | 11451.8200 | 19 |
| 50 | A first value | 8.5452 | 48 |
| 50 | C zero | 11789.0715 | 49 |
| 200 | A first value | 63.8654 | 195 |
| 200 | C zero | 11802.7115 | 199 |
Observation 4.2: Prediction ② held. It catches up in 19, 49 and 199 bars, and ★ never exceeds N.
Observation 4.3: It can stop short. ★ That happens when the initial value is close and the criterion is already met early on.
Observation 4.4: ★ An initial difference of 11,802.7115 pips disappears completely in 199 bars. A value that leaves the window is gone for good.
Calculation 4.5 Exponential against simple (same N, same initialization C zero)
| N | Exponential | Simple | Ratio |
|---|---|---|---|
| 20 | 116 | 19 | 6.13 |
| 50 | 292 | 49 | 5.96 |
| 200 | 1,168 | 199 | 5.87 |
Observation 4.6: ★ Under the same name, "an N-bar moving average", the warm-up required differs by 5.87 to 6.13 times. Same name, different way of forgetting.
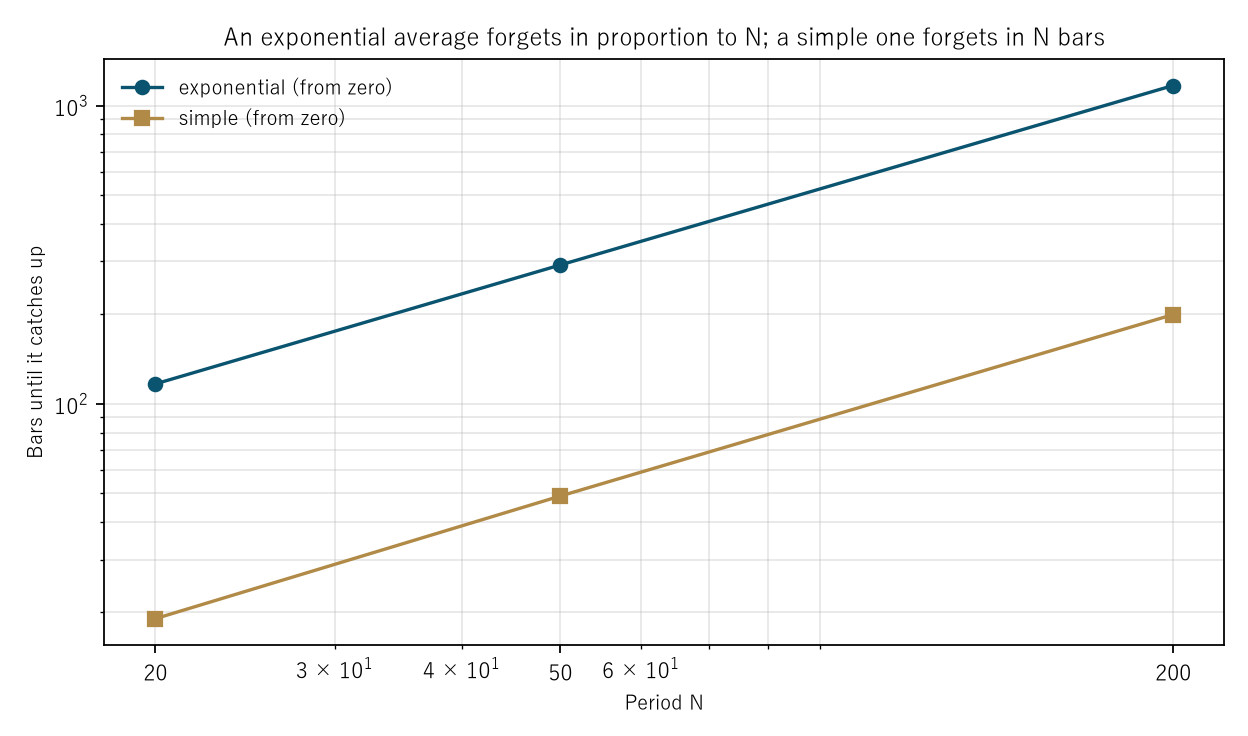
Figure 1: period N on the horizontal axis and bars until it catches up on the vertical (both logarithmic). Circles are the exponential average and squares the simple one, both started from zero.
5. How long the verdict keeps disagreeing
Verdict = whether the price is above or below the average.
Calculation 5.1 Value and verdict (median of the four instruments)
| N | Initialization | Value catches up | Verdict agrees | Disagreement in the first 1,000 bars |
|---|---|---|---|---|
| 20 | A first value | 45 | 16 | 0.0055 |
| 20 | C zero | 116 | 82 | 0.0325 |
| 50 | A first value | 106 | 28 | 0.0060 |
| 50 | C zero | 292 | 232 | 0.0945 |
| 200 | A first value | 647 | 254 | 0.0655 |
| 200 | C zero | 1,168 | 850 | 0.2450 |
Observation 5.2: ★ Prediction ③ failed. The verdict stops disagreeing sooner than the value does. Verdict ÷ value has a median of 0.4787 and a range of 0.1609 to 0.7945.
Observation 5.3: ★ The reason is simple: the price is usually well away from the average, so a small error rarely flips which side it is on. I had been thinking of "right next to the threshold", but that is a small part of the whole.
Observation 5.4: ★ Even so, started from zero at N=200, 0.2450 of the first 1,000 bars disagree. One bar in four.
Observation 5.5: Choosing the initialization shrinks it a great deal. With A (the first value) it is 0.0655 even at N=200. ★ It does not reach zero, however.
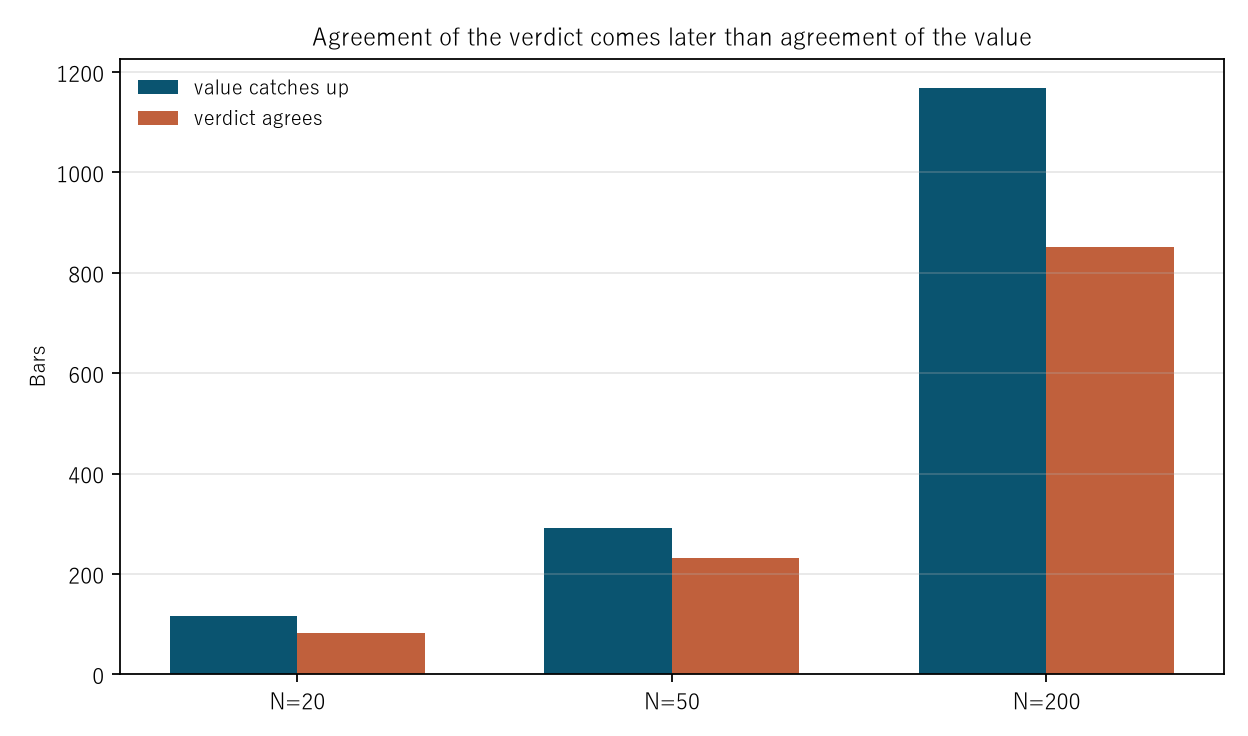
Figure 2: bars until the value catches up and bars until the verdict agrees, for the three periods, started from zero.
6. What about RSI (Wilder smoothing, 14)?
Verdict = whether RSI exceeds 70.
Calculation 6.1 The three initializations (median of the four instruments)
| Initialization | Initial difference | Value catches up | Verdict agrees | Disagreement in the first 1,000 bars |
|---|---|---|---|---|
| A first value | 4.6161 | 65 | 0 | 0.0000 |
| B mean of first N | 6.2961 | 62 | 0 | 0.0000 |
| C zero | 50.4070 | 66 | 6 | 0.0030 |
Observation 6.2: ★ The value takes 62 to 66 bars to catch up — 4.43 to 4.71 times N=14.
Observation 6.3: ★ But the verdict "does it exceed 70" barely disagrees at all: 0 bars under A and B, and 6 even under C (from zero).
Observation 6.4: ★ Here too the verdict settles before the value. A plausible reading is that RSI spends little time right beside 70, but this paper does not measure that. That the "overbought 70" of RSI belongs to the bar size was measured in [F004]. What this paper adds is that the same 70 also depends on the initialization.
Observation 6.5: The initial difference from zero is as large as 50.4070. ★ RSI runs from 0 to 100, so that is half of it.
7. The baseline and limitations
Calculation 7.1 The same procedure on a synthetic random walk (bars to catch up)
| N | Initialization | Measurement | Random walk | Ratio |
|---|---|---|---|---|
| 20 | A first value | 45 | 48 | 0.9278 |
| 20 | C zero | 116 | 116 | 1.0043 |
| 50 | A first value | 106 | 146 | 0.7201 |
| 50 | C zero | 292 | 290 | 1.0069 |
| 200 | A first value | 647 | 657 | 0.9848 |
| 200 | C zero | 1,168 | 1,162 | 1.0056 |
Observation 7.2: Prediction ⑤ held. Measurement ÷ random walk has a median of 0.9278 and a range of 0.5987 to 1.0069.
Observation 7.3: ★ Started from zero they almost coincide: 1.0043, 1.0069 and 1.0056. The initial difference does not depend on the series.
Observation 7.4: ★ So this is not a property of the market but the arithmetic of a recurrence. Any series remembers just as long. What this baseline is zero about was measured in [F033].
Limitations
- Prediction ③ failed. The verdict stopped disagreeing sooner than the value did. This paper writes that failure and states the reason (the price is usually well away from the average).
- One criterion for agreement is fixed: 0.1 of a price tick. A different criterion gives different counts.
- No particular implementation is the subject. Which trading software initializes how was not examined.
- No trading is discussed. Neither performance nor profit and loss is measured.
- Why the RSI verdict barely disagrees is not measured. Little time spent beside 70 is a plausible reading, but it was not measured.
- Three initializations are fixed. Implementations use other forms too.
- One grid is fixed: one-hour bars only.
- Four instruments, six years. Nothing is claimed about other markets or other periods.
Conclusion
An exponential moving average is a recurrence. So where it was started stays with it.
★ Started from zero, it takes 116 bars at N=20, 292 at N=50 and 1,168 at N=200 to catch up. On one-hour bars, N=200 is about seven weeks.
★ Bars ÷ N is 5.83, 5.84 and 5.84, a maximum ÷ minimum of 1.0026: almost perfectly proportional. Which is what a decay of (1−a)^n requires.
A simple moving average forgets in N bars. It catches up in 19, 49 and 199, never exceeding N. An initial difference of 11,802.7115 pips disappears completely in 199 bars.
★ Under the same name, "an N-bar moving average", the warm-up required differs by 5.87 to 6.13 times. Same name, different way of forgetting.
★ Two predictions failed. One is that the verdict stopped disagreeing sooner than the value (verdict ÷ value, median 0.4787). The price is usually well away from the average, so a small error rarely flips which side it is on. I had been thinking of "right next to the threshold", but that is a small part of the whole.
★ The other is proportionality: pooling the three initializations gives a maximum ÷ minimum of 3.1064. For the start from zero alone it is 1.0026. It breaks because the initial error itself changes with N.
★ And none of this is a property of the market. A synthetic random walk needs the same number of bars (measurement ÷ random walk, median 0.9278; from zero, 1.0043, 1.0069 and 1.0056). It is the arithmetic of a recurrence.
So what exponential smoothing needs is a warm-up of about six times the period. ★ And "the value already agrees" and "the verdict already agrees" are different moments — in this measurement the verdict settled first. But start N=200 from zero and 0.2450 of the first 1,000 bars come out on the wrong side.
Data and reproduction
| Data | Foreign exchange from Dukascopy-derived ticks (from 2019 onward, matching to the millisecond, bid and ask, has been verified). Gold from Dukascopy |
| Period | 2019–2024 (six years) |
| Instruments | USDJPY, EURUSD, GBPUSD, XAUUSD |
| Bars | 1-hour, mid price, completed bars only. Bars with no ticks are not created |
| Smoothing | Exponential (a = 2/(N+1)) / Wilder (a = 1/N) / simple moving average |
| Period | N = 20, 50, 200 (RSI at 14) |
| Initialization | A the first value / B the mean of the first N / C zero |
| Correct version | Started 5,000 bars before the comparison window |
| Criterion | The difference falls below 0.1 of a price tick (0.1 for RSI) and never exceeds it again |
| Verdict | Whether the price is above or below the average / whether RSI exceeds 70 |
| Baseline | Synthetic random walk down to within the bar (3 draws), built by adding differences of constant spread |
| Verification | 検算/F045.py (--zu also writes the figures). Every number in the text comes from 検算/F045_output.txt |
| Figures | 図/F045_zu1, 図/F045_zu2 (png, svg, English versions) |
| Random seeds | Fixed. Re-running gives the same values |
| Substrate check | _ツール/audit_bars.py (bar look-ahead, daylight saving, day boundary). The record is _土台の検査.txt |
References
- Yamagishi, Y. (2026). The "Overbought 70" of RSI Belongs to the Bar Size You Chose [F004]. Zenodo. 10.5281/zenodo.22881156
- Yamagishi, Y. (2026). A Synthetic Random Walk Has No Volatility Clustering [F033]. Zenodo. 10.5281/zenodo.22893674
Reference
Yamagishi, Y. (2026). An Exponential Moving Average Remembers Its Starting Value for Hundreds of Bars [F045]. Zenodo.
DOI: 10.5281/zenodo.22895092
YOI: https://www.yamagishiyuuki.com/yoi/F045
ORCID: 0009-0006-8587-3450
PDF (English) · PDF (Japanese) · Date proof of the English PDF (OpenTimestamps .ots) · SHA256SUMS
The record page for this paper (in Japanese, with the PDFs in each language and the date proof): YOI F045. This paper is a preprint and has not been peer reviewed.