Abstract
What this paper asks is how much the answer moves when the trades are held exactly the same and only the data used to decide "did it touch the barrier" is changed. No new mathematical theorem and no new law is claimed.
First, the average break barely moves. The observed win rate minus the naive (1−f) is −0.0186 at tick resolution and −0.0151 on hourly bars. Maximum ÷ minimum is 1.4338 — and that is with the resolution changed by a factor of eighteen thousand (Section 3).
Second, ★ but the count of bars that touch both barriers is set by the resolution. It is 0 at tick, 173 at one minute, 337 at five, 1,079 at fifteen and 3,547 on hourly bars. The overshoot inside a bar runs from 0.1600 to 9.2890 pips (Section 4).
Third, ★★ this is the core of the paper: layered by the depth of the pullback f, the shape is made by the resolution. The spread of the remainder over the prediction is 0.0285 at tick and 0.0976 on hourly bars (3.4240 times) (Section 7).
Fourth, ★★ the same shape appears on a synthetic random walk, whose true value is zero. Its spread is 0.0642 on hourly bars and 0.0092 at tick. On hourly bars, 0.6584 of the measured spread of 0.0976 also appears on the random walk (Section 7).
Fifth, ★ even at tick resolution the theorem is not reached. The random walk's break ÷ the prediction −s÷R has a median of 1.3473. That is closer than the 1.4514 of hourly bars, but it is not 1 (Section 6).
Sixth, ★ five of twelve predictions failed. The title was changed twice, and both times after measuring (Section 7).
Scope of this paper: no new mathematical theorem and no new law is claimed — optional stopping is a classical result. No real course, author, or vendor is the subject here, and none is named. No trading is recommended — what is measured here is only the shape of the win rate and the expectation. The title was changed twice — both times after measuring, and no prediction was rewritten (Sections 2 and 7). Even at tick resolution the theorem is not reached — the remaining reason is not decomposed (Sections 6 and 7). One treatment is fixed for a bar that touches both barriers — the loss is taken first (Section 4). The scope is intraday and few instruments — four instruments over six years. Results documented at longer holding periods, such as monthly time-series momentum, are not contradicted. No prediction is claimed.
1. Notation and the question
"Wait for the pullback," people say. A limit order is placed part of the way back into the previous leg, aiming for the extreme to be taken out.
Call the leg's origin org, its extreme ext and its length R, and the depth of the pullback f. The limit sits f×R back from ext. With a spread s, in mid terms the distance up is f·R + s and the distance down is (1−f)·R − s, which sum to R. Optional stopping then gives:
P(win) = (1−f) − s/R / expected value = −s
| What gets said | What does not get said |
|---|---|
| A deeper pullback gives a better reward ratio | That the win rate falls by exactly as much |
| This method's win rate was such and such | What that win rate was measured with |
| It touched the upper barrier first | Whether it also touched the lower one in the same bar |
Observation 1.1: ★ The break −s/R does not contain f. The depth of the pullback trades win rate against reward ratio and leaves the expectation alone.
Observation 1.2: That a stopping rule does not move the expectation was measured in [F012]. ★ What this paper varies is not the exit but how the entry is placed.
Observation 1.3: The separator here is the resolution used to decide the touch. The trades themselves are not changed at all.
Question: change only the data used to judge, and how much does the answer move?
2. State the quantities and the design first
★ This paper began from a failure to measure a different question.
The first title was "the size of the break is the spread ÷ the leg length". Predictions ②③⑥ failed, and the reason turned out to be the resolution, so the title was changed. The second title was "the size of the break belongs to what you measured it with" — but this time prediction ⑧ failed. The average break barely moved with the resolution; what moved was the shape after layering.
Observation 2.1: ★ The title was changed twice, both times after measuring. No prediction was rewritten. All twelve are answered.
| Legs | Renko built from the closes of 5-minute bars (the same legs at every resolution) |
| Turn known at | The bar where the opposite brick completes. Orders go out from the next bar |
| Limit | lim = ext − direction × f × R. The fill price is lim (never rounded in your favour) |
| Barriers | Win = reach the extreme ext first / loss = reach the origin org first, judged on the side you can close at |
| Separator | The resolution used to decide the touch (tick / 1 min / 5 min / 15 min / 1 hour) |
| Brick | Family A fixed pips (10/20 for FX, 40/80 for gold) / family B 20 and 40 times the median spread |
| Pullback | f = 0.382 / 0.5 / 0.618 / 0.786 |
| Condition | 0.382·R > B (all four f run on one common set of legs), among others |
| Baseline | Synthetic random walk down to the tick (3 draws, family A only, the same five resolutions) |
| Instruments and period | USDJPY, EURUSD, GBPUSD, XAUUSD / 2019–2024 |
Observation 2.2: ★ A turn is known only when the opposite brick completes. The discipline of [F040] is used as it stands.
Observation 2.3: ★ The legs must not be re-selected per f. Only legs whose limit is still unreached at the shallowest pullback are used, so all four values of f run on one common set.
Observation 2.4: Tick counts are 177,835,511 for USDJPY, 159,896,376 for EURUSD, 173,800,986 for GBPUSD and 287,946,827 for XAUUSD. The 5-minute bars number 438,283, 438,505, 438,199 and 418,478, and the median spreads are 0.5000, 0.3000, 0.9000 and 3.4700 pips.
Predictions declared first (written before measuring)
① The deeper the pullback, the lower the win rate, along (1−f).
② The break does not contain f; it is set by the spread ÷ the leg length.
③ So the break is inversely proportional to the leg length.
④ Instrument by instrument, the break orders by the width of the spread.
⑤ Bricks taken as multiples of the spread align the four instruments.
⑥ The expectation is −spread, whatever f and whatever the brick.
⑦ A synthetic random walk breaks by the same amount.
Later predictions (★ formed after seeing two points, tick and five minutes)
⑧ A coarser grid gives a larger break.
⑨ A coarser grid gives more bars touching both barriers, and tick gives 0.
⑩ A synthetic random walk breaks by the same amount.
⑪ At tick resolution the random walk's break equals −s/R.
⑫ The break's apparent dependence on f also comes from the coarse grid, and goes away when it is made fine.
3. The average break barely moves with the resolution
Break = observed win rate − the naive (1−f), taken as the median over four instruments, all bricks and all f.
Calculation 3.1 Changing the resolution
| Resolution | Trades (all cells) | Break | Prediction −s÷R | Remainder |
|---|---|---|---|---|
| tick | 137,124 | −0.0186 | −0.0140 | −0.0047 |
| 1 min | 137,075 | −0.0148 | −0.0154 | +0.0008 |
| 5 min | 137,077 | −0.0129 | −0.0153 | +0.0033 |
| 15 min | 134,148 | −0.0153 | −0.0151 | +0.0009 |
| 1 hour | 125,164 | −0.0151 | −0.0149 | +0.0014 |
Observation 3.2: ★ Prediction ⑧ failed. A coarser grid does not give a larger break. From −0.0186 at tick to −0.0151 on hourly bars, it is smaller if anything.
Observation 3.3: ★★ Maximum ÷ minimum is only 1.4338. That is with the resolution changed from 0.2 seconds to 3,600 — eighteen thousand times.
Observation 3.4: The count barely falls either, from 137,124 to 125,164. ★ So the story "a coarse grid shifts the average" does not hold.
4. But the count of bars touching both barriers is set by the resolution
Calculation 4.1 The cases that were not decided
| Resolution | Decided (all cells) | Both in one bar | Share | Overshoot inside the bar (median pips) |
|---|---|---|---|---|
| tick | 137,124 | 0 | 0.0000 | 0.1600 |
| 1 min | 137,075 | 173 | 0.0013 | 1.5820 |
| 5 min | 137,077 | 337 | 0.0025 | 3.0800 |
| 15 min | 134,148 | 1,079 | 0.0080 | 4.8750 |
| 1 hour | 125,164 | 3,547 | 0.0283 | 9.2890 |
Observation 4.2: Prediction ⑨ held. ★ At tick resolution it is 0, because which came first is determined.
Observation 4.3: ★ On hourly bars it is 3,547 cases, a share of 0.0283. For those, which came first is not determined by the data. This paper took the loss first, but that is a convention, not a fact. That changing the treatment moves the win rate and the expectation was measured in [F025].
Observation 4.4: ★ The overshoot inside a bar rises monotonically from 0.1600 to 9.2890 pips. The spread being measured runs from 0.3000 to 3.4700 pips, so on hourly bars the overshoot is the larger of the two.
Observation 4.5: ★ Two things now hold at once: the average barely moves, while the undetermined count runs from 0 to 3,547. So where did those 3,547 go?
5. The same five resolutions on a synthetic random walk
A synthetic random walk is a martingale by construction, so the theoretical value −s÷R should come out as it stands.
Calculation 5.1 Measurement against random walk (family A, median of the four instruments)
| Resolution | Measured break | Random walk's break | Measured remainder | Random walk's remainder |
|---|---|---|---|---|
| tick | −0.0184 | −0.0211 | −0.0011 | −0.0052 |
| 1 min | −0.0137 | −0.0210 | +0.0027 | −0.0036 |
| 5 min | −0.0129 | −0.0210 | +0.0058 | −0.0035 |
| 15 min | −0.0170 | −0.0206 | +0.0027 | −0.0049 |
| 1 hour | −0.0151 | −0.0208 | +0.0019 | −0.0073 |
Observation 5.2: ★ The random walk's break barely moves with the resolution either, from −0.0211 to −0.0206. It has the same shape as the measurement.
Observation 5.3: Its remainder runs from −0.0073 to −0.0052, shrinking by only 1.4134 times. ★ Viewed as an average, the measurement and the random walk cannot be told apart.
Observation 5.4: ★ What this baseline is zero about was measured in [F033]. A synthetic random walk has no volatility clustering, so agreement here does not mean the measurement has none.
6. Even at tick resolution the theorem is not reached
Calculation 6.1 The random walk's break ÷ the prediction (tick, family A)
| Instrument | Brick | Random walk's break | Prediction −s÷R | Break ÷ prediction | Trades |
|---|---|---|---|---|---|
| USDJPY | 10 | −0.0279 | −0.0168 | 1.6623 | 57,624 |
| USDJPY | 20 | −0.0122 | −0.0092 | 1.3285 | 14,606 |
| EURUSD | 10 | −0.0177 | −0.0095 | 1.8627 | 27,123 |
| EURUSD | 20 | −0.0082 | −0.0051 | 1.6214 | 5,843 |
| GBPUSD | 10 | −0.0379 | −0.0277 | 1.3660 | 56,453 |
| GBPUSD | 20 | −0.0174 | −0.0153 | 1.1356 | 13,781 |
| XAUUSD | 40 | −0.0268 | −0.0263 | 1.0213 | 27,525 |
| XAUUSD | 80 | −0.0088 | −0.0144 | 0.6132 | 6,114 |
Observation 6.2: ★ The median is 1.3473, with a range of 0.6132 to 1.8627. That is closer than the 1.4514 of hourly bars, but it is not 1.
Observation 6.3: ★ So prediction ⑪ was overstated. Not "equals" but "approaches". It is 35 per cent too large.
Observation 6.4: ★ The only part of the remainder that was measured is the overshoot at the fill. Even at tick it has a median of 0.1600 pips. A limit order does not fill at the price you placed it. This paper does not decompose it, however.
Observation 6.5: The discards are worth writing down. Against 137,124 decided, 36,059 did not fill within 24 hours (0.2047) and 2,776 had already passed the limit before the order could rest (0.0158). ★ Removing overlap leaves 106,427, and the break becomes −0.0206 (against −0.0186 for all of them).
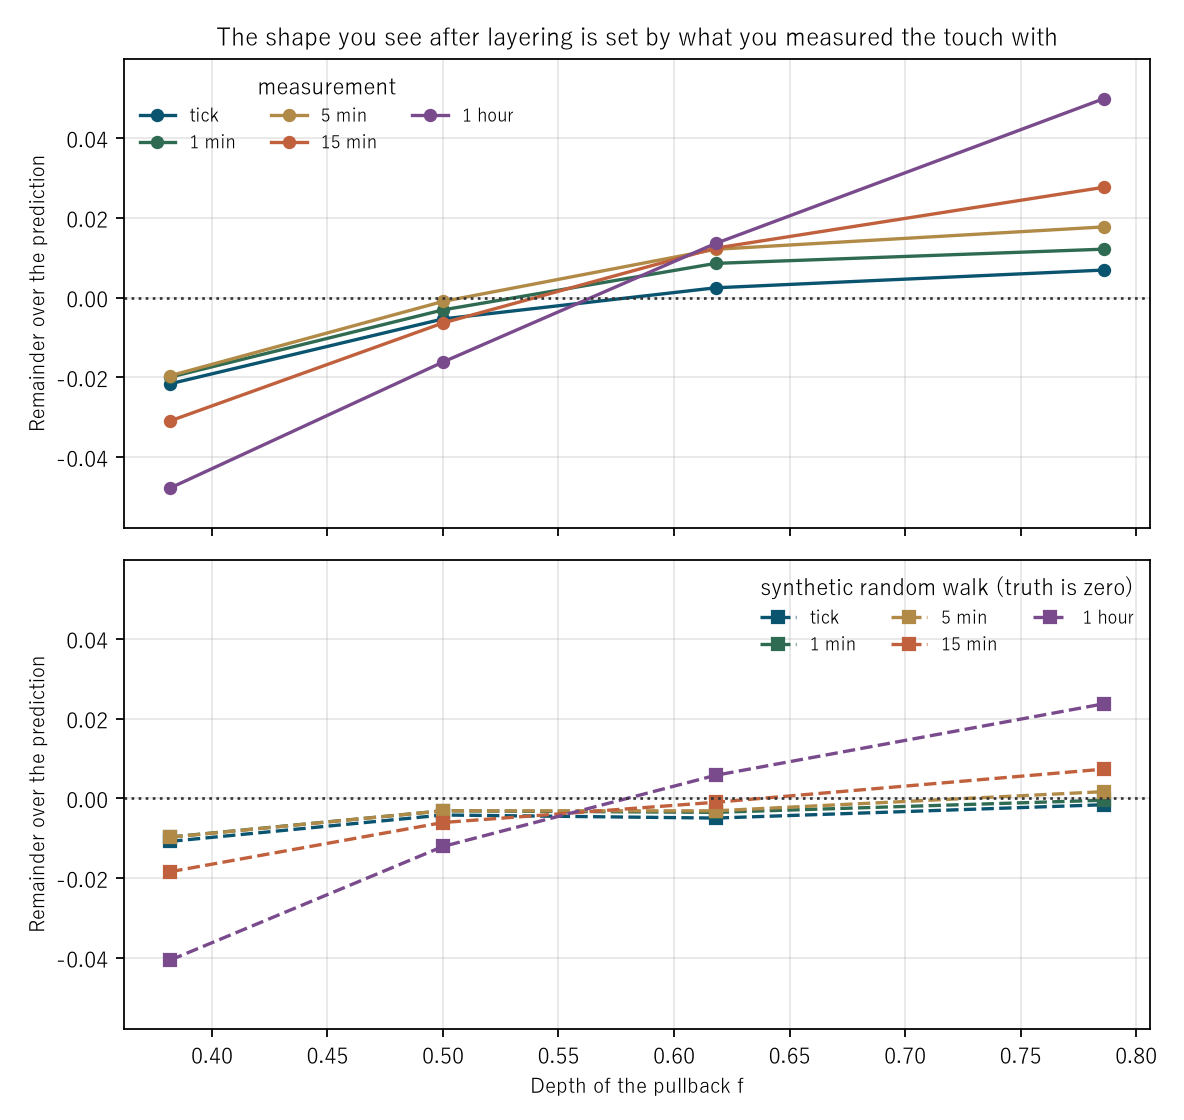
Figure 1: the depth of the pullback f on the horizontal axis and the remainder over the prediction on the vertical. The upper panel is the measurement and the lower the synthetic random walk, on the same vertical scale. Each line is a resolution.
7. Layered by the depth of the pullback, the resolution makes the shape
Calculation 7.1 The remainder by f (measurement)
| Resolution | f=0.382 | f=0.500 | f=0.618 | f=0.786 | Spread |
|---|---|---|---|---|---|
| tick | −0.0216 | −0.0054 | +0.0024 | +0.0069 | 0.0285 |
| 1 min | −0.0200 | −0.0031 | +0.0086 | +0.0121 | 0.0321 |
| 5 min | −0.0196 | −0.0010 | +0.0121 | +0.0177 | 0.0373 |
| 15 min | −0.0309 | −0.0064 | +0.0124 | +0.0276 | 0.0586 |
| 1 hour | −0.0477 | −0.0162 | +0.0136 | +0.0498 | 0.0976 |
Calculation 7.2 The same on a synthetic random walk (true value zero)
| Resolution | f=0.382 | f=0.500 | f=0.618 | f=0.786 | Spread |
|---|---|---|---|---|---|
| tick | −0.0108 | −0.0042 | −0.0050 | −0.0016 | 0.0092 |
| 1 min | −0.0097 | −0.0031 | −0.0035 | −0.0005 | 0.0092 |
| 5 min | −0.0098 | −0.0031 | −0.0031 | +0.0017 | 0.0114 |
| 15 min | −0.0184 | −0.0061 | −0.0010 | +0.0073 | 0.0257 |
| 1 hour | −0.0406 | −0.0121 | +0.0058 | +0.0237 | 0.0642 |
Observation 7.3: ★★ This is the core of the paper. The measured spread opens from 0.0285 to 0.0976, a factor of 3.4240. On the random walk it opens from 0.0092 to 0.0642, a factor of 6.9947.
Observation 7.4: ★★ The random walk's true value is zero, so that spread is made entirely by the measurement. On hourly bars, 0.6584 of the measured spread of 0.0976 also appears on the random walk. At tick it falls to 0.3223.
Observation 7.5: ★ Prediction ⑫ held — it shrinks when made fine. But prediction ② is still failed. Even at tick the spread is 0.0285, larger than the random walk's 0.0092. It cannot be said that the layered shape is entirely an illusion.
Observation 7.6: ★ On hourly bars the figure draws almost the same fan for the measurement and the random walk. I first read that fan as evidence that the depth of the pullback was doing something.
Answering the predictions (all measured at tick resolution)
| Prediction | Result | Numbers |
|---|---|---|
| ① The win rate falls along (1−f) | held | fall: measured 0.3785 / naive 0.4040 |
| ② The break does not contain f | failed | spread 0.0285 (random walk 0.0092) |
| ③ The break is inversely proportional to the leg length | failed | break × R 1.1389 pips / spread 0.9099 pips |
| ④ Instruments order by the spread | failed | XAUUSD at 3.47 breaks 0.0215, less than GBPUSD at 0.90 with 0.0340 |
| ⑤ Spread multiples align the four instruments | failed | max ÷ min: family B 0.0685 / family A −0.0919 |
| ⑥ The expectation is −spread | failed | −2.0967 to −0.3702 (spread 1.7265; −s is −0.9099) |
| ⑦ A synthetic random walk breaks the same | held | ★ and that was the problem |
| ⑧ A coarser grid gives a larger break | failed | tick −0.0186 → 1 hour −0.0151 |
| ⑨ At tick, both-in-one-bar is 0 | held | 0 against 3,547 on hourly bars |
| ⑩ The random walk breaks the same amount | held | on hourly bars: measured +0.0019 / random walk −0.0073 |
| ⑪ At tick the random walk equals −s/R | overstated | break ÷ prediction 1.3473 |
| ⑫ The spread across f shrinks when made fine | held | 0.0976 → 0.0285 |
Observation 7.7: ★ Five of twelve failed. And the way they failed became the content of this paper.
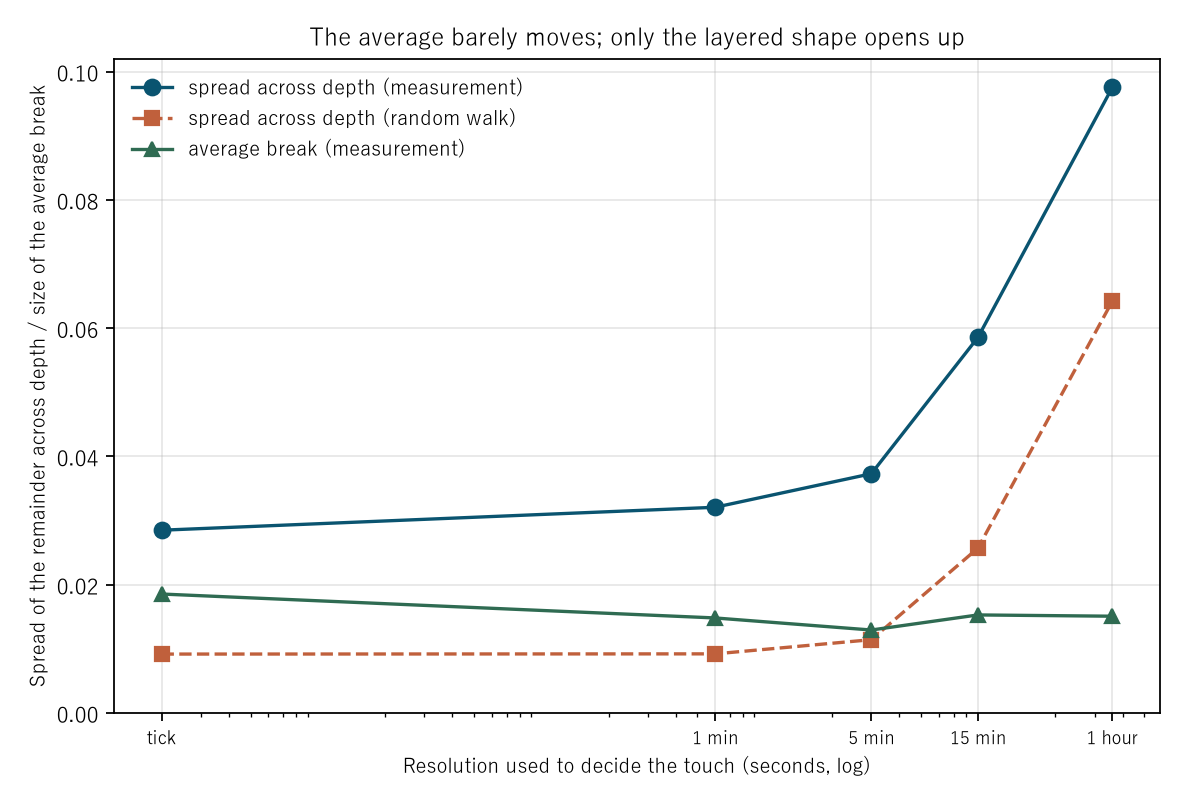
Figure 2: resolution in seconds (logarithmic) on the horizontal axis, with the spread of the remainder across depth (measurement and random walk) beside the average break.
Limitations
- The title was changed twice. Both times after measuring. No prediction was rewritten, but the reader should know that the title was fitted to the result.
- Even at tick resolution the theorem is not reached (break ÷ prediction 1.3473), and the remaining reason is not decomposed.
- One treatment is fixed for a bar that touches both barriers (the loss first).
- The legs are built from 5-minute bars. How the legs themselves are built is not part of the separator.
- Family B is degenerate for USDJPY. Its median spread is 0.5000 pips, so the bricks come out as 10.0 and 20.0 — the same as family A.
- The trades overlap. A version with overlap removed is given (106,427 trades, −0.0206), but the standard errors are optimistic to that extent.
- Four instruments, six years. Nothing is claimed about other markets or other periods.
Conclusion
The same trades were scored at five resolutions. The only thing changed was the data used to decide whether a barrier was touched.
The average break barely moved. From −0.0186 at tick to −0.0151 on hourly bars, a maximum ÷ minimum of 1.4338. That is with the resolution changed eighteen thousand times.
★ But layered by the depth of the pullback, a shape is made. The spread of the remainder opens from 0.0285 at tick to 0.0976 on hourly bars, a factor of 3.4240.
★★ And the same shape appears on a synthetic random walk whose true value is zero. Its spread opens from 0.0092 to 0.0642, a factor of 6.9947. On hourly bars, 0.6584 of the measured spread of 0.0976 also appears there.
The reason can be counted. The count of bars touching both barriers rises from 0 to 3,547, and the overshoot inside a bar from 0.1600 to 9.2890 pips. The spread being measured runs from 0.3000 to 3.4700 pips, so on hourly bars the overshoot is the larger.
★ The average can be measured; the layering cannot. On the average the measurement and the random walk are indistinguishable (remainder −0.0011 against −0.0052), and layered, the same fan appears in both.
★ Five of twelve predictions failed. ②③⑥ broke the first title and ⑧ broke the second. ⑪ overstated "equals": even at tick it is 1.3473.
So what is needed when reporting a win rate broken out by layers is to run the same layering on a synthetic random walk. ★ On hourly bars, a shape of 0.0642 appears where there is nothing at all. I first read that shape as evidence that the depth of the pullback was doing something.
Data and reproduction
| Data | Foreign exchange from Dukascopy-derived ticks (from 2019 onward, matching to the millisecond, bid and ask, has been verified). Gold from Dukascopy |
| Period | 2019–2024 (six years) |
| Instruments | USDJPY, EURUSD, GBPUSD, XAUUSD |
| Legs | Renko from the closes of 5-minute bars (mid, completed bars only). The same legs at every resolution |
| Resolution | tick / 1 min / 5 min / 15 min / 1 hour, on measured bid and ask |
| Brick | Family A fixed pips (10 and 20 for FX, 40 and 80 for gold) / family B 20 and 40 times the median spread |
| Pullback | f = 0.382, 0.5, 0.618, 0.786, all four on one common set of legs |
| Fill | Buy when ask ≤ lim, sell when bid ≥ lim. The fill price is lim, never rounded in your favour |
| Barriers | Win = reach the extreme first / loss = reach the origin first, judged on the side you can close at |
| Convention | A bar touching both counts as the loss. Barriers are measured from the bar after the fill |
| Waiting | Up to 24 hours to fill, up to 30 days for a barrier. Each year is closed off |
| Baseline | Synthetic random walk down to the tick (3 draws, family A only, the same five resolutions) |
| Verification | 検算/F046.py (--zu also writes the figures). Every number in the text comes from 検算/F046_output.txt |
| Figures | 図/F046_zu1, 図/F046_zu2 (png, svg, English versions) |
| Random seeds | Fixed. Re-running gives the same values |
| Substrate check | _ツール/audit_bars.py (bar look-ahead, daylight saving, day boundary). The record is _土台の検査.txt |
References
- Yamagishi, Y. (2026). Placing the Take Profit and Stop Loss Forty-Nine Ways Does Not Move the Expectation [F012]. Zenodo. 10.5281/zenodo.22891608
- Yamagishi, Y. (2026). How You Treat a Bar That Touches Both Barriers Is What Makes the Win Rate and the Expected Value [F025]. Zenodo. 10.5281/zenodo.22892549
- Yamagishi, Y. (2026). A Synthetic Random Walk Has No Volatility Clustering [F033]. Zenodo. 10.5281/zenodo.22893674
- Yamagishi, Y. (2026). A Renko Turning Point Is Not a Turning Point Until the Brick Completes [F040]. Zenodo. 10.5281/zenodo.22894529
Reference
Yamagishi, Y. (2026). A Win Rate Layered by the Depth of the Pullback Belongs to What You Measured the Touch With [F046]. Zenodo.
DOI: 10.5281/zenodo.22895278
YOI: https://www.yamagishiyuuki.com/yoi/F046
ORCID: 0009-0006-8587-3450
PDF (English) · PDF (Japanese) · Date proof of the English PDF (OpenTimestamps .ots) · SHA256SUMS
The record page for this paper (in Japanese, with the PDFs in each language and the date proof): YOI F046. This paper is a preprint and has not been peer reviewed.