Abstract
Matching the number of registered vehicles (as of the end of June 2026) with the number of motor vehicle repair establishments (2021 Economic Census) by prefecture, I computed the number of registered vehicles per repair establishment.
Across the 46 prefectures covered, the figure is 1,728.2. The highest is Shiga at 3,144.2 and the lowest is Aomori at 1,085.7 — a 2.9-fold difference.
Where there are more vehicles per resident, there are fewer vehicles per shop (r = −0.290). In car-dependent areas, the number of repair shops rises more than the number of vehicles does.
Hokkaido is 1,614.8, ranking 27th of 46 — near the middle.
Okinawa is not covered by this vehicle statistic.
1. Introduction
Earlier reports (R001, R002) explained the types of industry present in a municipality by population.
But demand for a trade is not determined by population as such; it is determined by the quantity of whatever that trade serves. For motor vehicle repair, that is the number of vehicles.
How many vehicles are there per repair shop?
Population does not show this.
2. Data
| Vehicles | Automobile Inspection & Registration Information Association, Registered vehicles by prefecture and vehicle type, end of June 2026. Passenger, freight, bus, special-purpose and two-wheeled vehicles combined |
| Establishments | Statistics Bureau of Japan and METI, 2021 Economic Census, industrial subcategory 891, motor vehicle repair (48,349 establishments nationwide) |
| Population | MIC, Basic Resident Register population, 1 January 2026 |
Okinawa is missing. The vehicle statistic is compiled through the district transport bureaus of MLIT, whereas Okinawa falls under the Cabinet Office's Okinawa General Bureau and is not included. The remaining 46 prefectures are analysed.
In the source table Hokkaido is divided among seven transport branch offices (Sapporo, Hakodate, Asahikawa, Muroran, Kushiro, Obihiro, Kitami); the total is used here.
3. Results
3-1 1,728 vehicles per shop, with a 2.9-fold spread
| Highest | Vehicles | Establishments | Per shop |
|---|---|---|---|
| Shiga | 1,078,467 | 343 | 3,144.2 |
| Yamaguchi | 1,065,045 | 405 | 2,629.7 |
| Shimane | 553,433 | 230 | 2,406.2 |
| Hiroshima | 1,928,837 | 836 | 2,307.2 |
| Shizuoka | 2,925,226 | 1,339 | 2,184.6 |
| Lowest | Vehicles | Establishments | Per shop |
|---|---|---|---|
| Wakayama | 758,571 | 609 | 1,245.6 |
| Kochi | 558,957 | 465 | 1,202.1 |
| Yamanashi | 780,760 | 688 | 1,134.8 |
| Aomori | 996,710 | 918 | 1,085.7 |
The combined figure for the 46 prefectures is 1,728.2 vehicles per establishment, with a 2.9-fold gap between top and bottom.
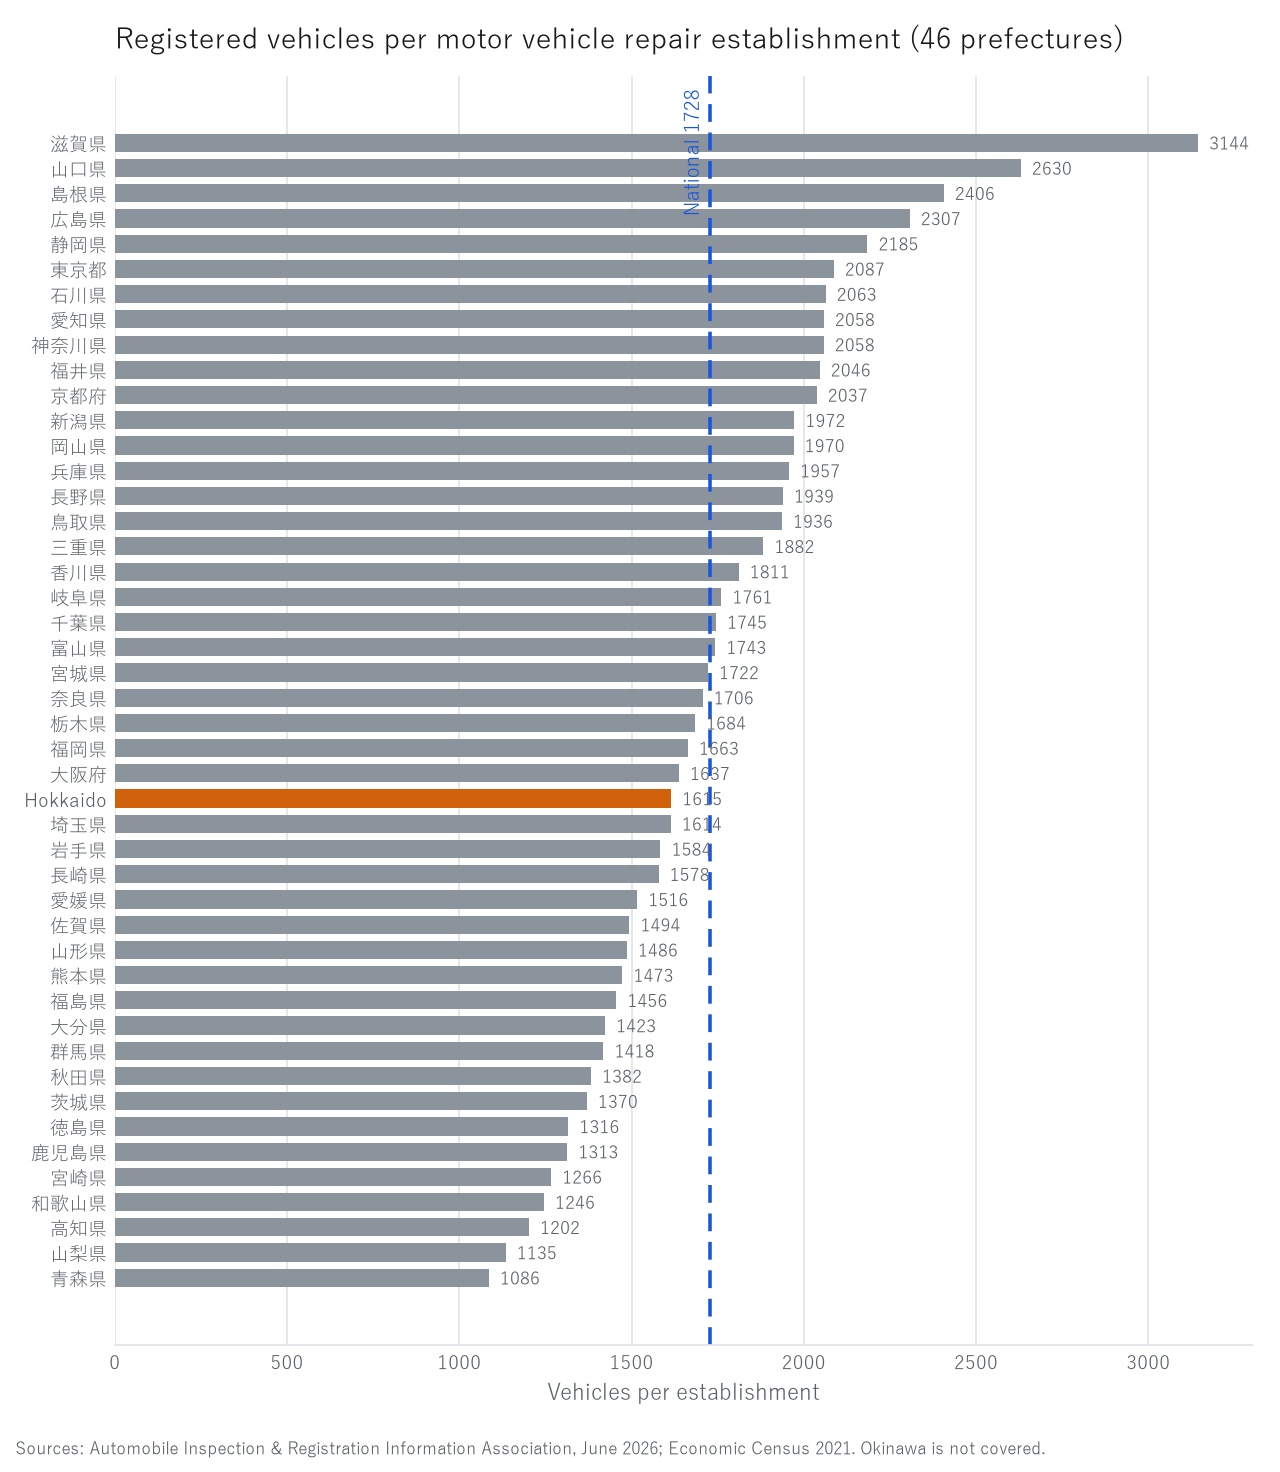
Figure 1. Registered vehicles per motor vehicle repair establishment (46 prefectures).
Orange is Hokkaido; the blue dashed line is the 46-prefecture total (1,728).
3-2 More cars, fewer per shop
The correlation between vehicles per 10,000 residents (how car-dependent a prefecture is) and vehicles per shop is r = −0.290. The sign is negative.
Vehicles per 10,000 residents are highest in Yamanashi (9,825), Ibaraki (9,432) and Miyazaki (9,242), and conspicuously lowest in Tokyo (3,174).
Yet vehicles per shop place Yamanashi (1,134.8), Ibaraki (1,369.9) and Miyazaki (1,266.4) near the bottom, while Tokyo (2,086.8) sits near the top.
Where cars are plentiful, repair shops have increased more than vehicles have.
The correlation with population size is r = +0.215, also weak.
3-3 Hokkaido
Hokkaido has 1,614.8 vehicles per shop, ranking 27th of 46. At 7,659 vehicles per 10,000 residents it is car-dependent, yet its per-shop figure is mid-range.
For reference, registered vehicles by transport branch office within Hokkaido are Sapporo 1,784,953; Asahikawa 495,951; Muroran 383,269; Obihiro 328,368; Hakodate 311,141; Kushiro 269,658; Kitami 253,717.
Per-shop figures by branch office are not computed here. The municipalities under each branch office could not be confirmed. The Kushiro branch office appears to cover more than the eight municipalities of the Kushiro Subprefecture, so dividing its vehicle count by the subprefecture's 160 establishments would give a wrong figure.
4. Discussion
4-1 Demand gives a different ordering from population
R001 and R002 ordered places by population; this paper orders them by vehicles. The orderings do not agree.
Tokyo has the fewest vehicles per resident yet ranks sixth from the top in vehicles per shop.
Each trade serves a different quantity. Dividing by that quantity reveals differences that population hides.
4-2 Why the sign is negative (hypotheses)
Several explanations are possible for more vehicles per resident going with fewer vehicles per shop.
- Where cars are essential to daily life, servicing is more frequent, and the number of shops rises accordingly
- In urban areas, establishments are larger (dealer networks)
- Where population density is low, shops disperse because of how far customers can travel
None of these is tested here. Including establishment size (employees) might separate them.
4-3 What can and cannot be said
Vehicles per shop is an indicator of demand, not of workload or revenue.
Vehicle age, inspection cycles, the content of servicing, and the distinction between dealers and independent shops are not examined.
5. Limitations
- Vehicles are as of end-June 2026, establishments as of 1 June 2021, population as of 1 January 2026: the dates differ
- Okinawa is not covered by this statistic
- The vehicle count includes two-wheeled and special-purpose vehicles
- Subcategory 891 does not distinguish designated from certified workshops, or by size
- The prefecture is a coarse unit; municipal vehicle counts would allow a finer view
- Correlation describes association, not the direction of causation
6. Reproduction
- Download Registered vehicles by prefecture and vehicle type from the Automobile Inspection & Registration Information Association
- Download establishments by industrial subcategory and municipality (2021 Economic Census) from e-Stat and sum subcategory 891 by prefecture
- Sum Basic Resident Register population by prefecture
- Compute vehicles ÷ establishments, and vehicles ÷ population × 10,000
All values are the output of a single script (kensan_188). No intermediate value was transcribed by hand.
References and data sources
- Automobile Inspection & Registration Information Association, Registered vehicles by prefecture and vehicle type, end of June 2026.
- Statistics Bureau of Japan and METI, 2021 Economic Census for Business Activity.
- MIC, Population Based on the Basic Resident Register, 1 January 2026.
- Y. Yamagishi, "Population and the Number of Industrial Subcategories Present in Japanese Municipalities" (R001). Zenodo. https://doi.org/10.5281/zenodo.22872218
- Y. Yamagishi, "At What Population Does a Trade Appear?" (R002). Zenodo. https://doi.org/10.5281/zenodo.22872356
Version history
| Version | Date | Change |
|---|---|---|
| 1 | 2026-09-21 | First release |
How to cite
Yamagishi, Y. (2026). How Many Vehicles per Repair Shop? Where There Are More Cars, There Are Fewer per Shop [I001]. Zenodo. https://doi.org/10.5281/zenodo.22875470
(This DOI is the concept DOI; it always resolves to the latest version. Cite this one.)
© 2026 Yuuki YAMAGISHI
This work is licensed under a Creative Commons Attribution 4.0 International License (CC BY 4.0).
You may copy, adapt, redistribute and use it commercially, provided you give appropriate credit.
creativecommons.org/licenses/by/4.0
All figures and values in this paper were computed from official statistics. Rights in the underlying data remain with the publishing agencies.
Reference
Yamagishi, Y. (2026). How Many Vehicles per Repair Shop? Where There Are More Cars, There Are Fewer per Shop [I001]. Zenodo.
DOI: 10.5281/zenodo.22875470
YOI: https://www.yamagishiyuuki.com/yoi/I001
ORCID: 0009-0006-8587-3450
PDF (English) · PDF (Japanese) · Date proof of the English PDF (OpenTimestamps .ots) · SHA256SUMS
The record page for this paper (in Japanese, with the PDFs in each language and the date proof): YOI I001. This paper is a preprint and has not been peer reviewed.