Abstract
Matching the number of people certified as requiring long-term care or support (FY2024, by insurer) with the number of establishments in welfare and care for the elderly (2021 Economic Census), I computed the number of certified recipients per establishment.
Nationally the figure is 63.5 per establishment, and the median across municipalities is 64.3. It is almost unrelated to the size of the municipality or to how aged its population is (r = −0.077 with log population; r = +0.048 with the share aged 65 and over).
The difference lies between prefectures: from 91.4 in Kyoto to 37.4 in Miyazaki, a 2.4-fold spread. The certification rate (recipients ÷ population aged 65+) likewise ranges from 24.7% in Osaka to 16.6% in Miyazaki.
Within the Kushiro Subprefecture, Shiranuka is the heaviest at 131.8 (659 recipients across 5 establishments) and Teshikaga the lightest at 44.8. Kushiro City, at 62.5, is almost exactly the national figure.
1. Introduction
I001 showed, for motor vehicle repair, that dividing by demand (registered vehicles) produces an ordering different from population.
This paper does the same for long-term care, where demand is not population but the number of people certified as requiring care or support.
How many certified recipients are there per care establishment?
2. Data
| Certified recipients | MHLW, Report on the Status of Long-term Care Insurance (annual), FY2024, by insurer, certified as requiring care or support (end of fiscal year, both sexes, total). National total 7,207,487 |
| Establishments | Statistics Bureau of Japan and METI, 2021 Economic Census, subcategory 854, welfare and care for the elderly |
| Population and age 65+ | MIC, Basic Resident Register population, 1 January 2026 |
Unit
The insurer under long-term care insurance is the city, not the ward. Designated cities are therefore treated as single cities (unit B of R001, 1,741 municipalities).
Of 1,573 insurers, 1,530 (6,884,124 recipients, 95.5% of the total) matched a municipality. The remaining 43 are wide-area unions covering several municipalities and cannot be assigned to one (for example, the Fukuoka Prefecture Long-term Care Insurance Wide-Area Union, 40,745; the Higashi-Mikawa Wide-Area Union, 34,025). All are included in the prefecture totals.
3. Results
3-1 63.5 per establishment, unrelated to municipality size
Nationally 63.5 per establishment; the median across the 1,508 municipalities with at least one establishment is 64.3.
| Correlation | |
|---|---|
| log₁₀(population) × recipients per establishment | −0.077 |
| Share aged 65+ × recipients per establishment | +0.048 |
Neither matters. In large municipalities and small, in aged ones and less aged, each establishment carries some sixty-odd certified recipients.
When demand rises, establishments increase; when it falls, they decrease. Supply tracks demand.
3-2 The difference lies between prefectures
| Highest | Recipients | Establishments | Per establishment | Certification rate |
|---|---|---|---|---|
| Kyoto | 176,020 | 1,925 | 91.4 | 24.1% |
| Saitama | 363,272 | 4,727 | 76.9 | 18.2% |
| Ibaraki | 145,180 | 1,909 | 76.1 | 16.8% |
| Tokyo | 678,800 | 8,989 | 75.5 | 21.5% |
| Hyogo | 347,780 | 4,631 | 75.1 | 22.0% |
| Lowest | Recipients | Establishments | Per establishment | Certification rate |
|---|---|---|---|---|
| Kochi | 47,063 | 959 | 49.1 | 19.7% |
| Saga | 46,175 | 979 | 47.2 | 18.4% |
| Okinawa | 65,306 | 1,437 | 45.4 | 18.2% |
| Aomori | 77,451 | 1,844 | 42.0 | 18.5% |
| Miyazaki | 58,270 | 1,558 | 37.4 | 16.6% |
Kyoto and Miyazaki differ by a factor of 2.4.
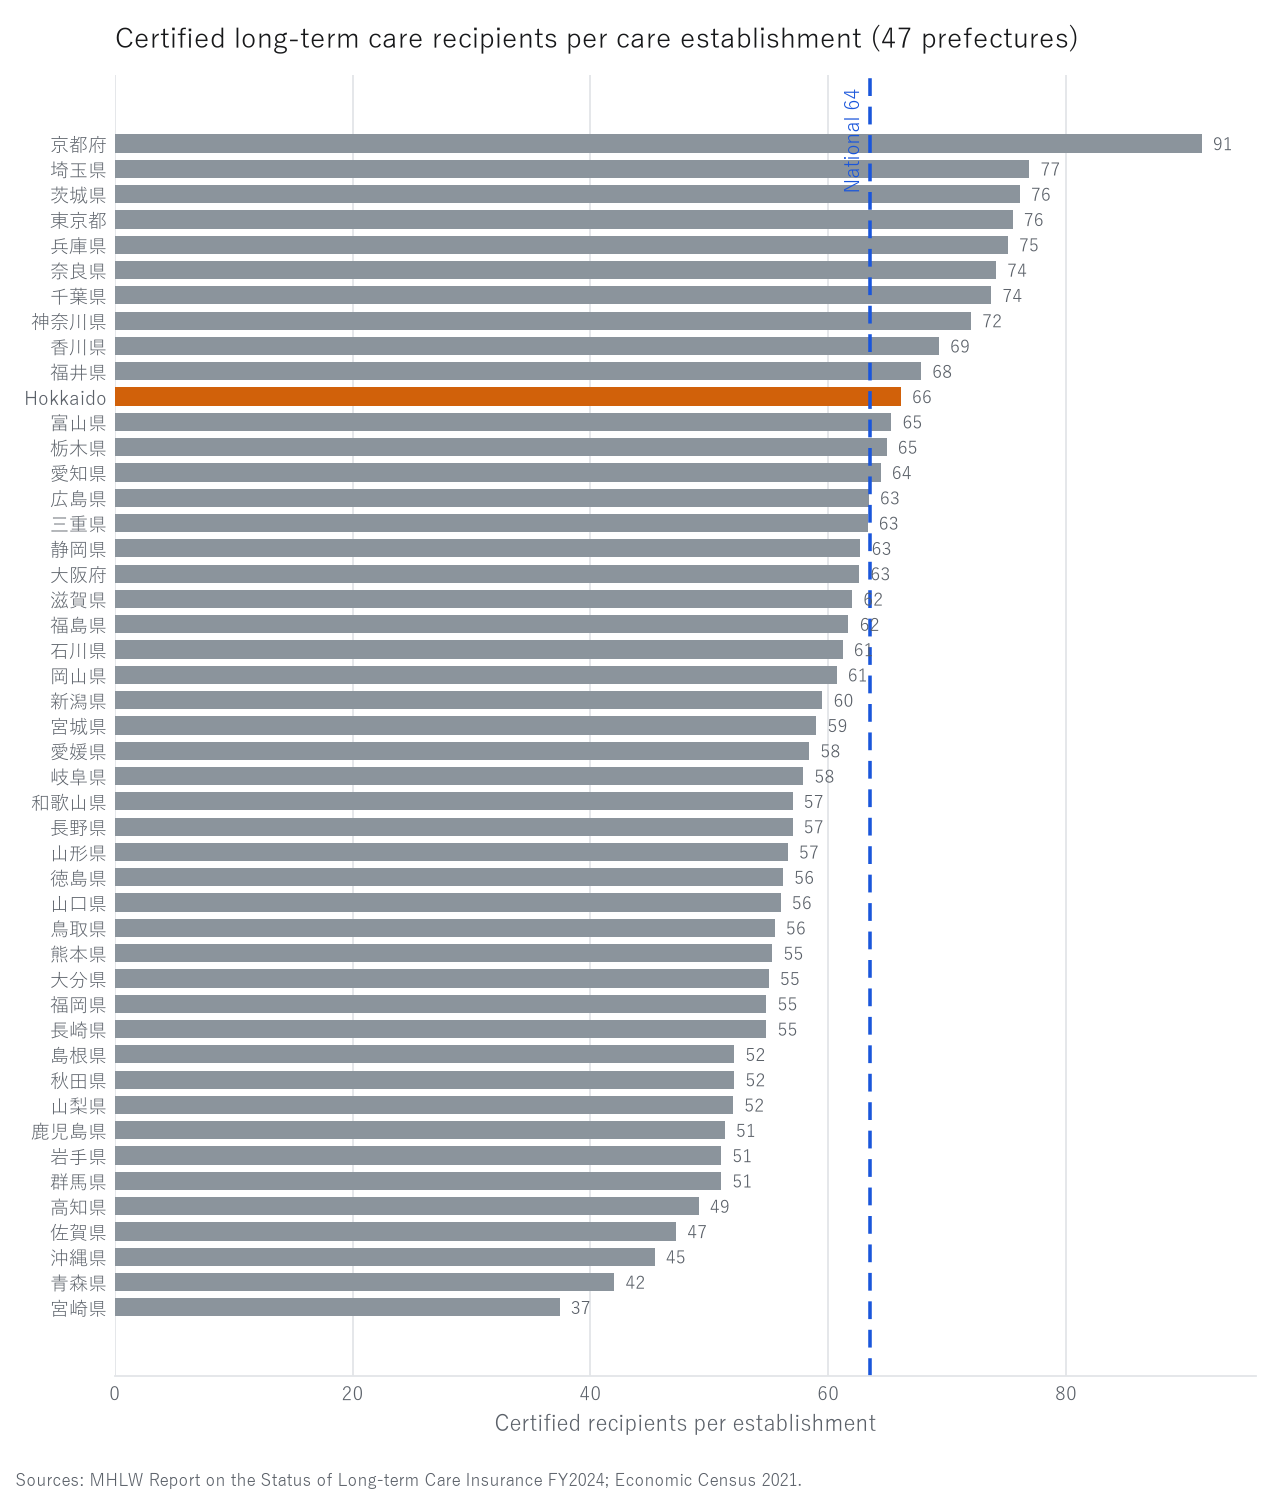
Figure 1. Certified long-term care recipients per establishment (47 prefectures).
Orange is Hokkaido; the blue dashed line is the national figure (63.5).
3-3 Certification rates also differ by prefecture
The certification rate (recipients ÷ population aged 65+) is highest in Osaka (24.7%), Kyoto (24.1%), Wakayama (22.2%) and Hyogo (22.0%), and lowest in Tochigi (16.9%), Ibaraki (16.8%), Yamanashi (16.7%) and Miyazaki (16.6%).
Its correlation with recipients per establishment is r = +0.352: prefectures with higher certification rates tend to have more recipients per establishment, but that alone does not account for the spread.
3-4 The Kushiro Subprefecture
| Municipality | Population | Aged 65+ | Recipients | Establishments | Per establishment | Rate |
|---|---|---|---|---|---|---|
| Kushiro City | 151,566 | 55,077 | 12,878 | 206 | 62.5 | 23.4% |
| Kushiro Town | 18,021 | 5,998 | 1,293 | 18 | 71.8 | 21.6% |
| Akkeshi | 7,976 | 3,094 | 698 | 8 | 87.2 | 22.6% |
| Hamanaka | 5,172 | 1,789 | 244 | 2 | 122.0 | 13.6% |
| Shibecha | 6,698 | 2,504 | 532 | 10 | 53.2 | 21.2% |
| Teshikaga | 6,327 | 2,645 | 583 | 13 | 44.8 | 22.0% |
| Tsurui | 2,368 | 823 | 113 | 2 | 56.5 | 13.7% |
| Shiranuka | 6,840 | 2,986 | 659 | 5 | 131.8 | 22.1% |
Shiranuka is the heaviest in the subprefecture: 659 recipients across 5 establishments, 131.8 each — 2.1 times the national figure.
Teshikaga has 583 recipients across 13 establishments, 44.8 each. Their populations are almost identical (6,840 and 6,327), yet the figure differs roughly threefold.
Kushiro City, at 62.5, is almost exactly the national figure.
Hamanaka (13.6%) and Tsurui (13.7%) have certification rates far below the others in the subprefecture (21–23%). This paper cannot say why.
4. Discussion
4-1 Supply tracks demand
As 3-1 shows, recipients per establishment depend neither on municipality size nor on ageing.
This differs in meaning from R003, where the count of single-establishment subcategories was flat.
In long-term care, the number of establishments is set almost in proportion to the quantity of demand.
One may say that the insurance system makes demand visible and designated providers respond to it. This paper does not test that.
4-2 Yet prefectures differ by a factor of 2.4
Although neither population nor ageing explains it, prefectures differ 2.4-fold.
In R004, prefecture was likewise the largest source of variation in the residual of industrial breadth. The results point the same way.
Possible causes are differences in establishment size (capacity), in the mix of establishment types between urban and rural areas, and in how municipalities administer designation — none examined here.
4-3 The same population, three times the load
Shiranuka and Teshikaga have almost the same population and differ roughly threefold.
Population alone cannot show this. It appears only when demand (recipients) and supply (establishments) are placed side by side.
5. Limitations
- Recipients are as of the end of FY2024, establishments as of 1 June 2021, population as of 1 January 2026: the dates differ
- Where the insurer is a wide-area union, it cannot be assigned to a municipality (43 insurers, 323,363 recipients); those drop out of the municipal table
- Subcategory 854 does not distinguish residential, day-service and home-visit providers, or capacity. The per-establishment figure ignores establishment size
- Certified recipients are those certified, not those actually using services
- The location of an establishment need not match users' addresses; users may rely on establishments in neighbouring municipalities
- Recipients per establishment is an indicator of demand, not of workload or revenue
6. Reproduction
- From e-Stat, obtain Report on the Status of Long-term Care Insurance (annual), FY2024, certified recipients by insurer (both sexes, total). Sheet "その1" is the total; the later sheets are age breakdowns, and summing them double-counts
- From e-Stat, obtain establishments by industrial subcategory and municipality (2021 Economic Census) and take subcategory 854
- Obtain Basic Resident Register population and population aged 65+
- Treating designated cities as single cities (unit B), match on prefecture and insurer name
- Compute recipients ÷ establishments and recipients ÷ population aged 65+
All values are the output of a single script (kensan_189). No intermediate value was transcribed by hand.
References and data sources
- MHLW, Report on the Status of Long-term Care Insurance (annual), FY2024.
- Statistics Bureau of Japan and METI, 2021 Economic Census for Business Activity.
- MIC, Population Based on the Basic Resident Register, 1 January 2026.
- Y. Yamagishi, "Population and the Number of Industrial Subcategories Present in Japanese Municipalities" (R001). Zenodo. https://doi.org/10.5281/zenodo.22872218
- Y. Yamagishi, "The Only One in Town" (R003). Zenodo. https://doi.org/10.5281/zenodo.22872474
- Y. Yamagishi, "What Population Leaves Unexplained Is Not Explained by Income or Land Prices" (R004). Zenodo. https://doi.org/10.5281/zenodo.22872530
- Y. Yamagishi, "How Many Vehicles per Repair Shop?" (I001). Zenodo. https://doi.org/10.5281/zenodo.22875470
Version history
| Version | Date | Change |
|---|---|---|
| 1 | 2026-09-21 | First release |
How to cite
Yamagishi, Y. (2026). Certified Care Recipients per Establishment Are in the Sixties Everywhere, Regardless of Municipality Size — the Difference Lies in the Prefecture [I002]. Zenodo. https://doi.org/10.5281/zenodo.22875542
(This DOI is the concept DOI; it always resolves to the latest version. Cite this one.)
© 2026 Yuuki YAMAGISHI
This work is licensed under a Creative Commons Attribution 4.0 International License (CC BY 4.0).
You may copy, adapt, redistribute and use it commercially, provided you give appropriate credit.
creativecommons.org/licenses/by/4.0
All figures and values in this paper were computed from official statistics. Rights in the underlying data remain with the publishing agencies.
Reference
Yamagishi, Y. (2026). Certified Care Recipients per Establishment Are in the Sixties Everywhere, Regardless of Municipality Size [I002]. Zenodo.
DOI: 10.5281/zenodo.22875542
YOI: https://www.yamagishiyuuki.com/yoi/I002
ORCID: 0009-0006-8587-3450
PDF (English) · PDF (Japanese) · Date proof of the English PDF (OpenTimestamps .ots) · SHA256SUMS
The record page for this paper (in Japanese, with the PDFs in each language and the date proof): YOI I002. This paper is a preprint and has not been peer reviewed.