Abstract
I counted clinics in two official statistics — the Survey of Medical Institutions (1 October 2023, MHLW) and the Economic Census (1 June 2021, industrial subcategories 832 and 833) — and matched them across 1,889 municipalities.
Dental clinics agree. 66,442 against 64,276 (+3.4%). The median municipal ratio is 1.000, and the counts match exactly in 43.7% of municipalities.
General clinics do not. 104,244 against 82,182 (+26.8%). The median ratio is 1.326 and exact matches occur in only 5.4% of municipalities. The discrepancy runs in one direction: the Survey of Medical Institutions reports more. There are 60 municipalities with zero in the Economic Census but at least one clinic in the Survey, and none the other way round.
94.6% of general clinics have no beds. The median number of general clinics per 10,000 residents is 7.62. Only three municipalities in Japan have no general clinic at all (Okoppe 3,422; Yamae 3,092; Kitagawa 1,161).
Two statistics bearing the same name may count different things. This paper does not judge which is correct.
1. Introduction
I001 and I002 divided supply (establishments) by demand (vehicles, certified recipients).
Something should be checked first: does the count of supply itself differ between statistics?
When the same "clinics" are counted in two official statistics, do the numbers agree?
Clinics are one of the few objects that appear in both the Survey of Medical Institutions and the Economic Census.
2. Data
| Survey of Medical Institutions | MHLW, Survey of Medical Institutions (static and dynamic) 2023, secondary medical area and municipality edition, Table 2. General and dental clinics (as of 1 October 2023) |
| Economic Census | Statistics Bureau of Japan and METI, 2021 Economic Census, subcategories 832 general clinics and 833 dental clinics (as of 1 June 2021) |
| Population | MIC, Basic Resident Register population, 1 January 2026 |
The Survey of Medical Institutions splits designated cities into wards, so the unit is unit A of R001 (1,889 municipalities). The 1,889 municipalities with both statistics and population were analysed.
The reference dates differ by two years and four months. Section 4 addresses this.
3. Results
3-1 Dental clinics agree; general clinics do not
| Survey (2023) | Census (2021) | Difference | |
|---|---|---|---|
| General clinics | 104,244 | 82,182 | +26.8% |
| Dental clinics | 66,442 | 64,276 | +3.4% |
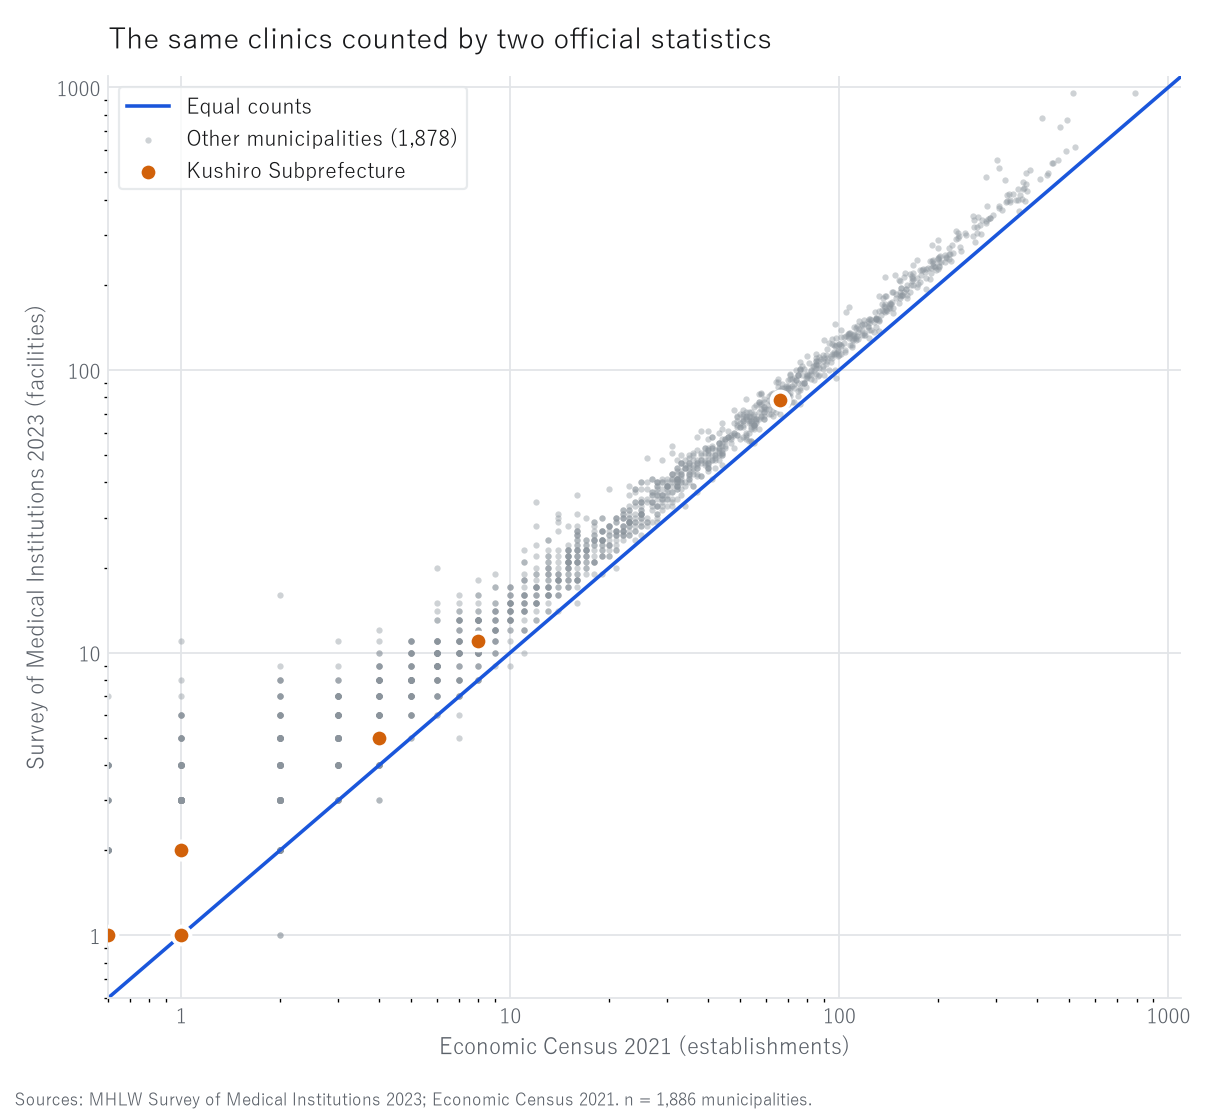
Figure 1. The same "general clinics" counted by two official statistics (1,889 municipalities).
The blue line marks equal counts. Grey points are the other municipalities; orange is the Kushiro Subprefecture. Both axes are logarithmic; municipalities with zero in the Census are placed at the left edge.
3-2 By municipality, the discrepancy runs one way
| General clinics | Dental clinics | |
|---|---|---|
| Municipalities with at least one in both | 1,826 | 1,807 |
| Exact match | 98 (5.4%) | 789 (43.7%) |
| Median ratio (Survey ÷ Census) | 1.326 | 1.000 |
| Median absolute difference | 5.0 | 1.0 |
| Differing by 10 or more | 582 | 74 |
| Census zero, Survey non-zero | 60 | 14 |
| Survey zero, Census non-zero | 0 | 12 |
For general clinics the discrepancy is cleanly one-directional: the Survey reports more, and the reverse almost never occurs.
For dental clinics it runs both ways in similar numbers (14 and 12).
3-3 94.6% of general clinics have no beds
Of the 104,244 general clinics nationwide, 98,636 (94.6%) have no beds.
The median number of general clinics per 10,000 residents is 7.62. The highest are Mishima 112.4, Toshima 107.5, Hayakawa 87.7 and Chiyoda 80.3 — very small villages and a central ward with a large daytime population.
Only three municipalities have no general clinic at all: Okoppe (3,422), Yamae (3,092) and Kitagawa (1,161).
This is consistent with R002, where general clinics had the lowest possible threshold population (155). Clinics reach even the smallest towns.
3-4 The Kushiro Subprefecture
| Municipality | Population | General (Survey) | General (Census) | Dental (Survey) | Dental (Census) | General per 10,000 |
|---|---|---|---|---|---|---|
| Kushiro City | 151,566 | 78 | 66 | 82 | 81 | 5.15 |
| Kushiro Town | 18,021 | 11 | 8 | 8 | 9 | 6.10 |
| Akkeshi | 7,976 | 2 | 1 | 5 | 5 | 2.51 |
| Hamanaka | 5,172 | 2 | 1 | 2 | 1 | 3.87 |
| Shibecha | 6,698 | 1 | 0 | 2 | 2 | 1.49 |
| Teshikaga | 6,327 | 5 | 4 | 3 | 3 | 7.90 |
| Tsurui | 2,368 | 1 | 1 | 1 | 1 | 4.22 |
| Shiranuka | 6,840 | 5 | 4 | 4 | 4 | 7.31 |
The pattern holds locally: dental clinics agree, general clinics are higher in the Survey.
Shibecha has zero in the Census and one in the Survey. Some of the municipalities counted as "lacking" a subcategory in R001, R002 and R003 do have one according to another statistic.
Per 10,000 residents, Kushiro City (5.15) is on the low side within the subprefecture, while Teshikaga (7.90) and Shiranuka (7.31) are high. Against the national median of 7.62, Kushiro City is on the low side.
4. Discussion
4-1 The date gap does not account for it
The two statistics differ by two years and four months. Yet dental clinics moved only +3.4% over the same period.
It is implausible that general clinics alone grew 26.8% in that time. Most of the gap is better read as a difference in what is being counted.
4-2 "Facility" and "establishment" are not the same (hypothesis)
The Survey counts facilities; the Economic Census counts establishments.
General clinics include those attached to hospitals and those inside companies, schools and welfare facilities.
In the Economic Census such clinics are classified by the principal activity of the establishment they belong to, and so may not appear under 832.
Dental clinics are almost always independent practices, which would explain why the two agree.
This is a hypothesis and is not tested here.
4-3 When writing "absent", name the statistic
R001, R002 and R003 counted presence and absence using the Economic Census alone.
This paper shows that such absences depend on the choice of statistic: in 60 municipalities recorded as zero by the Census, the Survey records at least one general clinic.
This does not overturn those reports. But whenever "absent" is written, the statistic and the date must be stated with it.
5. Limitations
- The Survey is as of 1 October 2023, the Census as of 1 June 2021, population as of 1 January 2026: the dates differ
- The Survey counts facilities and the Census counts establishments; they need not be the same object under the same definition
- The Economic Census applies suppression rules, so counts may differ from reality where numbers are small
- Speciality, size and type of founder are not examined
- This paper does not judge which statistic is correct
6. Reproduction
- From e-Stat, obtain the Survey of Medical Institutions 2023, secondary medical area and municipality edition, Table 2 (CSV)
- From e-Stat, obtain establishments by industrial subcategory and municipality (2021 Economic Census) and take 832 and 833
- Match on the five-digit municipality code; the Survey table also contains prefecture and secondary-medical-area rows, so use only rows with a five-digit code
- Compute national totals and municipal ratios and differences
All values are the output of a single script (kensan_190). No intermediate value was transcribed by hand.
References and data sources
- MHLW, Survey of Medical Institutions (static and dynamic) 2023, secondary medical area and municipality edition.
- Statistics Bureau of Japan and METI, 2021 Economic Census for Business Activity.
- MIC, Population Based on the Basic Resident Register, 1 January 2026.
- Y. Yamagishi, "Population and the Number of Industrial Subcategories Present in Japanese Municipalities" (R001). Zenodo. https://doi.org/10.5281/zenodo.22872218
- Y. Yamagishi, "At What Population Does a Trade Appear?" (R002). Zenodo. https://doi.org/10.5281/zenodo.22872356
Version history
| Version | Date | Change |
|---|---|---|
| 1 | 2026-09-21 | First release |
How to cite
Yamagishi, Y. (2026). The Same Clinics Counted by Two Official Statistics: Dental Clinics Agree, General Clinics Differ by 26.8% [I003]. Zenodo. https://doi.org/10.5281/zenodo.22875614
(This DOI is the concept DOI; it always resolves to the latest version. Cite this one.)
© 2026 Yuuki YAMAGISHI
This work is licensed under a Creative Commons Attribution 4.0 International License (CC BY 4.0).
You may copy, adapt, redistribute and use it commercially, provided you give appropriate credit.
creativecommons.org/licenses/by/4.0
All figures and values in this paper were computed from official statistics. Rights in the underlying data remain with the publishing agencies.
Reference
Yamagishi, Y. (2026). The Same Clinics Counted by Two Official Statistics: Dental Clinics Agree, General Clinics Differ by 26.8% [I003]. Zenodo.
DOI: 10.5281/zenodo.22875614
YOI: https://www.yamagishiyuuki.com/yoi/I003
ORCID: 0009-0006-8587-3450
PDF (English) · PDF (Japanese) · Date proof of the English PDF (OpenTimestamps .ots) · SHA256SUMS
The record page for this paper (in Japanese, with the PDFs in each language and the date proof): YOI I003. This paper is a preprint and has not been peer reviewed.