Abstract
I counted barbershops and beauty salons in the Report on Public Health Administration (end of FY2024, MHLW) and the Economic Census (2021, subcategories 782 and 783), and compared them by prefecture.
The counts disagree. Barbershops: 107,995 against 86,476 (+24.9%). Beauty salons: 277,752 against 161,280 (+72.2%).
The former counts licensed premises, the latter establishments.
Each shop has about two workers. Barbershops average 1.80 workers per premises and beauty salons 2.12. Almost all are run by one or two people.
The more aged the prefecture, the more barbershops relative to beauty salons. The ratio of beauty salons to barbershops runs from 3.90 in Tokyo to 1.39 in Akita, correlating with the share aged 65 and over at r = −0.668.
Per head of population, however, both increase with ageing (barbershops r = +0.792, beauty salons r = +0.723).
Hokkaido's ratio is 1.97, 39th of 47 prefectures, with 11.38 barbershops and 22.41 beauty salons per 10,000 residents.
1. Introduction
I003 showed that counting clinics in two official statistics produces agreement for dental clinics and disagreement for general clinics.
Barbershops and beauty salons also appear in two statistics — and, being licensed trades, they are also on an administrative register.
How many barbershops and beauty salons are there, and how many people work in each?
2. Data
| Report on Public Health Administration | MHLW, Report on Public Health Administration, FY2024, Table 10. Premises and employed barbers/beauticians (end of FY2024) |
| Economic Census | 2021 Economic Census, subcategories 782 barbershops and 783 beauty salons (1 June 2021) |
| Population and age 65+ | MIC, Basic Resident Register population, 1 January 2026 |
The Report on Public Health Administration has no municipal breakdown (prefectures, designated cities and core cities only). The unit here is therefore the prefecture, with Economic Census municipal values summed by prefecture.
3. Results
3-1 Beauty salons differ by 72% between statistics
| Public Health Report (end FY2024) | Economic Census (2021) | Difference | |
|---|---|---|---|
| Barbershops | 107,995 | 86,476 | +24.9% |
| Beauty salons | 277,752 | 161,280 | +72.2% |
The gap for beauty salons exceeds that for general clinics in I003 (+26.8%).
The Public Health Report counts premises licensed under environmental health law. A licence may remain until closure is notified.
The Economic Census counts establishments, the units actually operating. The gap may be explained by whether dormant or effectively inactive premises are included, but that is not tested here.
3-2 Two people per shop
| Workers | Premises | Per shop | |
|---|---|---|---|
| Barbershops | 194,531 | 107,995 | 1.80 |
| Beauty salons | 588,291 | 277,752 | 2.12 |
Both are around two, and barbershops fall short of two.
R003 showed that barbershops and beauty salons are among the subcategories least often reduced to a single establishment (3.0% and 2.3%), yet each shop is tiny.
Many shops, each small: the two facts are compatible.
3-3 More barbershops where the population is older
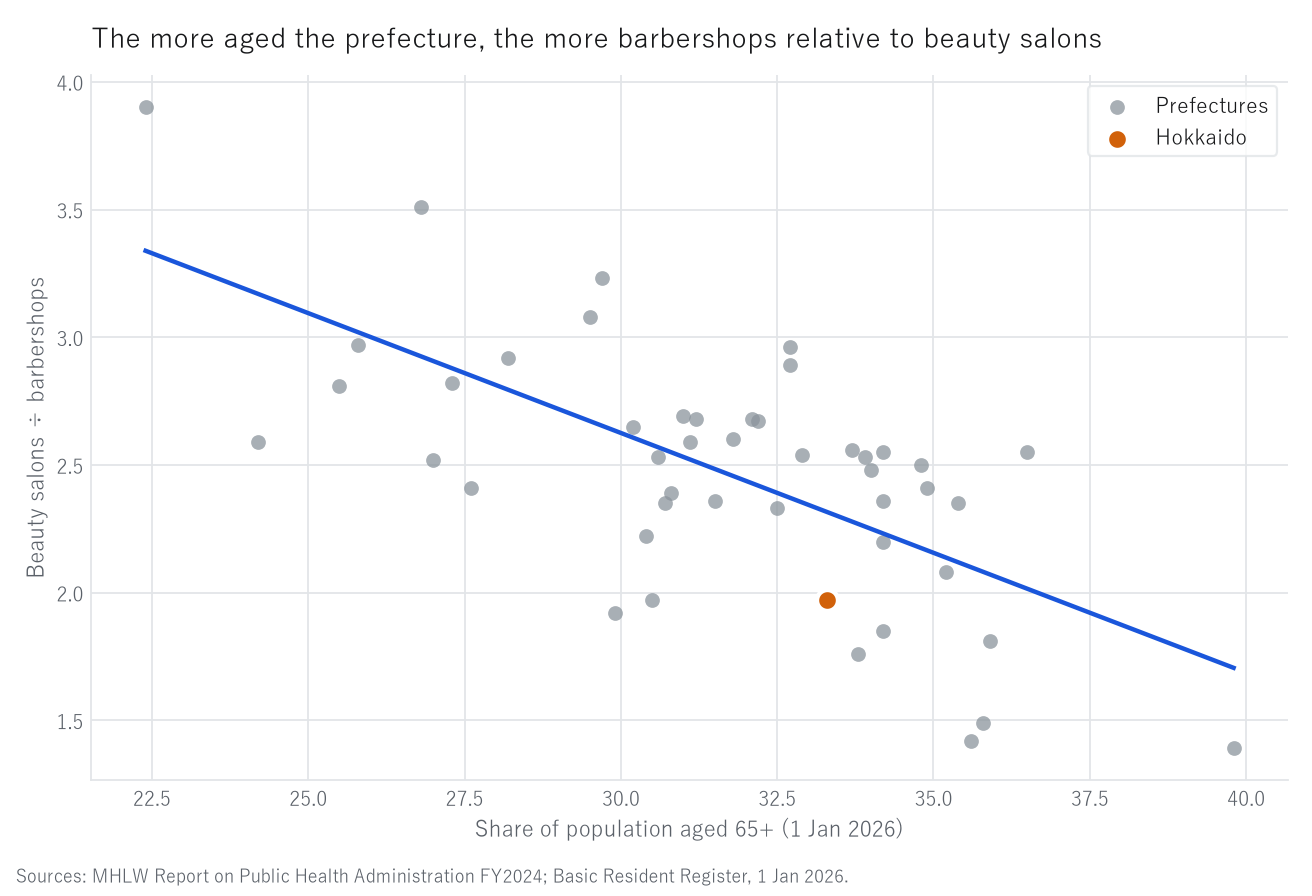
Figure 1. Share aged 65+ and the ratio of beauty salons to barbershops (47 prefectures).
Grey points are prefectures, orange is Hokkaido, and the blue line is a least-squares fit.
| Highest ratio | Barbershops | Beauty salons | Ratio | Aged 65+ |
|---|---|---|---|---|
| Tokyo | 7,328 | 28,589 | 3.90 | 22.4% |
| Osaka | 5,960 | 20,929 | 3.51 | 26.8% |
| Kyoto | 1,929 | 6,232 | 3.23 | 29.7% |
| Lowest ratio | Barbershops | Beauty salons | Ratio | Aged 65+ |
|---|---|---|---|---|
| Iwate | 2,166 | 3,083 | 1.42 | 35.6% |
| Yamagata | 2,100 | 3,119 | 1.49 | 35.8% |
| Akita | 2,083 | 2,903 | 1.39 | 39.8% |
The correlation with the share aged 65+ is r = −0.668. Tokyo has 3.9 beauty salons for every barbershop; Akita has 1.4.
Per head of population, however, both increase with ageing.
| Correlation with share aged 65+ | |
|---|---|
| Barbershops per 10,000 residents | +0.792 |
| Beauty salons per 10,000 residents | +0.723 |
Aged prefectures also have small populations, and R001 showed that establishments per resident rise as population falls.
Within that, barbershops persist more. That is why the ratio declines.
3-4 Hokkaido and the Kushiro Subprefecture
Hokkaido has 11.38 barbershops and 22.41 beauty salons per 10,000 residents, a ratio of 1.97, ranking 39th of 47. Against a 33.3% share aged 65+, its ratio is on the low side.
For the Kushiro Subprefecture only Economic Census figures are available, the Public Health Report having no municipal breakdown.
| Municipality | Population | Barber | Beauty | Barber/10,000 | Beauty/10,000 |
|---|---|---|---|---|---|
| Kushiro City | 151,566 | 195 | 288 | 12.87 | 19.00 |
| Kushiro Town | 18,021 | 20 | 34 | 11.10 | 18.87 |
| Akkeshi | 7,976 | 12 | 14 | 15.05 | 17.55 |
| Hamanaka | 5,172 | 8 | 8 | 15.47 | 15.47 |
In Hamanaka the two are equal in number (8 and 8).
4. Discussion
4-1 A licence register and a business register are different things
The gap is 72.2% for beauty salons and 24.9% for barbershops — the same kind of problem as the general clinics of I003.
To the question "how many hair salons are there in this town", official statistics do not return a single answer.
Which is closer to reality is not judged here. But when speaking of how many businesses there are, one must say whether the figure counts licences or establishments.
4-2 Small shops, in large numbers
Two workers per shop describes the shape of this trade.
There are many shops partly because a shop cannot grow: cutting hair serves one customer at a time.
This is consistent with R002, where barbershops and beauty salons had the lowest possible threshold population (155). Small, and everywhere.
4-3 When the content of demand changes, the ratio changes
The correlation of −0.668 indicates that the same demand — having one's hair cut — differs in content with the age structure.
That reflects differences in which kind of shop people use, the substance of which is not examined here.
5. Limitations
- The Public Health Report is as of end-FY2024, the Census as of 1 June 2021, population as of 1 January 2026: the dates differ
- The Public Health Report counts licensed premises and may include dormant ones; the Census counts establishments
- The Public Health Report has no municipal breakdown; Kushiro figures are from the Census only
- Employed barbers and beauticians are those working at the premises, without distinguishing full-time from part-time
- Census municipal sums (86,476 barbershops; 161,280 beauty salons) may differ slightly from national totals because of suppression rules
- This paper does not judge which statistic is correct
6. Reproduction
- From e-Stat, obtain Report on Public Health Administration, FY2024, Table 10 (CSV). The table also contains re-tabulated rows for designated and core cities; use only the prefecture rows
- From e-Stat, obtain establishments by industrial subcategory and municipality (2021 Economic Census) and sum 782 and 783 by prefecture
- Sum Basic Resident Register population and population aged 65+ by prefecture
- Compute the ratio of counts, workers per premises, and premises per 10,000 residents
All values are the output of a single script (kensan_191). No intermediate value was transcribed by hand.
References and data sources
- MHLW, Report on Public Health Administration, FY2024, Table 10.
- Statistics Bureau of Japan and METI, 2021 Economic Census for Business Activity.
- MIC, Population Based on the Basic Resident Register, 1 January 2026.
- Y. Yamagishi, "At What Population Does a Trade Appear?" (R002). Zenodo. https://doi.org/10.5281/zenodo.22872356
- Y. Yamagishi, "The Only One in Town" (R003). Zenodo. https://doi.org/10.5281/zenodo.22872474
- Y. Yamagishi, "The Same Clinics Counted by Two Official Statistics" (I003). Zenodo. https://doi.org/10.5281/zenodo.22875614
Version history
| Version | Date | Change |
|---|---|---|
| 1 | 2026-09-21 | First release |
How to cite
Yamagishi, Y. (2026). Barbershops and Beauty Salons: Two People per Shop, and More Barbershops Where the Population Is Older [I004]. Zenodo. https://doi.org/10.5281/zenodo.22875820
(This DOI is the concept DOI; it always resolves to the latest version. Cite this one.)
© 2026 Yuuki YAMAGISHI
This work is licensed under a Creative Commons Attribution 4.0 International License (CC BY 4.0).
You may copy, adapt, redistribute and use it commercially, provided you give appropriate credit.
creativecommons.org/licenses/by/4.0
All figures and values in this paper were computed from official statistics. Rights in the underlying data remain with the publishing agencies.
Reference
Yamagishi, Y. (2026). Barbershops and Beauty Salons: Two People per Shop, and More Barbershops Where the Population Is Older [I004]. Zenodo.
DOI: 10.5281/zenodo.22875820
YOI: https://www.yamagishiyuuki.com/yoi/I004
ORCID: 0009-0006-8587-3450
PDF (English) · PDF (Japanese) · Date proof of the English PDF (OpenTimestamps .ots) · SHA256SUMS
The record page for this paper (in Japanese, with the PDFs in each language and the date proof): YOI I004. This paper is a preprint and has not been peer reviewed.