Abstract
I counted eating and drinking places two ways — as licensed premises in the Report on Public Health Administration (end of FY2024, MHLW) and as establishments in the Economic Census (2021, industrial subcategories 761–769) — and compared them.
The total number of licences cannot be read off one table. The June 2021 revision of the Food Sanitation Act rearranged the licence categories, and licences issued under the old Act remain valid until they expire. At the end of FY2024 there were 488,162 under the old Act and 946,451 under the revised Act, 1,434,613 in total. The transition to the revised Act is 66.0% complete.
Licences outnumber establishments 2.91 to 1. The Economic Census counts 493,173 establishments. Food-service licences are not held only by restaurants: inns, hospitals, school and factory canteens, and supermarket delicatessen counters hold them too. Taking only the narrowest old-Act sub-item, "general eating houses and restaurants," gives 266,065 — 0.54 times the establishments, in the opposite direction.
Within the same statistic, the ratio can point the other way. There are 27,223 "café business" licences (of which 18,589 are vending machines) against 58,398 café establishments in the Census, a ratio of 0.47. The revised Act has no "café business" category; it was absorbed into the food-service licence.
A licence category is not a trade category. In the same year and the same statistic, food-service licences are 2.91 times the establishments and café licences 0.47 times.
1. Introduction
I003 counted clinics and I004 barbershops and beauty salons in two official statistics each. In both, the licence count exceeded the establishment count.
Eating and drinking places are where that gap is widest — and where the 2021 revision of the Food Sanitation Act changed the licence categories themselves.
How many eating and drinking places are there? How far apart are the licence count and the establishment count?
2. Data
| Licences (old Act) | MHLW, Report on Public Health Administration, FY2024, Table 2-1: food-business premises requiring a licence under the old Food Sanitation Act (end of FY2024) |
| Licences (revised Act) | Same report, Table 4-1: premises requiring a licence under the revised Act (same date) |
| Economic Census | 2021 Economic Census, subcategories 761–769 (1 June 2021); 760 (ancillary management activity) excluded |
| Population and age 65+ | MIC, Basic Resident Register population, 1 January 2026 |
The Report on Public Health Administration has no municipal breakdown (prefectures, designated cities and core cities only). The unit here is therefore the prefecture, with Economic Census municipal values summed by prefecture.
Nara Prefecture has no row in the old-Act table. The table notes that, because of the system used to manage food-business premises, the breakdown of food-service premises cannot be derived and is therefore not tabulated. Nara is nevertheless included in the national figure: the difference is 1,524 premises (488,162 less the 46-prefecture sum of 486,638). National figures therefore cover all 47 prefectures, while the prefecture-level comparison uses the 46 excluding Nara.
3. Results
3-1 The total requires adding two tables
| Premises | |
|---|---|
| Licensed under the old Food Sanitation Act | 488,162 |
| Licensed under the revised Act | 946,451 |
| Total | 1,434,613 |
The June 2021 revision rearranged the categories of business requiring a licence. The two tables used here each have 32 categories, but their contents differ ("café business," "bean-paste manufacturing" and "miso manufacturing," among others, appear in the old-Act table and not in the revised one). Licences issued under the old Act remain valid until they expire, so at the end of FY2024 the stock is still split across two tables.
Either table alone understates the total. The revised-Act table gives 946,451, which is 66.0% of the actual stock.
Progress differs by prefecture.
| Share under the revised Act | |
|---|---|
| Ehime | 77.1% |
| Oita | 75.7% |
| Fukui | 75.4% |
| (median) | 67.2% |
| Kagoshima | 61.3% |
| Kanagawa | 60.7% |
| Osaka | 59.1% |
Licence terms are set by each local authority within a range of five to eight years, so the pace of conversion partly reflects that.
3-2 Licences are 2.91 times the establishments
| Count | |
|---|---|
| Food-service licences (old + revised, end FY2024) | 1,434,613 |
| Economic Census eating and drinking places (761–769, 2021) | 493,173 |
| Ratio | 2.91 |
This is an order of magnitude beyond the general clinics of I003 (+26.8%) or the beauty salons of I004 (+72.2%).
The reason is that a food-service licence is not held only by an eating and drinking place. Inns and hotels, hospitals, school and factory canteens, supermarket and convenience-store delicatessen counters, and mobile vendors all require one, and a single operator may hold several, one per premises.
The old-Act breakdown shows part of this.
| Old Act, food-service licences (national) | Premises |
|---|---|
| General eating houses, restaurants, etc. | 266,065 |
| Caterers and boxed-meal shops | 28,635 |
| Inns | 14,911 |
| Other | 178,551 |
| Total | 488,162 |
Taking only "general eating houses and restaurants" gives 0.54 times the establishments — the opposite direction.
The number of places in this trade therefore lies somewhere between 0.54 and 2.91 times, and neither table answers the question on its own.
3-3 "Café business" is 0.47 times — the category itself is disappearing
| Count | |
|---|---|
| Café-business licences (old Act only) | 27,223 |
| of which vending machines (re-tabulated) | 18,589 |
| Economic Census cafés (767) | 58,398 |
| Ratio | 0.47 |
The revised Act has no "café business" category; it was absorbed into the food-service licence. The 27,223 remaining are old-Act licences that have not yet expired — and 68.3% of them (18,589) are vending machines, not premises with a counter.
In the same year and the same statistic, food-service licences are 2.91 times the establishments and café licences 0.47 times. One exceeds the establishment count, the other falls short of it.
A licence category is not a trade category.
3-4 Licences and establishments per head, by prefecture
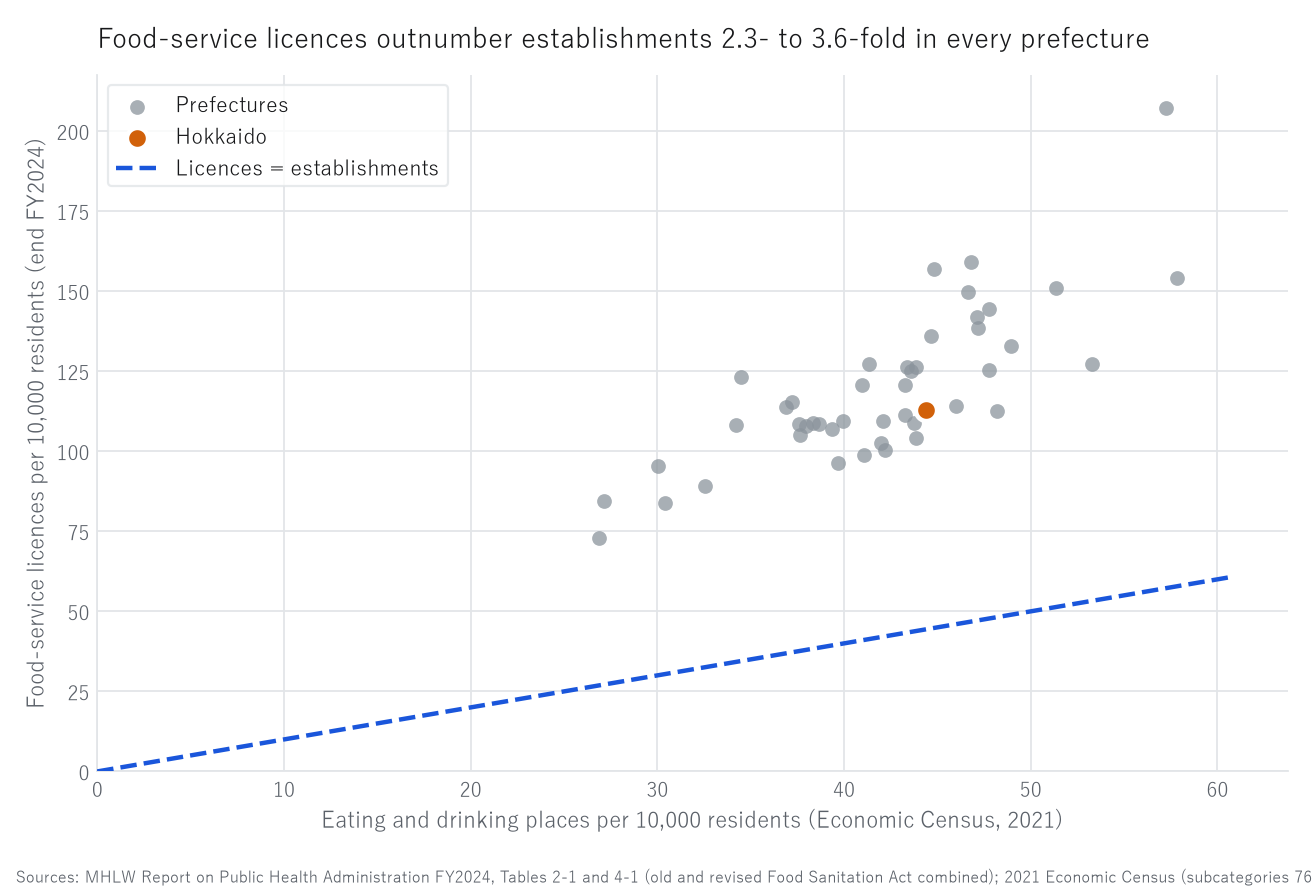
Figure 1. Food-service licences and Economic Census establishments per 10,000 residents (46 prefectures).
Grey points are prefectures, orange is Hokkaido, and the dashed blue line marks equality. Every prefecture lies above it.
Licences and establishments per head track each other closely (r = +0.795), but the ratio varies.
| Highest ratio | Licences | Establishments | Ratio |
|---|---|---|---|
| Okinawa | 30,765 | 8,495 | 3.62 |
| Shizuoka | 43,679 | 12,226 | 3.57 |
| Osaka | 137,683 | 39,357 | 3.50 |
| Lowest ratio | Licences | Establishments | Ratio |
|---|---|---|---|
| Hiroshima | 27,197 | 11,417 | 2.38 |
| Akita | 9,268 | 3,908 | 2.37 |
| Yamagata | 11,212 | 4,798 | 2.34 |
The median is 2.82 (2.91 on national totals). Every prefecture exceeds 2.
Per 10,000 residents, the leaders differ between the two counts.
| Per 10,000 residents | Highest | Lowest |
|---|---|---|
| Establishments | Kochi 57.9 / Okinawa 57.2 / Miyazaki 53.3 | Shiga 30.1 / Chiba 27.1 / Saitama 26.9 |
| Licences | Okinawa 207.3 / Nagano 159.1 / Osaka 156.9 | Chiba 84.4 / Kanagawa 83.9 / Saitama 72.8 |
Nagano ranks second on licences (159.1) but does not reach the top on establishments (46.8), a ratio of 3.40. Where there are many places to stay, licences held by non-restaurants accumulate.
The relationship with ageing is weak: r = +0.273 with establishments per head and r = −0.066 with licences per head.
3-5 Hokkaido and the Kushiro Subprefecture
Hokkaido has 56,366 licences against 22,170 establishments, a ratio of 2.54, 37th of 46. Per 10,000 residents it has 112.8 licences and 44.4 establishments (16th on establishments). It is among the prefectures where the licence count inflates least.
For the Kushiro Subprefecture only Economic Census figures are available, the Report having no municipal breakdown.
| Municipality | Population | Eating & drinking | Cafés | per 10,000 | Cafés per 10,000 |
|---|---|---|---|---|---|
| Kushiro City | 151,566 | 1,030 | 89 | 67.96 | 5.87 |
| Kushiro Town | 18,021 | 79 | 8 | 43.84 | 4.44 |
| Akkeshi | 7,976 | 41 | 4 | 51.40 | 5.02 |
| Hamanaka | 5,172 | 20 | 2 | 38.67 | 3.87 |
| Shibecha | 6,698 | 41 | 5 | 61.21 | 7.46 |
| Teshikaga | 6,327 | 60 | 8 | 94.83 | 12.64 |
| Tsurui | 2,368 | 13 | 3 | 54.90 | 12.67 |
| Shiranuka | 6,840 | 34 | 3 | 49.71 | 4.39 |
The national median across 1,889 municipalities is 35.18 per 10,000 residents. All eight municipalities in the subprefecture exceed it.
Teshikaga, at 94.83, is 2.7 times the national median — sixty establishments for 6,327 residents. The town contains Lake Mashu, Lake Kussharo and the Kawayu hot springs, and its residents alone do not account for the figure. Tsurui's 12.67 cafés per 10,000 points the same way.
In I002, Shiranuka carried the heaviest load in the subprefecture, 131.8 certified care recipients per establishment. Within one town, "many" and "few" change places from trade to trade.
4. Discussion
4-1 Counting licences does not give the number of shops
A ratio of 2.91 cannot be explained by the date gap (three years and ten months, from 1 June 2021 to the end of FY2024). It reflects what the licensing system attaches to:
- non-restaurants (inns, hospitals, schools, factories, supermarkets, mobile vendors) also require a licence
- one operator may hold several, one per premises or per kitchen
- a licence may remain until closure is notified
Answering "how many eating places are there in this town" with licences inflates the figure 2.9-fold; answering with "general eating houses and restaurants" shrinks it to 0.54.
4-2 When the rules change, the series breaks
The 2021 revision rearranged the licence categories. As a result:
- obtaining a total requires adding two tables
- some categories, such as "café business," disappeared altogether
- because conversion has advanced unevenly (59.1% to 77.1%), comparisons between prefectures can be distorted as well
Anyone following this series over time must check whether the definition changed. This paper covers a single date, the end of FY2024.
4-3 In tourist towns, residents do not account for the count
Teshikaga's 94.83 is not fully explained by the tendency shown in R001, that establishments per resident rise as population falls. Shiranuka, of almost the same size, stands at 49.71 — a 1.9-fold difference.
Demand for eating places is not created by residents alone. This paper uses no visitor statistics, so the cause of the difference is not tested here.
5. Limitations
- The Report is as of end-FY2024, the Census as of 1 June 2021, population as of 1 January 2026: the dates differ
- The Report counts licensed premises, and one operator may hold several licences
- Food-service licences are also held by non-restaurants (inns, hospitals, schools, supermarkets and others)
- Nara has no row in the old-Act table. It is included in the national figures but excluded from the prefecture comparison (46)
- The Report has no municipal breakdown; Kushiro figures are from the Census only
- Census municipal sums (493,173 eating and drinking places; 58,398 cafés) may differ slightly from national totals because of suppression rules
- Teshikaga's high count has not been tested against visitor statistics
- This paper does not judge which statistic is correct
6. Reproduction
- From e-Stat, obtain the Report on Public Health Administration, FY2024, Table 2-1 (old Act, CSV) and Table 4-1 (revised Act, CSV). Both contain re-tabulated rows for designated and core cities; use only the prefecture rows
- Confirm that the old-Act table has no row for Nara (the gap between the national figure and the 46-prefecture sum is Nara's share)
- From e-Stat, obtain establishments by industrial subcategory and municipality (2021 Economic Census) and sum 761–769 by prefecture (excluding 760)
- Sum Basic Resident Register population and population aged 65+ by prefecture
- Compute licences (old + revised) divided by establishments, licences and establishments per 10,000 residents, and the share under the revised Act
All values are the output of a single script (kensan_192). No intermediate value was transcribed by hand.
Scope of this paper
No new theory is claimed. This paper measures, for eating and drinking places, how far the licence count and the establishment count diverge when a trade is counted in official statistics. It applies the question of I003 (clinics) and I004 (barbershops and beauty salons) to the trade where the gap is widest. It does not judge which statistic is correct.
References and data sources
- MHLW, Report on Public Health Administration, FY2024, Tables 2-1 and 4-1.
- Statistics Bureau of Japan and METI, 2021 Economic Census for Business Activity.
- MIC, Population Based on the Basic Resident Register, 1 January 2026.
- Y. Yamagishi, "Population and the Number of Industrial Subcategories Present in Japanese Municipalities" (R001). Zenodo. https://doi.org/10.5281/zenodo.22872218
- Y. Yamagishi, "Certified Care Recipients per Establishment" (I002). Zenodo. https://doi.org/10.5281/zenodo.22875542
- Y. Yamagishi, "The Same Clinics Counted by Two Official Statistics" (I003). Zenodo. https://doi.org/10.5281/zenodo.22875614
- Y. Yamagishi, "Barbershops and Beauty Salons: Two People per Shop" (I004). Zenodo. https://doi.org/10.5281/zenodo.22875820
Version history
| Version | Date | Change |
|---|---|---|
| 1 | 2026-09-21 | First release |
How to cite
Yamagishi, Y. (2026). Food-Service Licences Are 2.9 Times the Establishments — and "Café Licences" Are 0.47 Times [I005]. Zenodo. https://doi.org/10.5281/zenodo.22875863
(This DOI is the concept DOI; it always resolves to the latest version. Cite this one.)
© 2026 Yuuki YAMAGISHI
This work is licensed under a Creative Commons Attribution 4.0 International License (CC BY 4.0).
You may copy, adapt, redistribute and use it commercially, provided you give appropriate credit.
creativecommons.org/licenses/by/4.0
All figures and values in this paper were computed from official statistics. Rights in the underlying data remain with the publishing agencies.
Reference
Yamagishi, Y. (2026). Food-Service Licences Are 2.9 Times the Establishments [I005]. Zenodo.
DOI: 10.5281/zenodo.22875863
YOI: https://www.yamagishiyuuki.com/yoi/I005
ORCID: 0009-0006-8587-3450
PDF (English) · PDF (Japanese) · Date proof of the English PDF (OpenTimestamps .ots) · SHA256SUMS
The record page for this paper (in Japanese, with the PDFs in each language and the date proof): YOI I005. This paper is a preprint and has not been peer reviewed.