Abstract
I counted lodging places two ways — as premises licensed under the Inns and Hotels Act in the Report on Public Health Administration (end of FY2024, MHLW), and as establishments in the Economic Census (2021, industrial subcategories 751–759) — and compared them.
Hotels and inns number 52,946 premises with 1,782,232 guest rooms — 33.7 rooms each.
Simple lodgings number 44,901 by licence and 3,265 by establishment: a 13.75-fold difference. For hotels and inns the gap is +52.7%, an order of magnitude smaller. The likely reason is that most simple lodgings are not captured as establishments with workers, but that is not tested here. Even taking all lodging licences (98,338) against all lodging establishments (44,828), the gap is 2.19-fold.
Lodgings are increasing rather than closing. During the year there were 7,720 licences granted against 2,817 closures, a ratio of 2.74. But the direction reverses by region. Tokyo stands at 14.06 while Iwate is 0.39 and Fukushima 0.45; in nine prefectures closures outnumber new licences.
Where there are more lodgings, each one is smaller (r = −0.604). Rooms per premises run from 78.1 in Osaka to 17.8 in Okinawa, and premises per 10,000 residents from 25.6 in Okinawa to 1.0 in Saitama.
Hokkaido has 2,930 premises and 122,333 rooms, 41.8 rooms each, 11th of 47 prefectures. In the Kushiro Subprefecture, Teshikaga has 61.64 lodging establishments per 10,000 residents — 17.3 times the national median of 3.56 across 1,889 municipalities.
1. Introduction
In I005, Teshikaga in the Kushiro Subprefecture had 94.83 eating and drinking places per 10,000 residents, 2.7 times the national median and 1.9 times Shiranuka (49.71) of almost identical population. I wrote there that residents alone do not create the demand, and left the cause untested.
The number of lodgings addresses that directly. And the licence data under the Inns and Hotels Act carries two things absent from the other trades' tables: the number of guest rooms, and openings and closures during the year.
How many lodgings are there, and how many rooms does each have? Are they increasing or closing?
2. Data
| Licences | MHLW, Report on Public Health Administration, FY2024, Table 8: premises and guest rooms for hotel and inn businesses, and premises for simple-lodging and boarding-house businesses, with licences, closures and sanctions (end of FY2024; licences and closures are counts during the year) |
| Economic Census | 2021 Economic Census, subcategories 751 hotels and inns, 752 simple lodgings, 753 boarding houses, 759 other lodging (1 June 2021); 750 (ancillary management activity) excluded |
| Population and age 65+ | MIC, Basic Resident Register population, 1 January 2026 |
All 47 prefectures are present, and their sums match the national row (52,946 premises; 1,782,232 rooms).
The Report has no municipal breakdown (prefectures, designated cities and core cities only). The unit here is therefore the prefecture, with Economic Census municipal values summed by prefecture.
3. Results
3-1 33.7 rooms each, and 45.7% of lodgings are simple lodgings
| Premises | Rooms | Per premises | |
|---|---|---|---|
| Hotels and inns | 52,946 | 1,782,232 | 33.7 |
| Simple lodgings | 44,901 | (not tabulated) | — |
| Boarding houses | 491 | (not tabulated) | — |
| Total | 98,338 |
Simple lodgings are 84.8% as numerous as hotels and inns, and make up 45.7% of all lodging premises. Because rooms are published only for hotels and inns, the total number of guest rooms in Japan cannot be obtained from this table.
In some prefectures simple lodgings outnumber hotels and inns.
| Hotels and inns | Simple lodgings | Ratio | |
|---|---|---|---|
| Kyoto | 955 | 3,647 | 3.82 |
| Nagano | 2,656 | 4,361 | 1.64 |
| Yamanashi | 1,325 | 2,080 | 1.57 |
| Hokkaido | 2,930 | 3,314 | 1.13 |
| Okinawa | 3,799 | 3,804 | 1.00 |
3-2 Simple lodgings: 44,901 by licence, 3,265 by establishment — 13.75-fold
| Public Health Report (end FY2024) | Economic Census (2021) | Ratio | |
|---|---|---|---|
| Hotels and inns | 52,946 | 34,666 | +52.7% |
| Simple lodgings | 44,901 | 3,265 | 13.75× |
| All licences ÷ all lodging establishments | 98,338 | 44,828 | 2.19× |
Set beside the food-service licences of I005 (2.91×), the beauty salons of I004 (+72.2%) and the general clinics of I003 (+26.8%), 13.75 is of a different order.
The +52.7% for hotels and inns can be partly explained by licences persisting until closure is notified, and by the date gap of three years and ten months. That explanation is not enough for 13.75.
The likely reason is that most simple lodgings are not captured as establishments. The Economic Census counts places where workers carry on economic activity continuously. Lodgings run unstaffed, lodgings where the owner lives on site and lets part of the house, and lodgings run alongside another occupation do not readily appear as separate establishments. This is a hypothesis and is not tested here.
Note also that dwellings notified under the Housing Accommodation Business Act (the 2018 "minpaku" law) are not licensed under the Inns and Hotels Act and are therefore not included in the 44,901.
3-3 Openings are 2.74 times closures — but the reverse in nine prefectures
| Count during the year | |
|---|---|
| Licences granted | 7,720 |
| Businesses closed | 2,817 |
| Ratio | 2.74 |
Licences granted equal 7.9% of the year-end stock of 98,338 premises: close to one lodging in ten is newly licensed within a single year.
But the direction reverses by region.
| Increasing | Licences | Closures | Ratio |
|---|---|---|---|
| Tokyo | 1,589 | 113 | 14.06 |
| Kagawa | 160 | 15 | 10.67 |
| Okinawa | 524 | 57 | 9.19 |
| (median) | 2.00 |
| Declining | Licences | Closures | Ratio |
|---|---|---|---|
| Tokushima | 36 | 56 | 0.64 |
| Fukushima | 45 | 101 | 0.45 |
| Iwate | 19 | 49 | 0.39 |
In nine prefectures closures outnumber new licences (Nara 0.98, Wakayama 0.94, Mie 0.93, Yamagata 0.88, Toyama 0.81, Aomori 0.74, Tokushima 0.64, Fukushima 0.45, Iwate 0.39).
The national figure of 2.74 is pulled strongly by Tokyo's 1,589 licences. A single national number does not show that lodgings are disappearing in rural prefectures.
3-4 Where there are more lodgings, each one is smaller
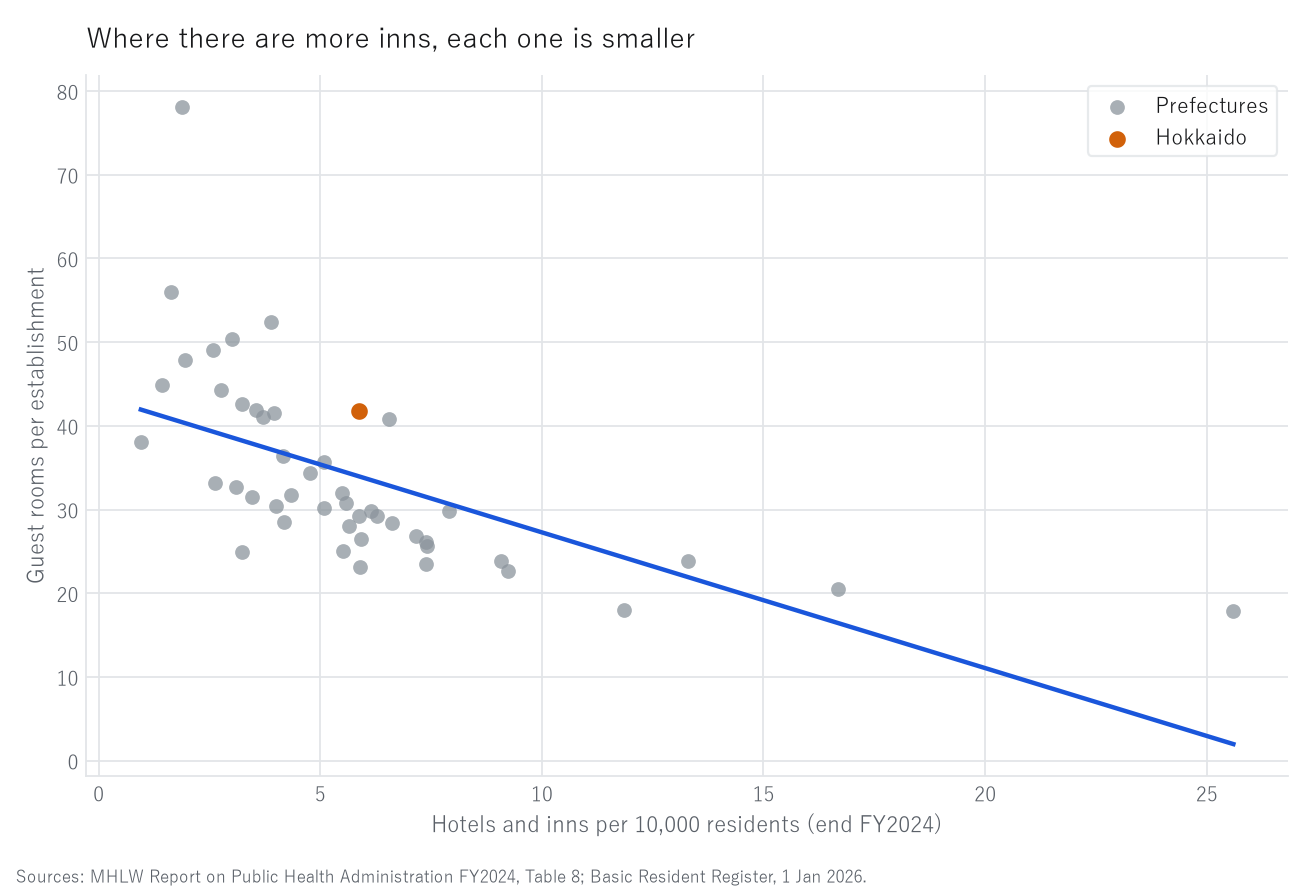
Figure 1. Premises per 10,000 residents and guest rooms per premises (47 prefectures).
Grey points are prefectures, orange is Hokkaido, and the blue line is a least-squares fit.
The correlation is r = −0.604. Prefectures with many lodgings have smaller ones.
| Largest per premises | Premises | Rooms | Per premises |
|---|---|---|---|
| Osaka | 1,646 | 128,519 | 78.1 |
| Aichi | 1,220 | 68,339 | 56.0 |
| Kyoto | 955 | 50,075 | 52.4 |
| Smallest per premises | Premises | Rooms | Per premises |
|---|---|---|---|
| Yamanashi | 1,325 | 27,243 | 20.6 |
| Fukui | 877 | 15,746 | 18.0 |
| Okinawa | 3,799 | 67,747 | 17.8 |
The median is 30.8 rooms.
Per 10,000 residents the rankings separate sharply.
| Per 10,000 residents | Highest | Lowest |
|---|---|---|
| Premises (national 4.3) | Okinawa 25.6 / Yamanashi 16.7 / Nagano 13.3 | Aichi 1.6 / Kanagawa 1.4 / Saitama 1.0 |
| Rooms | Okinawa 457 / Yamanashi 343 / Nagano 317 | Nara 81 / Kanagawa 64 / Saitama 36 |
Okinawa has 25.6 times as many premises per resident as Saitama. Metropolitan prefectures have few large hotels; tourist prefectures have many small ones.
There is almost no relationship with ageing (r = +0.037 with premises per 10,000 residents). The number of lodgings is not set by the age structure of residents.
3-5 Hokkaido and the Kushiro Subprefecture
Hokkaido has 2,930 premises and 122,333 rooms, 41.8 rooms each, 11th of 47. Per 10,000 residents it has 5.9 premises (19th) and 245 rooms (5th). Its 3,314 simple lodgings outnumber its hotels and inns.
Its rank on rooms (5th) is higher than its rank on premises (19th). Hokkaido holds its rooms in size rather than in number.
For the Kushiro Subprefecture only Economic Census figures are available, the Report having no municipal breakdown.
| Municipality | Population | Hotels & inns | Simple lodgings | All lodging | Per 10,000 |
|---|---|---|---|---|---|
| Kushiro City | 151,566 | 69 | 2 | 115 | 7.59 |
| Kushiro Town | 18,021 | 3 | 1 | 5 | 2.77 |
| Akkeshi | 7,976 | 4 | 0 | 5 | 6.27 |
| Hamanaka | 5,172 | 7 | 3 | 10 | 19.33 |
| Shibecha | 6,698 | 7 | 2 | 10 | 14.93 |
| Teshikaga | 6,327 | 31 | 3 | 39 | 61.64 |
| Tsurui | 2,368 | 5 | 1 | 6 | 25.34 |
| Shiranuka | 6,840 | 4 | 0 | 4 | 5.85 |
The national median across 1,889 municipalities is 3.56. Seven of the eight exceed it; only Kushiro Town falls below.
Teshikaga, at 61.64, is 17.3 times the national median — thirty-nine lodging establishments for 6,327 residents. Shiranuka, of almost the same size, stands at 5.85, a 10.5-fold difference.
For reference, the municipalities of at least 1,000 residents with the most lodging establishments per head:
| Municipality | Population | Lodging | Per 10,000 |
|---|---|---|---|
| Nozawaonsen, Nagano | 3,603 | 202 | 560.6 |
| Hakuba, Nagano | 9,751 | 469 | 481.0 |
| Otari, Nagano | 2,779 | 128 | 460.6 |
| Kitashiobara, Fukushima | 2,342 | 106 | 452.6 |
| Katashina, Gunma | 3,787 | 166 | 438.3 |
These are hot-spring and ski villages. Teshikaga's 61.64 is far below that level.
4. Discussion
4-1 Some lodgings are not "establishments"
The 13.75-fold gap for simple lodgings is the largest in this series of reports.
The gaps in I003 (clinics), I004 (barbershops and beauty salons) and I005 (eating places) came from counting the same objects in two different units, licences and establishments. The simple-lodging gap is something else: it suggests that a large number of lodgings do not fit the unit "establishment" at all.
That means counting a region's lodgings with the Economic Census misses a great deal. R001–R003 counted presence and absence using the Economic Census alone; for lodging, that "absence" is especially unreliable.
Which is closer to reality is not judged here, since licences may persist for premises no longer operating.
4-2 Openings and closures point opposite ways in Tokyo and in rural prefectures
Nationally 2.74 reads as "lodgings are increasing," yet in nine prefectures closures exceed new licences. Iwate granted 19 licences against 49 closures.
An average or a national total adds together quantities pointing in opposite directions. When speaking about a region, the national figure cannot simply be applied.
4-3 Teshikaga — the question left open in I005
I005 showed Teshikaga at 94.83 eating and drinking places per 10,000 residents, 2.7 times the national median, and left the cause untested.
In lodging, Teshikaga stands at 61.64, or 17.3 times the national median — a far larger deviation than 2.7. Lodging reflects being a tourist town much more sharply.
This is not proof that the abundance of eating places is due to visitors. Two facts stand side by side: towns with many lodgings also have many eating places. No verification using visitor numbers is carried out here.
4-4 Guest rooms: a unit that can be counted
This table carries something the other trades' statistics lack: the number of rooms. A count of premises says nothing about their size; a count of rooms gives the size of each.
Osaka's 78.1 rooms against Okinawa's 17.8 means that one "lodging" differs 4.4-fold in content. Counting how many lodgings a place has is not enough for comparing regions.
5. Limitations
- The Report is as of end-FY2024, the Census as of 1 June 2021, population as of 1 January 2026: the dates differ
- The Report counts premises licensed under the Inns and Hotels Act; the Census counts establishments
- Rooms are tabulated only for hotels and inns. Rooms for simple lodgings and boarding houses are absent, so a national room total cannot be formed
- Dwellings notified under the Housing Accommodation Business Act are not licensed under the Inns and Hotels Act and are not in this table
- Licences and closures are counts during the year and may include rebuilding or succession of the same premises
- The Report has no municipal breakdown; Kushiro figures are from the Census only
- Guest numbers and occupancy are not used; only counts of premises and rooms
- That simple lodgings are poorly captured as establishments is a hypothesis and is not verified
- This paper does not judge which statistic is correct
6. Reproduction
- From e-Stat, obtain the Report on Public Health Administration, FY2024, Table 8 (CSV). It contains re-tabulated rows for designated and core cities; use only the prefecture rows
- Confirm that the 47 prefecture rows sum to the national row (52,946 premises; 1,782,232 rooms)
- From e-Stat, obtain establishments by industrial subcategory and municipality (2021 Economic Census) and sum 751, 752, 753 and 759 by prefecture (excluding 750)
- Sum Basic Resident Register population and population aged 65+ by prefecture
- Compute rooms per premises, premises and rooms per 10,000 residents, and licences divided by closures
All values are the output of a single script (kensan_194). No intermediate value was transcribed by hand.
Scope of this paper
No new theory is claimed. This paper counts lodgings in two official statistics — business licences and establishments — and compares them. It applies the question of I003 (clinics), I004 (barbershops and beauty salons) and I005 (eating places) to lodging, where the largest gap in the series appears (13.75-fold). It additionally uses two things absent from the other trades' statistics: guest rooms and openings and closures during the year. It does not judge which statistic is correct.
References and data sources
- MHLW, Report on Public Health Administration, FY2024, Table 8.
- Statistics Bureau of Japan and METI, 2021 Economic Census for Business Activity.
- MIC, Population Based on the Basic Resident Register, 1 January 2026.
- Y. Yamagishi, "Population and the Number of Industrial Subcategories Present in Japanese Municipalities" (R001). Zenodo. https://doi.org/10.5281/zenodo.22872218
- Y. Yamagishi, "The Same Clinics Counted by Two Official Statistics" (I003). Zenodo. https://doi.org/10.5281/zenodo.22875614
- Y. Yamagishi, "Barbershops and Beauty Salons: Two People per Shop" (I004). Zenodo. https://doi.org/10.5281/zenodo.22875820
- Y. Yamagishi, "Food-Service Licences Are 2.9 Times the Establishments" (I005). Zenodo. https://doi.org/10.5281/zenodo.22875863
Version history
| Version | Date | Change |
|---|---|---|
| 1 | 2026-09-21 | First release |
How to cite
Yamagishi, Y. (2026). The Number of Inns Differs 13.7-Fold Between Statistics: Simple Lodgings Are Not Counted as Establishments [I006]. Zenodo. https://doi.org/10.5281/zenodo.22876047
(This DOI is the concept DOI; it always resolves to the latest version. Cite this one.)
© 2026 Yuuki YAMAGISHI
This work is licensed under a Creative Commons Attribution 4.0 International License (CC BY 4.0).
You may copy, adapt, redistribute and use it commercially, provided you give appropriate credit.
creativecommons.org/licenses/by/4.0
All figures and values in this paper were computed from official statistics. Rights in the underlying data remain with the publishing agencies.
Reference
Yamagishi, Y. (2026). The Number of Inns Differs 13.7-Fold Between Statistics: Simple Lodgings Are Not Counted as Establishments [I006]. Zenodo.
DOI: 10.5281/zenodo.22876047
YOI: https://www.yamagishiyuuki.com/yoi/I006
ORCID: 0009-0006-8587-3450
PDF (English) · PDF (Japanese) · Date proof of the English PDF (OpenTimestamps .ots) · SHA256SUMS
The record page for this paper (in Japanese, with the PDFs in each language and the date proof): YOI I006. This paper is a preprint and has not been peer reviewed.