Abstract
I counted burials, cremations and grave relocations in the Report on Public Health Administration (FY2024, MHLW, Environmental Health Table 6) and read them against population and the Economic Census.
The cremation rate is 99.9771%. Of 1,674,520 cases, 1,674,137 were cremations and only 383 were burials in the ground.
Of those 383, 250 — 65.3% — were in Kanagawa Prefecture alone. Twenty-nine prefectures recorded at least one burial; the other eighteen recorded none.
Grave relocations number 176,105, equal to 10.5% of cremations. Of these, 3,006 (1.7%) were relocations of graves with no surviving kin. Per 100,000 residents the figure runs from 529 in Nagasaki to 33 in Fukui, a 16.2-fold spread.
Hokkaido accounts for 14,628 relocations, 8.3% of the national total, against 4.0% of the population — a 2.1-fold concentration, 4th of 47 prefectures at 293 per 100,000 residents.
Economic Census subcategory 795 (crematoria and cemetery management) counts 1,568 establishments, implying 1,067.7 cremations per establishment per year — but crematoria are frequently run by municipalities and may not appear as establishments at all.
Cremations per 100,000 residents correlate with the share aged 65 and over at r = +0.936.
1. Introduction
I002 divided demand for care by establishments; I001 divided vehicles by repair shops. Both counted the quantity a trade serves.
The number of deaths is among the most accurately counted quantities in official statistics. Their disposal — burial or cremation — requires a permit from the mayor, and the counts are published nationally and by prefecture.
The same table also carries grave relocations, the moving of a grave, which includes what is popularly called hakajimai, closing a family grave.
How many burials in the ground still take place in Japan? And how many graves are moved?
2. Data
| Burials, cremations, relocations | MHLW, Report on Public Health Administration, FY2024, Environmental Health Table 6: bodies and stillbirths buried and cremated, and grave relocations (counts during FY2024) |
| Economic Census | 2021 Economic Census, subcategories 795 crematoria and cemetery management and 796 ceremonial occasion services (1 June 2021) |
| Population and age 65+ | MIC, Basic Resident Register population, 1 January 2026 |
All 47 prefectures are present and their sums match the national row (1,674,520 total; 383 burials; 1,674,137 cremations; 176,105 relocations). The breakdown also reconciles: 1,658,693 bodies plus 15,827 stillbirths equals 1,674,520.
The Report has no municipal breakdown (prefectures, designated cities and core cities only). The unit here is therefore the prefecture, with Economic Census municipal values summed by prefecture.
These are counts of permits issued by mayors under the Graveyards and Burial Act.
3. Results
3-1 A cremation rate of 99.9771%, and 383 burials
| Cases | Share | |
|---|---|---|
| Total | 1,674,520 | |
| Cremation | 1,674,137 | 99.9771% |
| Burial in the ground | 383 | 0.0229% |
| of which bodies | 108 | |
| of which stillbirths | 275 |
That Japan's cremation rate is high is well known, but the remainder cannot be given as a number without opening this table.
Of the 383 burials, only 108 were bodies. The other 275 were stillbirths (from the fourth month of pregnancy).
3-2 65.3% of burials were in Kanagawa
| Most burials | Cases |
|---|---|
| Kanagawa | 250 |
| Tokyo | 24 |
| Fukuoka | 23 |
| Saitama | 12 |
| Aichi | 12 |
Twenty-nine prefectures recorded at least one burial; eighteen recorded none.
Kanagawa's 250 are 65.3% of the national 383 — concentrated in a single prefecture. This presumably reflects the presence of cemeteries that accept burial, but it is not verified here.
3-3 176,105 grave relocations
| Cases | ||
|---|---|---|
| Relocations | 176,105 | 10.5% of cremations |
| of which graves with no surviving kin | 3,006 | 1.7% of relocations |
Per 100,000 residents the national figure is 142.3, median 148.2.
| Relocations per 100,000 residents | Highest | Lowest |
|---|---|---|
| Nagasaki 529 / Yamaguchi 373 / Kagoshima 365 | Niigata 83 / Miyagi 62 / Fukui 33 |
A 16.2-fold spread.
| Relocations as a share of cremations (national 10.5%) | Highest | Lowest |
|---|---|---|
| Nagasaki 32.2% / Yamaguchi 23.3% / Kagoshima 22.1% | Yamagata 4.8% / Miyagi 4.8% / Fukui 2.3% |
A 14.0-fold spread. In Nagasaki there is one relocation for every three cremations; in Fukui, one for every forty-four.
By absolute count the pattern of concentration changes.
| Most relocations | Cases | Share of national | Share of national population |
|---|---|---|---|
| Hokkaido | 14,628 | 8.3% | 4.0% |
| Tokyo | 12,982 | 7.4% | 11.4% |
| Osaka | 10,376 | 5.9% | 7.1% |
| Hyogo | 9,431 | 5.4% | 4.3% |
| Kanagawa | 9,331 | 5.3% | 7.4% |
Only Hokkaido produces twice its population share of relocations. Tokyo and Kanagawa, conversely, produce less than theirs.
3-4 Relocations are concentrated in Hokkaido
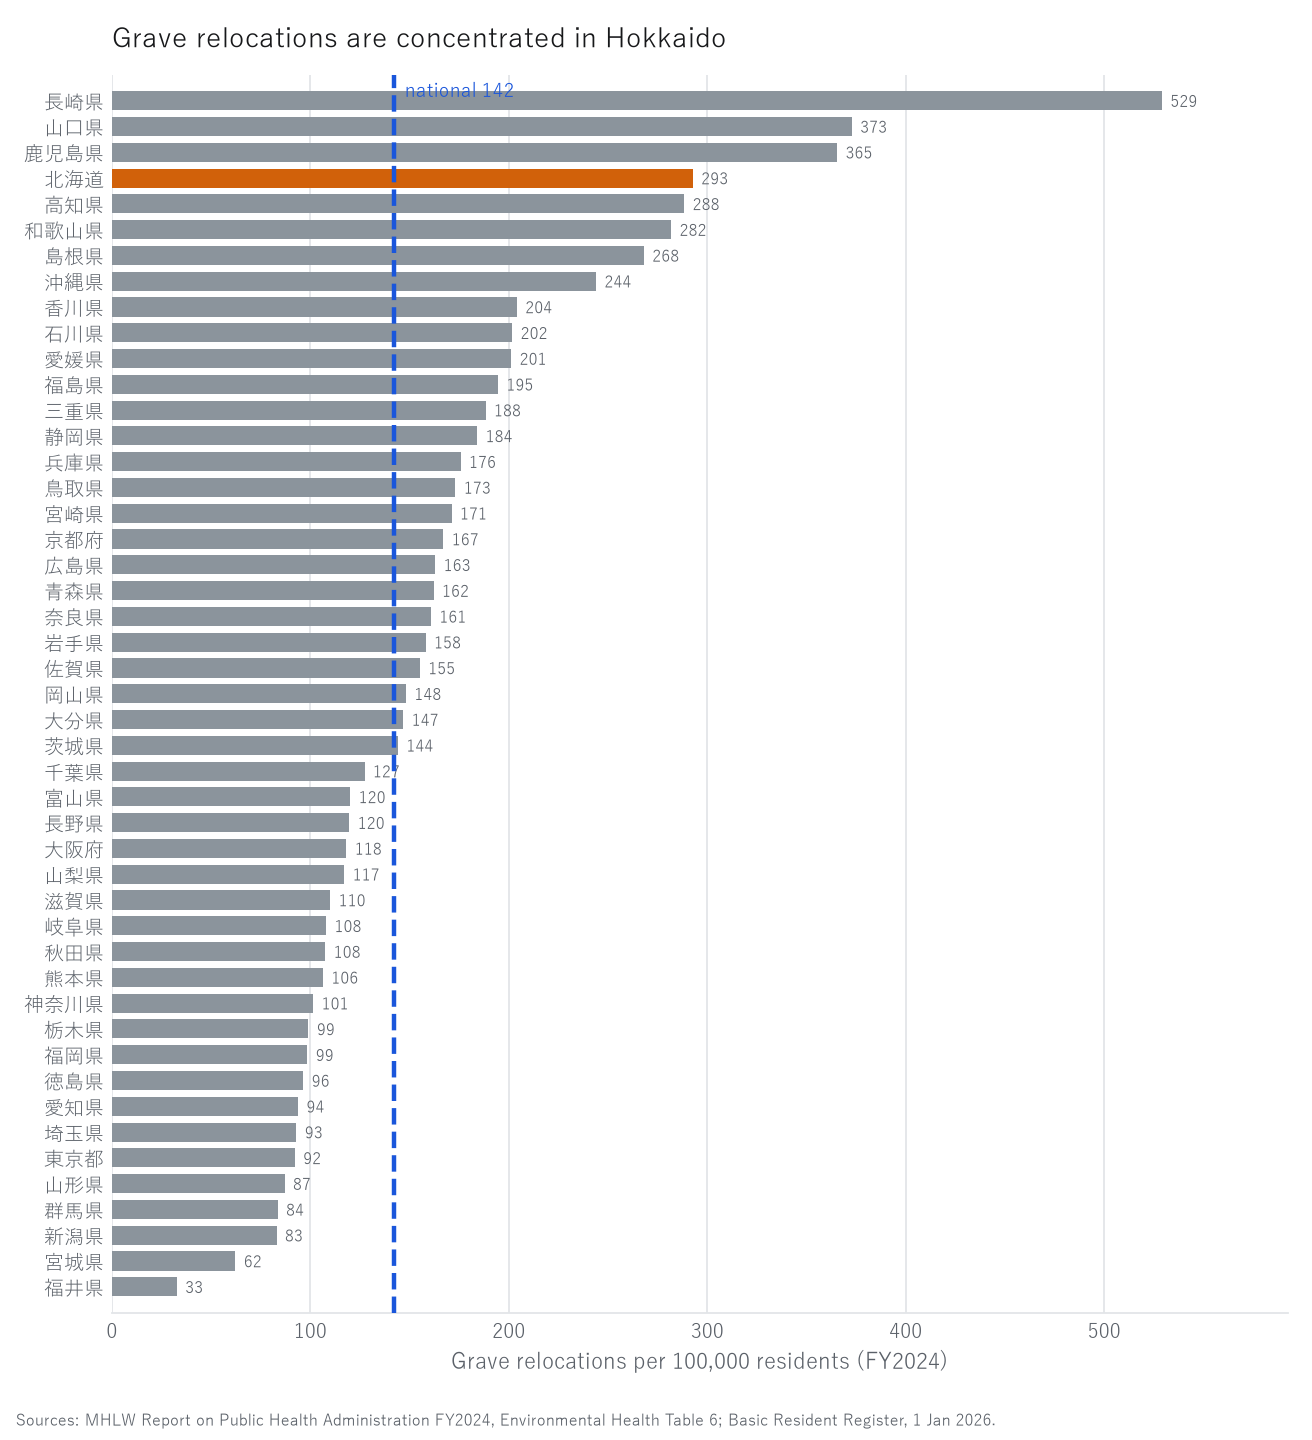
Figure 1. Grave relocations per 100,000 residents (47 prefectures, FY2024).
Grey bars are prefectures, orange is Hokkaido, and the dashed blue line marks the national 142.3.
Hokkaido stands at 293 per 100,000 residents, 4th of 47, and at 18.7% of cremations, 5th. Its relocations of graves with no surviving kin number 239, 8.0% of the national 3,006.
Nagasaki, Yamaguchi and Kagoshima leading the list presumably reflects graves being moved from islands and depopulated areas to the mainland and cities, but this paper does not observe destinations and has not verified it.
3-5 Establishments per cremation
| Establishments (2021) | Cremations per establishment per year | |
|---|---|---|
| 795 crematoria and cemetery management | 1,568 | 1,067.7 |
| 796 ceremonial occasion services | 12,501 | 133.9 |
Subcategory 795 varies widely by prefecture.
| Cremations per 795 establishment | Highest | Lowest |
|---|---|---|
| Tottori 2,766 / Miyagi 2,403 / Iwate 2,020 | Nara 644 / Shimane 567 / Kochi 410 |
The median is 1,121 and the spread 6.7-fold, but this is more likely to reflect whether crematoria are counted as establishments than any difference in workload.
Most crematoria are established and run by municipalities. A municipally operated crematorium may not appear as an establishment in the Economic Census. Nationally, 1,120 of 1,889 municipalities have zero in 795.
Subcategory 796 includes wedding venues and is therefore not a count of funeral businesses.
3-6 Ageing and cremations
| Cremations per 100,000 residents (national 1,353) | Highest | Lowest |
|---|---|---|
| Akita 1,970 / Wakayama 1,919 / Kochi 1,819 | Aichi 1,155 / Kanagawa 1,144 / Tokyo 1,030 |
The correlation with the share aged 65 and over is r = +0.936 — the strongest in this series.
That deaths track age structure is unsurprising. But relocations in the same table correlate at only r = +0.336. The number of people who die is set by age; the number of graves that move is not.
3-7 The Kushiro Subprefecture
The Report has no municipal breakdown, so only Economic Census figures are shown.
| Municipality | Population | 795 | 796 |
|---|---|---|---|
| Kushiro City | 151,566 | 1 | 22 |
| Kushiro Town | 18,021 | 0 | 1 |
| Akkeshi | 7,976 | 0 | 1 |
| Hamanaka | 5,172 | 1 | 0 |
| Shibecha | 6,698 | 0 | 2 |
| Teshikaga | 6,327 | 0 | 2 |
| Tsurui | 2,368 | 1 | 1 |
| Shiranuka | 6,840 | 0 | 3 |
Nationally, 1,120 of 1,889 municipalities have zero in 795 and 357 of 1,889 have zero in 796.
Only three municipalities in the subprefecture have any 795 (Kushiro City, Hamanaka, Tsurui). This does not mean the others have no crematorium: a municipally operated one does not appear as an establishment.
4. Discussion
4-1 Counting the remaining 0.0229%
"Japan's cremation rate is essentially 100%" is correct. But the figure of 383 does not exist until this table is opened.
And those 383 are not spread across the country. They occur in 29 prefectures, and 65.3% of them in Kanagawa. What a percentage erases, an absolute count retains.
This is the thinking of R003, which counted the trades of which a town has only one. A number close to zero is not treated as zero.
4-2 Relocations are not set by the number of deaths
Cremations are almost fully determined by ageing (r = +0.936). Relocations correlate with ageing at only +0.336 and with cremations at +0.347.
They spread 16.2-fold per head and 14.0-fold as a share of cremations. The number of deaths cannot explain that.
Nor can it explain Hokkaido producing 8.3% of relocations on 4.0% of the population. Moving a grave presumably arises where there is a grave and no longer anyone there, but this paper has not verified that.
4-3 What the municipality runs does not appear as an establishment
Subcategory 795 has 1,568 establishments nationally; dividing 1,674,137 cremations gives 1,067.7 per establishment, ranging from 410 to 2,766 across prefectures.
Reading that as regional differences in workload would be unsafe. Most crematoria are municipally run and do not appear as establishments in the Economic Census. In 1,120 of 1,889 municipalities, 795 is zero.
This resembles the simple lodgings of I006 (44,901 licences against 3,265 establishments), but for a different reason. There, the premises were too small to be establishments. Here, they are public and therefore not establishments.
When a region's trades are counted with the Economic Census, the part run by the municipality drops out. That omission is present in the presence and absence counted in R001–R003 as well.
5. Limitations
- The Report covers FY2024, the Census 1 June 2021, population 1 January 2026: the dates differ
- Burials, cremations and relocations are counts of permits issued by mayors under the Graveyards and Burial Act, which need not equal the acts actually performed
- "Relocation" means moving a grave. It includes but is not identical to closing a family grave; it covers removal to a communal grave or scattering as well as transfer to another cemetery
- Why burials concentrate in Kanagawa is not verified here
- Destinations of relocations are not observed
- Most crematoria are established and run by municipalities and may not appear as Economic Census establishments
- Subcategory 796 includes wedding venues and is not a count of funeral businesses
- The Report has no municipal breakdown; Kushiro figures are from the Census only
- Costs, the number of cemeteries and forms of interment (tree burial, scattering at sea) are not examined
6. Reproduction
- From e-Stat, obtain the Report on Public Health Administration, FY2024, Environmental Health Table 6 (CSV). It contains re-tabulated rows for designated and core cities; use only the prefecture rows
- Confirm that the 47 prefecture rows sum to the national row and that bodies plus stillbirths equals the total (1,674,520; 383 burials; 1,674,137 cremations; 176,105 relocations)
- From e-Stat, obtain establishments by industrial subcategory and municipality (2021 Economic Census) and sum 795 and 796 by prefecture
- Sum Basic Resident Register population and population aged 65+ by prefecture
- Compute the cremation rate, relocations per 100,000 residents, relocations as a share of cremations, and cremations per 795 establishment
All values are the output of a single script (kensan_198). No intermediate value was transcribed by hand.
Scope of this paper
No new theory is claimed. This paper reads counts of permits under the Graveyards and Burial Act against population and Economic Census establishments. It gives the "remainder" of the cremation rate as an absolute number, shows the regional spread of grave relocations, and confirms in one case that publicly operated facilities are poorly captured by the Economic Census. The concentration of burials in Kanagawa and the causes of the regional spread in relocations are not established here.
References and data sources
- MHLW, Report on Public Health Administration, FY2024, Environmental Health Table 6.
- Statistics Bureau of Japan and METI, 2021 Economic Census for Business Activity.
- MIC, Population Based on the Basic Resident Register, 1 January 2026.
- Y. Yamagishi, "The Only One in Town" (R003). Zenodo. https://doi.org/10.5281/zenodo.22872474
- Y. Yamagishi, "Certified Care Recipients per Establishment" (I002). Zenodo. https://doi.org/10.5281/zenodo.22875542
- Y. Yamagishi, "The Number of Inns Differs 13.7-Fold Between Statistics" (I006). Zenodo. https://doi.org/10.5281/zenodo.22876047
- Y. Yamagishi, "Of 23,668 'Public Bathhouses,' 2,730 Are Neighbourhood Baths" (I009).
Version history
| Version | Date | Change |
|---|---|---|
| 1 | 2026-09-21 | First release |
How to cite
Yamagishi, Y. (2026). 383 Burials, 1,674,137 Cremations — and 176,105 Grave Relocations [I010]. Zenodo. https://doi.org/10.5281/zenodo.22876503
(This DOI is the concept DOI; it always resolves to the latest version. Cite this one.)
© 2026 Yuuki YAMAGISHI
This work is licensed under a Creative Commons Attribution 4.0 International License (CC BY 4.0).
You may copy, adapt, redistribute and use it commercially, provided you give appropriate credit.
creativecommons.org/licenses/by/4.0
All figures and values in this paper were computed from official statistics. Rights in the underlying data remain with the publishing agencies.
Reference
Yamagishi, Y. (2026). 383 Burials, 1,674,137 Cremations [I010]. Zenodo.
DOI: 10.5281/zenodo.22876503
YOI: https://www.yamagishiyuuki.com/yoi/I010
ORCID: 0009-0006-8587-3450
PDF (English) · PDF (Japanese) · Date proof of the English PDF (OpenTimestamps .ots) · SHA256SUMS
The record page for this paper (in Japanese, with the PDFs in each language and the date proof): YOI I010. This paper is a preprint and has not been peer reviewed.