Abstract
For the notification regime created by the June 2021 revision of the Food Sanitation Act, I counted premises in the Report on Public Health Administration (end of FY2024, MHLW, Food Sanitation Table 6-1) and set them against the licences of I005 and the Economic Census.
There are 865,122 notified food-business premises. The breakdown is retail 375,993 (43.5%), businesses formerly requiring a licence 313,215 (36.2%), manufacturing and processing 90,588 (10.5%), and other 85,326 (9.9%); the four reconcile exactly to the total.
Of these, 174,742 (20.2%) are vending machines — 119,157 cup-type machines and 55,585 others. One notification in five is an unstaffed machine.
Together with the 1,434,613 licences of I005, the total is 2,299,735 premises, or 185.8 per 10,000 residents; notifications are 37.6% of it.
Department stores and general merchandise supermarkets show 32,465 notifications against 1,097 Economic Census establishments — a 29.6-fold gap.
Itinerant selling totals 10,408 nationally, of which 2,187 (21.0%) are in Miyazaki Prefecture. Per 100,000 residents Miyazaki stands at 211.1, 5.6 times second-placed Kochi at 37.9.
1. Introduction
I005 counted food businesses requiring a licence: 488,162 under the old Act plus 946,451 under the revised Act, 1,434,613 in all.
But the June 2021 revision did more than rearrange licence categories. Food businesses not requiring a licence were placed under an obligation to notify — shops that sell food, places that make it, institutional canteens, and vending machines.
How many food businesses do not require a licence? And what are they?
2. Data
| Notifications | MHLW, Report on Public Health Administration, FY2024, Food Sanitation Table 6-1: notified food-business premises by type of business and prefecture (end of FY2024) |
| Licences | Same report, Tables 2-1 and 4-1, as used in I005 (1,434,613 in total) |
| Economic Census | 2021 Economic Census, subcategories 561 department stores and general merchandise supermarkets and 589 other general merchandise retail (1 June 2021) |
| Population and age 65+ | MIC, Basic Resident Register population, 1 January 2026 |
All 47 prefectures are present and their sums match the national row. The four component groups also reconcile exactly to the total (difference 0).
The Report has no municipal breakdown (prefectures, designated cities and core cities only). The unit here is the prefecture.
Census figures are taken from the national row. Summing municipalities gives 1,090 for 561 and 118,703 for 589, short by the suppressed cells.
3. Results
3-1 Inside the 865,122
| Premises | Share | |
|---|---|---|
| Retail | 375,993 | 43.5% |
| Businesses formerly requiring a licence | 313,215 | 36.2% |
| Manufacturing and processing | 90,588 | 10.5% |
| Other | 85,326 | 9.9% |
| Total | 865,122 |
"Businesses formerly requiring a licence" are those moved from licence to notification by the revision — retail of fish and of meat (pre-packed only), dairy retail, ice retail, and cup-type vending machines.
By individual category the order is:
| Category | Premises | Share of total |
|---|---|---|
| Other food and drink retail | 174,804 | 20.2% |
| Cup-type vending machines (self-cleaning, indoor) | 119,157 | 13.8% |
| Dairy retail | 110,276 | 12.7% |
| Institutional catering | 63,337 | 7.3% |
| Other vending machines | 55,585 | 6.4% |
| Convenience stores | 54,190 | 6.3% |
| Meat retail (pre-packed only) | 47,505 | 5.5% |
| Other food manufacturing and processing | 37,270 | 4.3% |
| Fish retail (pre-packed only) | 34,692 | 4.0% |
| Vegetable and fruit retail | 32,764 | 3.8% |
3-2 One in five is a vending machine
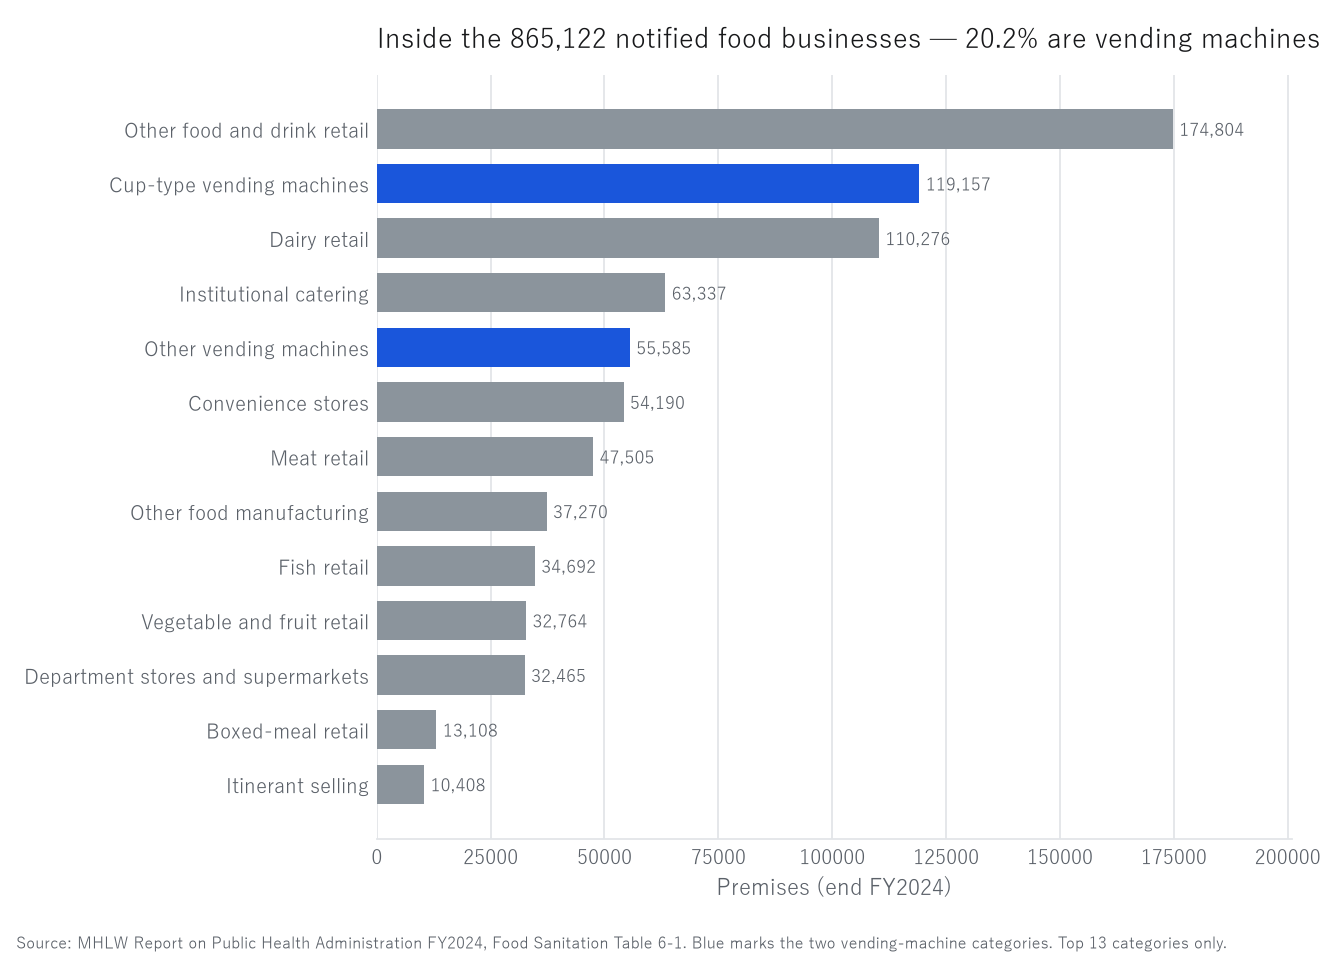
Figure 1. Inside the notified food businesses (end of FY2024, top thirteen categories).
Blue marks the two vending-machine categories; grey is everything else.
| Premises | |
|---|---|
| Cup-type vending machines | 119,157 |
| Other vending machines | 55,585 |
| Together | 174,742 |
| Share of total | 20.2% |
One notification in five is an unstaffed machine.
When "how many food businesses are there" is counted, a fifth of the answer is vending machines. One believes one is counting shops and is counting machines.
3-3 2,299,735 together with licences
| Premises | |
|---|---|
| Requiring a licence (I005) | 1,434,613 |
| Requiring notification (this paper) | 865,122 |
| Total | 2,299,735 |
Notifications are 37.6% of the total, which comes to 185.8 premises per 10,000 residents.
After the June 2021 revision, food businesses requiring neither a licence nor a notification are all but gone. This 2,299,735 is therefore an approximate whole for food businesses in Japan.
But the same premises may appear under both a licence and a notification. This paper has not checked that, so 2,299,735 should be read as close to an upper bound.
3-4 Department stores: a 29.6-fold gap
| Count | Ratio | |
|---|---|---|
| Notifications, department stores and supermarkets | 32,465 | 29.6× |
| Economic Census 561 | 1,097 |
On average thirty notifications are filed per store. Presumably each store contains several sections handling food, each filing separately, but this is not verified here.
Convenience stores go the other way.
| Count | Ratio | |
|---|---|---|
| Notifications, convenience stores | 54,190 | 0.45× |
| Economic Census 589 | 119,435 |
Since 589 includes more than convenience stores, this is not a comparison of like with like.
After the simple lodgings of I006 (13.75×, not captured as establishments) and the crematoria of I010 (public, therefore not establishments), this is a third pattern in which premises and establishments diverge: several premises inside one establishment.
3-5 By prefecture
| Notified premises per 10,000 residents (national 69.9, median 79.8) | Highest | Lowest |
|---|---|---|
| Kochi 124.5 / Miyazaki 120.7 / Iwate 104.1 | Gunma 49.5 / Kanagawa 47.6 / Chiba 47.4 |
A 2.62-fold spread. The correlation with ageing is r = +0.594: more aged prefectures have more notified premises per head.
| Share that are vending machines (national 20.2%) | Highest | Lowest |
|---|---|---|
| Aichi 33.7% / Mie 30.7% / Ishikawa 28.3% | Aomori 10.4% / Kagoshima 8.7% / Miyazaki 7.8% |
The correlation with ageing is r = −0.479 — the opposite direction. The same "number of food businesses" contains different things in different prefectures.
3-6 21.0% of itinerant selling is in Miyazaki
| Itinerant selling per 100,000 residents (national 8.4; 10,408 nationally) | Highest | Lowest |
|---|---|---|
| Miyazaki 211.1 / Kochi 37.9 / Osaka 21.2 | Iwate 1.1 / Aichi 1.1 / Nagano 0.5 |
Miyazaki's 2,187 are 21.0% of the national 10,408. Per 100,000 residents it is 5.6 times second-placed Kochi.
Itinerant selling is the sale of food while travelling, without fixed premises. Why it concentrates in Miyazaki is not established here.
No prefecture has zero. The correlation with ageing is r = +0.113, essentially none.
3-7 Hokkaido and the Kushiro Subprefecture
Hokkaido has 34,412 notifications, 68.9 per 10,000 residents, 32nd of 47, just below the national 69.9.
Vending machines number 6,042, or 17.6% (28th). Itinerant selling stands at 997, or 20.0 per 100,000 residents (4th). Institutional catering numbers 2,335 (46.7 per 100,000).
For the Kushiro Subprefecture only Economic Census subcategories 561 and 589 are available.
| Municipality | Population | 561 | 589 |
|---|---|---|---|
| Kushiro City | 151,566 | 0 | 176 |
| Kushiro Town | 18,021 | 1 | 23 |
| Akkeshi | 7,976 | 0 | 16 |
| Hamanaka | 5,172 | 0 | 10 |
| Shibecha | 6,698 | 0 | 13 |
| Teshikaga | 6,327 | 0 | 9 |
| Tsurui | 2,368 | 0 | 4 |
| Shiranuka | 6,840 | 0 | 6 |
Kushiro City, with 151,566 residents, has zero establishments in 561. The value is recorded as zero, not suppressed. Only Kushiro Town has one.
Subcategory 561 covers establishments retailing goods across clothing, food and housing where none exceeds 50% of sales, with at least fifty regular workers. It does not mean Kushiro City has no large stores; it means no store falls into this subcategory.
4. Discussion
4-1 What is counted is not shops
20.2% of the 865,122 notifications are vending machines. What is inside "other food and drink retail" (174,804, another 20.2%) cannot be told from this table.
A count of "food businesses" is not a count of shops. In I005 the food-service licences were 2.91 times the establishments. Notifications work the same way: the unit "premises" is not the unit "establishment."
It is the shape of I009's public bathhouses (2,730 neighbourhood baths within 23,668), where the figure cannot be interpreted without opening the categories.
4-2 Three patterns in which premises and establishments diverge
This series has now seen three.
| Pattern | Example | Direction |
|---|---|---|
| Not captured as establishments | I006 simple lodgings, 13.75× | more premises |
| Public, therefore not establishments | I010 crematoria (zero in 1,120 municipalities) | more premises |
| Several premises in one establishment | This paper, department stores, 29.6× | more premises |
All three give more premises, but for different reasons. And in I009, choosing a different category brought the two into agreement at 1.19.
Disagreement comes in kinds.
4-3 More aged prefectures have more food businesses and fewer vending machines
Notified premises per head correlate with ageing at r = +0.594; the vending-machine share at r = −0.479. The directions are opposite.
R001 showed that establishments per resident rise as population falls. Aged prefectures have small populations, so more notifications per head is consistent.
The low vending-machine share is a separate matter. Aichi's 33.7% against Miyazaki's 7.8% is more than a fourfold difference, and this paper does not establish why.
4-4 Itinerant selling, a trade that remains
Of 10,408 itinerant sellers, 2,187 are in Miyazaki — 21.0% in one prefecture.
Itinerant selling is the sale of food while travelling, without fixed premises. I007 found 140 towns and villages with no pharmacy; I008 found 192 municipalities with no laundry establishment. As a way of delivering goods where there are no shops, itinerant selling survives in the regulations.
But that need does not explain the concentration in Miyazaki. The practice of notification may differ by prefecture. This paper has not checked.
5. Limitations
- The Report is as of end-FY2024, the Census as of 1 June 2021, population as of 1 January 2026: the dates differ
- Notification was created by the June 2021 revision and cannot be compared simply with anything before it
- "Businesses formerly requiring a licence" are those moved from licence to notification by that revision
- Vending machines are notified individually and counted as one premises each, like a staffed shop
- Why department-store notifications exceed establishments is not verified here
- Economic Census subcategory 589 includes more than convenience stores
- The 2,299,735 total may double-count premises appearing under both a licence and a notification
- Why itinerant selling concentrates in Miyazaki is not established (differences in the practice of notification are among the possibilities)
- The Report has no municipal breakdown; Kushiro figures are from the Census only
6. Reproduction
- From e-Stat, obtain the Report on Public Health Administration, FY2024, Food Sanitation Table 6-1 (CSV). It contains re-tabulated rows for designated and core cities; use only the prefecture rows
- Confirm that the 47 prefecture rows sum to the national row and that the four component groups sum to the total (865,122)
- Add cup-type vending machines to other vending machines to obtain 174,742
- Add the licence total of 1,434,613 from I005 (
kensan_192) - From e-Stat, obtain establishments by industrial subcategory from the 2021 Economic Census and use the national row for 561 and 589 (summing municipalities falls short by the suppressed cells)
- Sum Basic Resident Register population and population aged 65+ by prefecture
All values are the output of a single script (kensan_200). No intermediate value was transcribed by hand.
Scope of this paper
No new theory is claimed. This paper counts the premises under the notification regime created by the 2021 revision of the Food Sanitation Act, opens the count by category, and sets it beside the licences of I005. It shows that vending machines make up a fifth, that premises and establishments diverge 29.6-fold for department stores, and that 21.0% of itinerant selling is in one prefecture. The reasons for the divergence and for the concentration are not established.
References and data sources
- MHLW, Report on Public Health Administration, FY2024, Food Sanitation Table 6-1.
- Statistics Bureau of Japan and METI, 2021 Economic Census for Business Activity.
- MIC, Population Based on the Basic Resident Register, 1 January 2026.
- Y. Yamagishi, "Food-Service Licences Are 2.9 Times the Establishments" (I005). Zenodo. https://doi.org/10.5281/zenodo.22875863
- Y. Yamagishi, "The Number of Inns Differs 13.7-Fold Between Statistics" (I006). Zenodo. https://doi.org/10.5281/zenodo.22876047
- Y. Yamagishi, "Of 23,668 'Public Bathhouses,' 2,730 Are Neighbourhood Baths" (I009).
- Y. Yamagishi, "383 Burials, 1,674,137 Cremations" (I010). Zenodo. https://doi.org/10.5281/zenodo.22876503
Version history
| Version | Date | Change |
|---|---|---|
| 1 | 2026-09-21 | First release |
How to cite
Yamagishi, Y. (2026). 865,122 Notified Food Businesses — One in Five Is a Vending Machine [I011]. Zenodo. https://doi.org/10.5281/zenodo.22876599
(This DOI is the concept DOI; it always resolves to the latest version. Cite this one.)
© 2026 Yuuki YAMAGISHI
This work is licensed under a Creative Commons Attribution 4.0 International License (CC BY 4.0).
You may copy, adapt, redistribute and use it commercially, provided you give appropriate credit.
creativecommons.org/licenses/by/4.0
All figures and values in this paper were computed from official statistics. Rights in the underlying data remain with the publishing agencies.
Reference
Yamagishi, Y. (2026). 865,122 Notified Food Businesses [I011]. Zenodo.
DOI: 10.5281/zenodo.22876599
YOI: https://www.yamagishiyuuki.com/yoi/I011
ORCID: 0009-0006-8587-3450
PDF (English) · PDF (Japanese) · Date proof of the English PDF (OpenTimestamps .ots) · SHA256SUMS
The record page for this paper (in Japanese, with the PDFs in each language and the date proof): YOI I011. This paper is a preprint and has not been peer reviewed.