Abstract
I counted the premises licensed, registered or notified under the Pharmaceuticals and Medical Devices Act, from the Report on Public Health Administration (end of FY2024, MHLW, Pharmaceutical Affairs Table 2), and set them against the pharmacies of I007 and the Economic Census.
The total is 697,897, and the six categories reconcile exactly. Of these, medical devices account for 555,185, or 79.6%; medicines 128,458 (18.4%), cosmetics 8,830, quasi-drugs 3,744, regenerative medicine products 1,224 and in-vitro diagnostics 456.
The largest single category is retail of controlled medical devices at 343,210 — 49.2% of the total. It is the notification required to sell thermometers, blood-pressure monitors, contact lenses and electric massagers, so it includes shops that are neither pharmacies nor drugstores.
Pharmacies, at 63,203, are only 9.1% of the total, and 49.2% even within medicines.
Pharmacies plus shop-based retail (92,738) against Economic Census subcategory 603 (90,344) gives 1.03. I007 noted that 603 is not the same thing as a pharmacy; adding the right category brings them into agreement.
Placement selling — the traditional practice of leaving medicines and collecting later — numbers 4,362 premises with 8,302 workers. Per 100,000 residents, Toyama leads at 11.2.
The inspection rate is 27.7% nationally, but runs from 91.6% in Nagano to 4.1% in Nara — a 22.1-fold difference.
1. Introduction
I007 counted 63,203 pharmacies, found 140 towns and villages with none, and showed that 94.4% are not their owner's shop.
But the Act covers more than pharmacies. Medicines, quasi-drugs, cosmetics, medical devices, in-vitro diagnostics and regenerative medicine products each require a licence, registration or notification to manufacture, sell, rent or repair.
How many businesses deal in medicines and devices? And what share of them are pharmacies?
2. Data
| Pharmaceutical businesses | MHLW, Report on Public Health Administration, FY2024, Pharmaceutical Affairs Table 2: licensed, registered and notified premises and premises subject to inspection, by type of business and prefecture (end of FY2024; inspections during the year) |
| Economic Census | 2021 Economic Census, subcategory 603 pharmaceutical and cosmetic retailing (1 June 2021, national row) |
| Population and age 65+ | MIC, Basic Resident Register population, 1 January 2026 |
All 47 prefectures are present and their sums match the national row. The six categories also reconcile exactly to the total (difference 0).
Retail and rental of general medical devices and some other cells are marked "·" (no figure) in the table and are not included in the total.
The Report has no municipal breakdown (prefectures, designated cities and core cities only). The unit here is the prefecture.
3. Results
3-1 Four-fifths are medical devices
| Category | Premises | Share |
|---|---|---|
| Medical devices | 555,185 | 79.6% |
| Medicines | 128,458 | 18.4% |
| Cosmetics | 8,830 | 1.3% |
| Quasi-drugs | 3,744 | 0.5% |
| Regenerative medicine products | 1,224 | 0.2% |
| In-vitro diagnostics | 456 | 0.1% |
| Total | 697,897 |
What the word "pharmaceutical" brings to mind is not what the count contains. Four-fifths are medical devices.
3-2 Half is retail of controlled medical devices
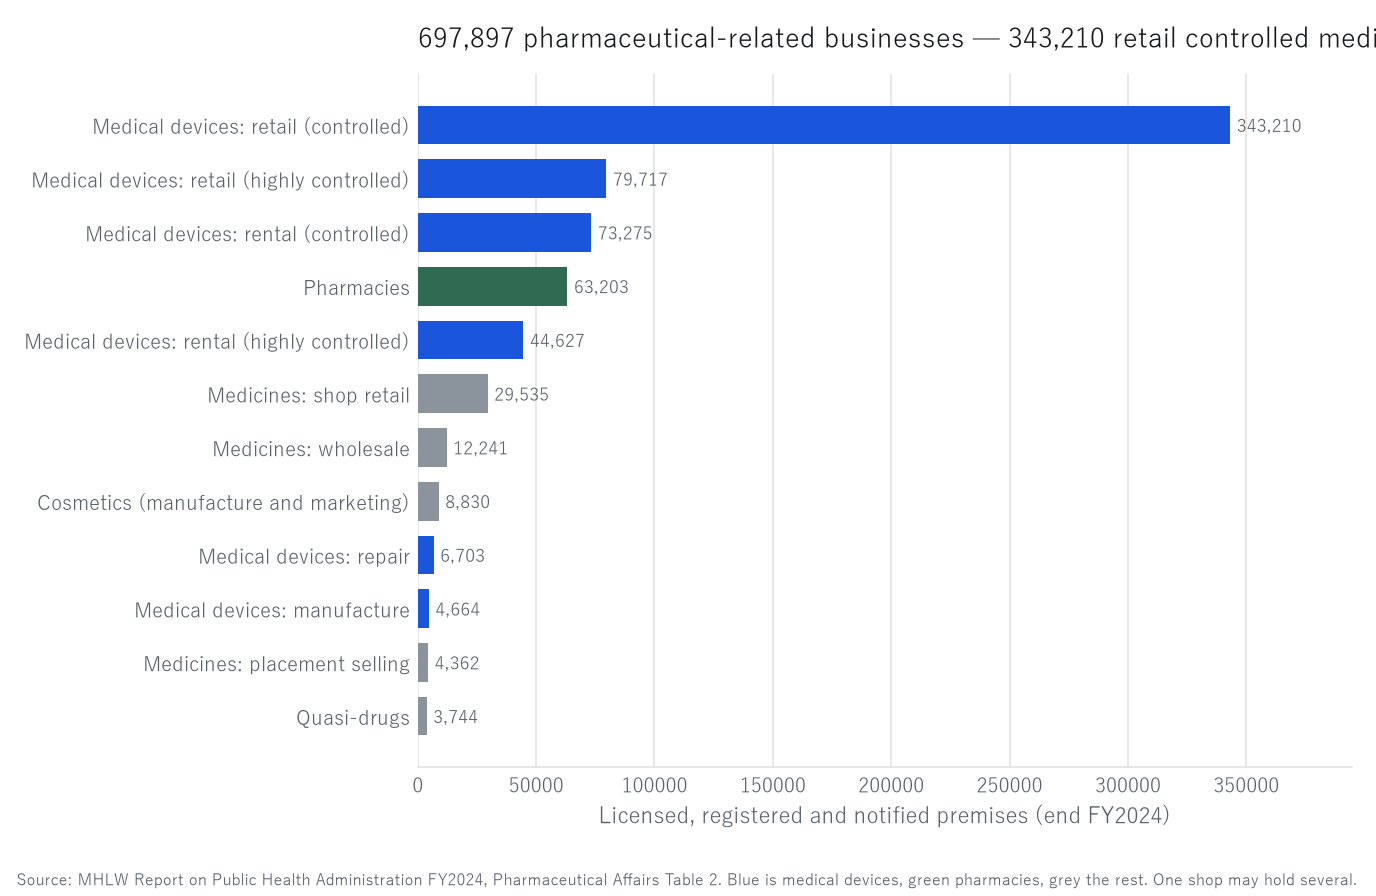
Figure 1. Inside the pharmaceutical-related businesses (end of FY2024, main categories).
Blue is medical devices, green pharmacies, grey the rest.
| Medical devices | Premises | Share of total |
|---|---|---|
| Retail (controlled devices) | 343,210 | 49.2% |
| Retail (highly controlled devices) | 79,717 | 11.4% |
| Rental (controlled devices) | 73,275 | 10.5% |
| Rental (highly controlled devices) | 44,627 | 6.4% |
| Repair (prefectural licence) | 6,703 | 1.0% |
| Manufacture | 4,664 | 0.7% |
Retail of controlled medical devices alone is 49.2% of the total.
Controlled medical devices include thermometers, blood-pressure monitors, contact lenses, electric massagers and hearing aids. Selling them requires a notification, so the count takes in opticians, electronics retailers, convenience stores and mail-order sellers as well as pharmacies and drugstores.
Retail comes to 422,927 and rental to 117,902 — rental is 0.28 times retail. Nursing beds and wheelchairs fall here.
3-3 Pharmacies are 9.1%
| Premises | Share of total | |
|---|---|---|
| Pharmacies | 63,203 | 9.1% |
Within medicines the breakdown is:
| Medicines | Premises | Share of medicines |
|---|---|---|
| Pharmacies | 63,203 | 49.2% |
| Shop-based retail | 29,535 | 23.0% |
| Wholesale | 12,241 | 9.5% |
| Placement selling | 4,362 | 3.4% |
The 63,203 pharmacies are the same figure counted in I007.
3-4 Add the right category and the Census agrees
| Count | Ratio | |
|---|---|---|
| Pharmacies + shop-based retail | 92,738 | 1.03× |
| Economic Census 603 | 90,344 |
I007 compared 63,203 pharmacies against 603 (90,344), obtained 0.70, and noted that 603 includes drugstores and cosmetics retailers and is not the same thing as a pharmacy.
Adding the 29,535 shop-based retailers brings the ratio to 1.03. Shop-based retail is where a registered seller, not necessarily a pharmacist, may sell class-2 and class-3 medicines; most drugstores fall here.
In I009 the public bathhouses differed 10.34-fold on the total but only 1.19-fold on the neighbourhood baths. This is the second case of "choose the matching category and they match."
3-5 Placement selling survives in Toyama
| Placement selling | 4,362 premises |
| Placement workers | 8,302 |
| Per premises | 1.90 |
Placement selling leaves medicines with the household and collects payment later for what was used.
By count the order is Osaka 206, Tokyo 183 and Saitama 173; even the leader holds only 4.7% of the national total, so it is not concentrated.
Per head, however, the picture is clear.
| Placement selling per 100,000 residents | Highest | Lowest |
|---|---|---|
| Toyama 11.2 / Wakayama 10.8 / Saga 9.3 | Okinawa 1.7 / Kanagawa 1.4 / Tokyo 1.3 |
Toyama leads. That Toyama was the centre of the placement-medicine trade is widely known; it still shows up as first place in notifications per head.
3-6 Inspection rates differ 22.1-fold
| Premises inspected (during the year) | 193,543 |
| Against the total | 27.7% |
About twice the 14.4% for specified buildings in I012.
| Inspection rate | Highest | Lowest |
|---|---|---|
| Nagano 91.6% / Shizuoka 65.8% / Mie 45.9% | Aomori 10.4% / Saga 4.8% / Nara 4.1% |
A 22.1-fold spread. Under the same statute, one prefecture visits nine in ten premises in a year and another four in a hundred. This paper does not establish why.
3-7 By prefecture
| Total per 100,000 residents (national 564, median 563) | Highest | Lowest |
|---|---|---|
| Shimane 697 / Tochigi 695 / Hiroshima 694 | Yamaguchi 458 / Kanagawa 445 / Okinawa 408 |
A 1.71-fold spread. The correlation with ageing is essentially zero (r = +0.019).
| Share that are medical devices (national 79.6%) | Highest | Lowest |
|---|---|---|
| Aichi 84.5% / Tochigi 84.3% / Hiroshima 83.3% | Wakayama 71.8% / Yamaguchi 71.6% / Toyama 67.3% |
The correlation with ageing is r = −0.387 and with log population r = +0.443: the more populous the prefecture, the higher the medical-device share.
Toyama's share is the lowest, presumably because its medicines side (including placement selling) is comparatively thick.
3-8 Hokkaido and the Kushiro Subprefecture
Hokkaido's total is 30,845, or 617 per 100,000 residents, 9th of 47, above the national 564.
Medical devices are 25,401 (82.4%, 6th), higher than the national share, and pharmacies 2,342 (7.6%), lower than the national 9.1%.
Its inspection rate is 11.7%, 43rd — less than half the national 27.7%.
For the Kushiro Subprefecture only Economic Census subcategory 603 is available (not the same thing as a pharmacy).
| Municipality | Population | 603 establishments | Per 100,000 |
|---|---|---|---|
| Kushiro City | 151,566 | 110 | 72.6 |
| Kushiro Town | 18,021 | 12 | 66.6 |
| Akkeshi | 7,976 | 5 | 62.7 |
| Hamanaka | 5,172 | 2 | 38.7 |
| Shibecha | 6,698 | 5 | 74.6 |
| Teshikaga | 6,327 | 7 | 110.6 |
| Tsurui | 2,368 | 0 | 0.0 |
| Shiranuka | 6,840 | 5 | 73.1 |
As in I007, Tsurui has none.
4. Discussion
4-1 What the "pharmaceutical" count contains
There are 697,897 licences, registrations and notifications under the Act. Pharmacies are 9.1% of them; medical devices 79.6%.
Within medical devices, retail of controlled devices alone is nearly half the total (49.2%). That is the notification of shops selling thermometers and blood-pressure monitors, not a count of specialist device firms.
It is the shape of I009's public bathhouses (2,730 neighbourhood baths within 23,668) and I011's notified food businesses (174,742 vending machines within 865,122). Reading a regulatory count as an industry count goes badly wrong.
4-2 Choose the matching category and they match
In I007, 63,203 pharmacies against 603's 90,344 gave 0.70 and did not agree. Adding 29,535 shop-based retailers here gives 1.03.
In I009, the public bathhouse total differed 10.34-fold but the neighbourhood baths only 1.19-fold.
When statistics disagree, the categories being compared differ. Which categories to add, however, cannot be known without reading both definitions and counting.
4-3 One shop holds several
The 697,897 is not a count of shops. A single shop may hold a pharmacy licence, a notification for retail of controlled devices and a licence for highly controlled devices at the same time.
The figure is therefore closer to a count of licences, registrations and notifications. This paper has not measured the overlap.
It is the pattern of I011's department stores (about thirty notifications per store).
4-4 Enforcement differs 22.1-fold by prefecture
Inspection rates are 91.6% in Nagano and 4.1% in Nara.
Under the same statute, one prefecture covers nine-tenths of premises in a year and another one twenty-fifth. For a business, the regulation actually experienced differs by prefecture.
Inspections of specified buildings in I012 stood at 14.4% nationally. Both across regimes and across prefectures, the density of oversight varies widely.
This paper does not establish why, and differences in how inspections are defined or recorded are among the possibilities.
4-5 Where placement selling remains
Placement selling runs from 11.2 per 100,000 residents in Toyama to 1.3 in Tokyo, a difference of 8.6-fold.
The trade dates from the Edo period, and Toyama's place at its centre is widely known. That trace still appears in today's notification counts.
Like the itinerant selling of I011 (21.0% in Miyazaki), an old form of trade remains concentrated in one prefecture. This paper has not examined the historical record.
5. Limitations
- The Report is as of end-FY2024, the Census as of 1 June 2021, population as of 1 January 2026: the dates differ
- Retail and rental of general medical devices and some other cells are marked "·" and are not in the total
- One shop may hold several licences, registrations and notifications. The 697,897 is not a count of shops but closer to a count of authorisations
- The overlap has not been measured here
- Placement workers are persons, not premises
- Economic Census subcategory 603 includes drugstores and cosmetics retailers and is not the same thing as a pharmacy
- Why inspection rates differ 22.1-fold by prefecture is not established (differences in definition or recording are among the possibilities)
- The historical record behind Toyama's placement selling has not been examined
- The Report has no municipal breakdown; Kushiro figures are from the Census only
- Revenue and volumes handled are not examined
6. Reproduction
- From e-Stat, obtain the Report on Public Health Administration, FY2024, Pharmaceutical Affairs Table 2 (CSV)
- Confirm that the 47 prefecture rows sum to the national row and that the six categories (medicines, quasi-drugs, cosmetics, medical devices, in-vitro diagnostics, regenerative medicine products) sum to the total (697,897)
- The "licensed, registered and notified premises" columns run every second column within each category; retail of controlled medical devices is column 69
- From e-Stat, obtain establishments by industrial subcategory from the 2021 Economic Census and use the national row for 603
- Sum Basic Resident Register population and population aged 65+ by prefecture
- Compute the ratio of pharmacies plus shop-based retail to 603, placement selling per 100,000 residents, and inspection rates
All values are the output of a single script (kensan_202). No intermediate value was transcribed by hand.
Scope of this paper
No new theory is claimed. This paper opens the count of authorisations under the Pharmaceuticals and Medical Devices Act by category, shows what share are pharmacies, and looks for the category that matches the Economic Census. It continues I007. It shows that the total is closer to a count of authorisations than of shops, and that inspection rates differ 22.1-fold by prefecture. The extent of overlap, the reason for the difference in inspection rates, and the history behind Toyama's placement selling are not established.
References and data sources
- MHLW, Report on Public Health Administration, FY2024, Pharmaceutical Affairs Table 2.
- Statistics Bureau of Japan and METI, 2021 Economic Census for Business Activity.
- MIC, Population Based on the Basic Resident Register, 1 January 2026.
- Y. Yamagishi, "140 Towns and Villages Have No Pharmacy" (I007). Zenodo. https://doi.org/10.5281/zenodo.22876130
- Y. Yamagishi, "Of 23,668 'Public Bathhouses,' 2,730 Are Neighbourhood Baths" (I009).
- Y. Yamagishi, "865,122 Notified Food Businesses" (I011). Zenodo. https://doi.org/10.5281/zenodo.22876599
- Y. Yamagishi, "17,842 Registered Businesses Maintain 48,608 Specified Buildings" (I012). Zenodo. https://doi.org/10.5281/zenodo.22877101
Version history
| Version | Date | Change |
|---|---|---|
| 1 | 2026-09-21 | First release |
How to cite
Yamagishi, Y. (2026). Pharmacies Are 9.1% of 697,897 Pharmaceutical-Related Businesses — Half Retail Controlled Medical Devices [I013]. Zenodo. https://doi.org/10.5281/zenodo.22877276
(This DOI is the concept DOI; it always resolves to the latest version. Cite this one.)
© 2026 Yuuki YAMAGISHI
This work is licensed under a Creative Commons Attribution 4.0 International License (CC BY 4.0).
You may copy, adapt, redistribute and use it commercially, provided you give appropriate credit.
creativecommons.org/licenses/by/4.0
All figures and values in this paper were computed from official statistics. Rights in the underlying data remain with the publishing agencies.
Reference
Yamagishi, Y. (2026). Pharmacies Are 9.1% of 697,897 Pharmaceutical-Related Businesses [I013]. Zenodo.
DOI: 10.5281/zenodo.22877276
YOI: https://www.yamagishiyuuki.com/yoi/I013
ORCID: 0009-0006-8587-3450
PDF (English) · PDF (Japanese) · Date proof of the English PDF (OpenTimestamps .ots) · SHA256SUMS
The record page for this paper (in Japanese, with the PDFs in each language and the date proof): YOI I013. This paper is a preprint and has not been peer reviewed.