Abstract
I counted specified buildings under the Building Sanitation Act (offices, stores and the like of at least 3,000 m² total floor area) and the registered businesses that maintain them, from the Report on Public Health Administration (FY2024, MHLW, Environmental Health Tables 3-1 and 4), and read them against population and the Economic Census.
There are 48,608 specified buildings. A supervising engineer is appointed for 48,438 (99.65%), leaving 170 without one. On-site inspections number 6,997 a year (14.4%) — a pace that visits each building about once in seven years.
Registered businesses number 17,842, and the eight categories reconcile exactly to the total. The largest is water-tank cleaning at 6,435 (36.1%), the smallest air-duct cleaning at 111 (0.6%), a 58.0-fold difference.
Each registered business corresponds to 2.72 specified buildings. The Economic Census counts 27,977 establishments in building services (922), so registered businesses are only 0.64 times that.
Against 2,987 registrations came 239 withdrawals and 2,723 expiries — a ratio of 1.01, essentially flat.
Specified buildings per 100,000 residents run Tokyo 60.3, Ishikawa 53.3, Hokkaido 51.2 down to Saitama 20.3, a 2.97-fold spread. They are almost unrelated to population size (r = +0.013).
1. Introduction
I006 (lodging), I008 (dry cleaning), I009 (public bathhouses) and I011 (notified food businesses) all faced customers directly.
Building maintenance does not. Its counterpart is a building, and the company that owns it. And the Building Sanitation Act imposes management duties only on buildings above a certain size.
How many buildings are required to be managed, and how many registered businesses manage them?
2. Data
| Specified buildings | MHLW, Report on Public Health Administration, FY2024, Environmental Health Table 3-1: specified buildings, buildings with a supervising engineer appointed, and inspections (end of FY2024; inspections during the year) |
| Registered businesses | Same report, Table 4: registered building-hygiene businesses, with registrations, withdrawals, revocations and expiries (same) |
| Economic Census | 2021 Economic Census, subcategory 922 building services (1 June 2021, national row) |
| Population and age 65+ | MIC, Basic Resident Register population, 1 January 2026 |
All 47 prefectures are present and their sums match the national rows (48,608 specified buildings; 17,842 registered businesses). The eight categories also reconcile exactly to the total (difference 0).
A specified building is used as a theatre, department store, assembly hall, library, museum, store, office, school and so on, with a total floor area of at least 3,000 m² (8,000 m² for schools).
The Report has no municipal breakdown (prefectures, designated cities and core cities only). The unit here is the prefecture.
3. Results
3-1 48,608 buildings, 99.65% with an engineer
| Buildings | ||
|---|---|---|
| Specified buildings | 48,608 | |
| With a supervising engineer | 48,438 | 99.65% |
| Without one | 170 | 0.35% |
99.65% is the highest compliance figure seen in this series.
| Count during the year | Against specified buildings | |
|---|---|---|
| On-site inspections | 6,997 | 14.4% |
| Requests for report | 21,355 | 43.9% |
Inspections cover 14.4% a year. At that pace, each building is visited about once in seven years.
3-2 Inside the 17,842 — a third clean water tanks
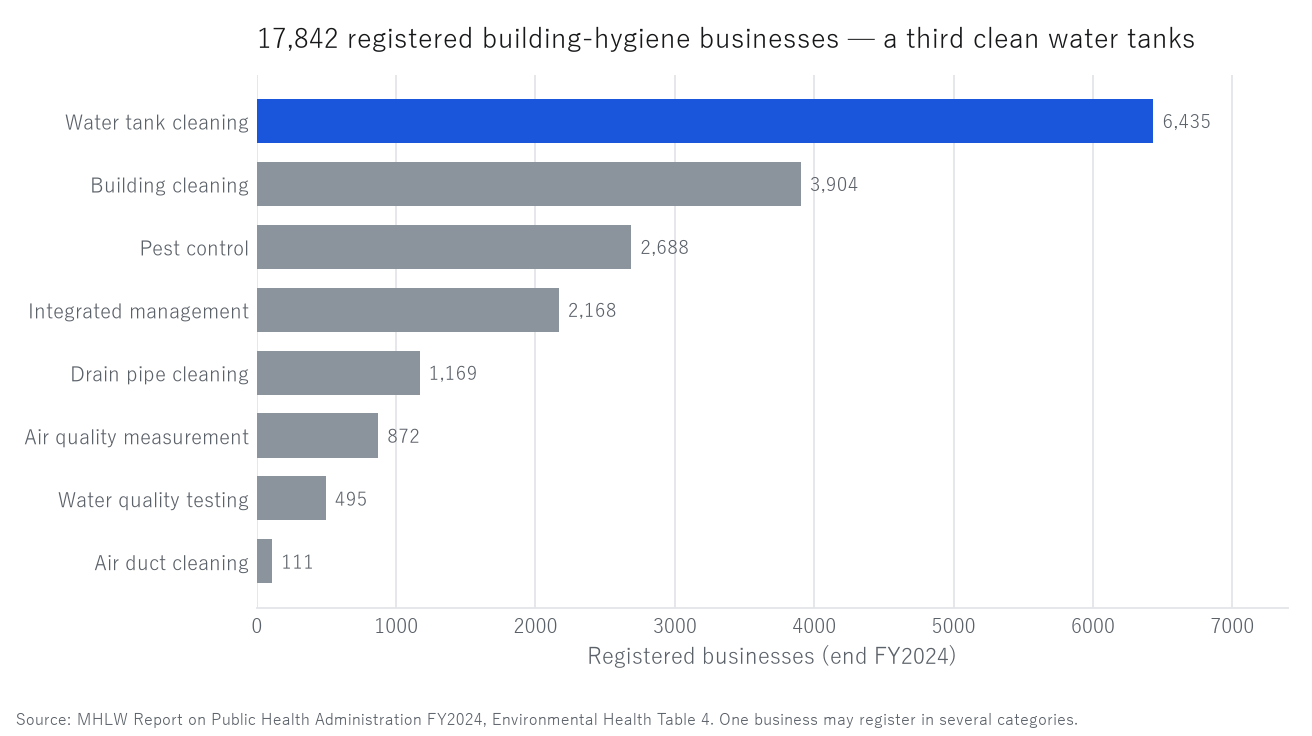
Figure 1. Registered building-hygiene businesses (end of FY2024, eight categories).
Blue is water-tank cleaning; grey is everything else.
| Category | Registered | Share |
|---|---|---|
| Drinking-water tank cleaning | 6,435 | 36.1% |
| Building cleaning | 3,904 | 21.9% |
| Rodent and insect control | 2,688 | 15.1% |
| Integrated environmental-hygiene management | 2,168 | 12.2% |
| Drain-pipe cleaning | 1,169 | 6.6% |
| Air-quality measurement | 872 | 4.9% |
| Drinking-water quality testing | 495 | 2.8% |
| Air-duct cleaning | 111 | 0.6% |
| Total | 17,842 |
The spread is 58.0-fold.
"Building maintenance" brings cleaning to mind, but the largest category by registration is water-tank cleaning. There are only 111 air-duct cleaning businesses in the country.
One business may register in several categories, so this is not a count of operators.
3-3 Registrations are flat
| Count during the year | |
|---|---|
| Registrations | 2,987 |
| Withdrawals | 239 |
| Expiries | 2,723 |
| Registrations ÷ (withdrawals + expiries) | 1.01 |
A registration is valid for six years. Expiries include those simply not renewed.
Entries and exits are almost in balance — unlike the lodgings of I006 (2.74, increasing) or the public bathhouses of I009 (0.98, declining).
3-4 2.72 buildings per registered business
| Count | |
|---|---|
| Specified buildings | 48,608 |
| Registered businesses | 17,842 |
| Per registered business | 2.72 |
Set against the Economic Census, the direction reverses.
| Establishments | ||
|---|---|---|
| Economic Census 922 building services | 27,977 | |
| Registered businesses ÷ 922 | 0.64× | |
| Specified buildings per 922 establishment | 1.74 |
There are fewer registered businesses than establishments — the reverse of I006 through I011.
The reason is presumably that subcategory 922 includes work that requires no registration. Registration under the Building Sanitation Act is needed to work on specified buildings; cleaning an apartment block or a small office building needs none.
Against the "more premises" pattern seen so far, here there are more establishments. The composition of that difference is not examined here.
3-5 By prefecture
| Specified buildings per 100,000 residents (national 39.3, median 37.0) | Highest | Lowest |
|---|---|---|
| Tokyo 60.3 / Ishikawa 53.3 / Hokkaido 51.2 | Chiba 27.0 / Nara 26.3 / Saitama 20.3 |
A 2.97-fold spread.
Population size is almost unrelated (r = +0.013 against log population), as is ageing (r = +0.043).
Tokyo leading is unsurprising, but second is Ishikawa and third Hokkaido, while Saitama, Chiba and Nara sit at the bottom. The prefectures surrounding the large cities have the fewest large buildings.
| Registered businesses per 100,000 residents (national 14.4) | Highest | Lowest |
|---|---|---|
| Aomori 24.5 / Ishikawa 24.2 / Oita 20.5 | Gunma 10.2 / Hyogo 9.8 / Saitama 9.7 |
| Specified buildings per registered business (national 2.72, median 2.45) | Highest | Lowest |
|---|---|---|
| Tokyo 3.88 / Nagano 3.47 / Hyogo 3.39 | Tokushima 1.63 / Kagoshima 1.58 / Miyazaki 1.58 |
A 2.5-fold spread. Specified buildings and registered businesses per 100,000 residents correlate at r = +0.425, moderately.
3-6 Hokkaido and the Kushiro Subprefecture
Hokkaido has 2,559 specified buildings, 51.2 per 100,000 residents, 3rd of 47, well above the national 39.3.
It has 993 registered businesses (19.9 per 100,000, 7th) and 2.58 buildings each (20th), including 256 in water-tank cleaning and 335 in building cleaning.
Hokkaido has many large buildings, and many businesses to look after them.
For the Kushiro Subprefecture only Economic Census subcategory 922 is available.
| Municipality | Population | 922 establishments | Per 100,000 |
|---|---|---|---|
| Kushiro City | 151,566 | 48 | 31.7 |
| Kushiro Town | 18,021 | 7 | 38.8 |
| Akkeshi | 7,976 | 1 | 12.5 |
| Hamanaka | 5,172 | 0 | 0.0 |
| Shibecha | 6,698 | 1 | 14.9 |
| Teshikaga | 6,327 | 1 | 15.8 |
| Tsurui | 2,368 | 0 | 0.0 |
| Shiranuka | 6,840 | 0 | 0.0 |
The national median across 1,889 municipalities is 13.8. Kushiro City (31.7) and Kushiro Town (38.8) are more than twice that. Nationwide, 407 municipalities have zero in 922.
4. Discussion
4-1 A regime drawn by size
The Building Sanitation Act cuts its scope at 3,000 m² of total floor area. Only buildings above that line become specified buildings, with a supervising engineer and periodic measurement required.
Above the line, compliance is 99.65%. Where the line is drawn, it is observed.
But how many buildings lie below it cannot be told from this statistic. A regime sees only where it has drawn its line.
I007's "140 towns and villages with no pharmacy" was a case of the administration counting absence directly. This is the reverse: what lies outside the scope is not counted at all.
4-2 Building maintenance is about water, not cleaning
36.1% of registered businesses clean water tanks — more than the 21.9% that clean buildings.
This likely reflects whether registration is required for a given kind of work. Water-tank cleaning needs specialist qualifications and equipment and is readily contracted out; ordinary daily cleaning can be done without registration.
"Building maintenance" cannot be treated as one thing. The eight categories differ 58.0-fold and are separate trades.
4-3 The first case with more establishments than premises
The simple lodgings of I006 (13.75×), the crematoria of I010 and the department stores of I011 (29.6×) all gave more premises than establishments.
Here it is reversed: 17,842 registered businesses against 27,977 establishments in 922, 0.64 times.
The difference is work for which registration is optional. Registration under the Building Sanitation Act is required for certain work on specified buildings and for nothing else.
This is a fourth pattern of disagreement: the regime's scope is narrower than the industrial classification.
4-4 Few large buildings around the big cities
Specified buildings per 100,000 residents differ nearly threefold between Tokyo (60.3) and Saitama (20.3), yet correlate with population size at almost zero (r = +0.013).
The top three are Tokyo, Ishikawa and Hokkaido; the bottom three Saitama, Nara and Chiba. Populous prefectures do not lead.
Large buildings serve as offices, stores and hotels. They stand where people come to work, not where people live. This paper does not use daytime population, so that is an explanation, not a test.
5. Limitations
- The Report covers FY2024, the Census 1 June 2021, population 1 January 2026: the dates differ
- A specified building is one of at least 3,000 m² (8,000 m² for schools); this is not a count of buildings
- One business may register in several categories, so the count is not a count of operators
- Registration is not universally required. Work on buildings other than specified buildings needs none
- Economic Census subcategory 922 includes work requiring no registration
- Expiries may include both renewed and non-renewed registrations
- The Report has no municipal breakdown; Kushiro figures are from the Census only
- Revenue, contract counts and building floor area are not examined
- No test using daytime population was made of why large buildings are scarce around the big cities
6. Reproduction
- From e-Stat, obtain the Report on Public Health Administration, FY2024, Environmental Health Table 3-1 (specified buildings) and Table 4 (registered businesses). Both contain re-tabulated rows for designated and core cities; use only the prefecture rows
- Confirm that the 47 prefecture rows sum to the national rows and that the eight categories sum to the total (48,608; 17,842)
- Table 4 has thirteen columns per category; "registered businesses (end of year)" sits at columns 1, 14, 27, 40, 53, 66, 79, 92 and 105
- From e-Stat, obtain establishments by industrial subcategory from the 2021 Economic Census and use the national row for 922
- Sum Basic Resident Register population and population aged 65+ by prefecture
- Compute the appointment rate, specified buildings per registered business, and counts per 100,000 residents
All values are the output of a single script (kensan_201). No intermediate value was transcribed by hand.
Scope of this paper
No new theory is claimed. This paper sets the number of buildings covered by the Building Sanitation Act beside the number of businesses registered to maintain them. It shows that the eight registration categories differ 58.0-fold, that registered businesses are fewer than Economic Census establishments, and that specified buildings per head are unrelated to population size. How many buildings lie outside the regime's scope cannot be told from this statistic.
References and data sources
- MHLW, Report on Public Health Administration, FY2024, Environmental Health Tables 3-1 and 4.
- Statistics Bureau of Japan and METI, 2021 Economic Census for Business Activity.
- MIC, Population Based on the Basic Resident Register, 1 January 2026.
- Y. Yamagishi, "The Number of Inns Differs 13.7-Fold Between Statistics" (I006). Zenodo. https://doi.org/10.5281/zenodo.22876047
- Y. Yamagishi, "140 Towns and Villages Have No Pharmacy" (I007). Zenodo. https://doi.org/10.5281/zenodo.22876130
- Y. Yamagishi, "Of 23,668 'Public Bathhouses,' 2,730 Are Neighbourhood Baths" (I009).
- Y. Yamagishi, "865,122 Notified Food Businesses" (I011). Zenodo. https://doi.org/10.5281/zenodo.22876599
Version history
| Version | Date | Change |
|---|---|---|
| 1 | 2026-09-21 | First release |
How to cite
Yamagishi, Y. (2026). 17,842 Registered Businesses Maintain 48,608 Specified Buildings — a Third of Them Clean Water Tanks [I012]. Zenodo. https://doi.org/10.5281/zenodo.22877101
(This DOI is the concept DOI; it always resolves to the latest version. Cite this one.)
© 2026 Yuuki YAMAGISHI
This work is licensed under a Creative Commons Attribution 4.0 International License (CC BY 4.0).
You may copy, adapt, redistribute and use it commercially, provided you give appropriate credit.
creativecommons.org/licenses/by/4.0
All figures and values in this paper were computed from official statistics. Rights in the underlying data remain with the publishing agencies.
Reference
Yamagishi, Y. (2026). 17,842 Registered Businesses Maintain 48,608 Specified Buildings [I012]. Zenodo.
DOI: 10.5281/zenodo.22877101
YOI: https://www.yamagishiyuuki.com/yoi/I012
ORCID: 0009-0006-8587-3450
PDF (English) · PDF (Japanese) · Date proof of the English PDF (OpenTimestamps .ots) · SHA256SUMS
The record page for this paper (in Japanese, with the PDFs in each language and the date proof): YOI I012. This paper is a preprint and has not been peer reviewed.