Abstract
From Table 5 of the Report on Public Health Administration (FY2024) I counted cemeteries, crematoria and ossuaries by type of operator, and matched them against the cremations counted in I010.
There are 876,042 cemetery areas, 3,511 crematoria and 13,853 ossuaries.
Of the 3,511 crematoria, 1,349 (38.4%) were operated within the past year. The other 2,162 (61.6%) were not used at all.
But that is the national average, and the reality is split in two. Seventeen prefectures are at 100%, while Fukui uses 14 of its 557 (2.5%), Ishikawa 13 of 437 (3.0%) and Mie 28 of 640 (4.4%). The median is 94.7%.
82.4% of cemeteries (721,647 areas) are operated by individuals. Local governments account for 3.4% and religious corporations for 6.7%.
Conversely, 97.5% of the crematoria in regular use are operated by local governments. 73.9% of ossuaries are run by religious corporations.
Dividing 1,674,137 cremations by 1,349 crematoria in regular use gives 1,241 a year per facility, or 3.4 a day.
Hokkaido has 2,002 cemetery areas and 1,846 ossuaries — almost the same number. Ossuaries divided by cemeteries is 0.922 there against 0.0158 nationally, a factor of 58.3. Only 1.5% of its cemeteries are operated by individuals, the lowest of the 47 prefectures.
1. Introduction
I010 counted 383 burials, 1,674,137 cremations and 176,105 reinterments. Those were events, not places.
Table 5 counts the places where burial and cremation happen.
How many cemeteries, crematoria and ossuaries does Japan have? Who operates them? And how many are actually in use?
2. Data
| Cemeteries, crematoria, ossuaries | MHLW, Report on Public Health Administration, FY2024, Table 5 (Environmental Health). As at end of FY2024. Operators: local government, public-interest corporation, religious corporation, individual, other |
| Cremations | Same source, Table 6 (counted in I010) |
| Establishments and workers | MIC and METI, Economic Census 2021, 795 Crematory and cemetery management / 796 Ceremonial occasion services |
| Population and ageing rate | MIC, Basic Resident Register, 1 January 2026 |
All 47 prefectures are present, and all four counts reconcile exactly with the national row (876,042 cemeteries, 3,511 crematoria, 1,349 in regular use, 13,853 ossuaries; all differences zero).
"Crematoria in regular use" means those with a record of operation within the past year (Table 5, note 1).
Cemeteries are counted in "areas", not facilities.
3. Results
3-1 876,042 cemeteries, 3,511 crematoria, 13,853 ossuaries
| Count | ||
|---|---|---|
| Cemeteries | 876,042 | areas |
| Crematoria | 3,511 | facilities |
| of which in regular use | 1,349 | facilities (38.4% of crematoria) |
| Ossuaries | 13,853 | facilities |
Cemeteries outnumber crematoria 250 to 1, and crematoria in regular use 649 to 1.
3-2 82.4% of cemeteries are operated by individuals
| Operator of the 876,042 cemetery areas | Areas | Share |
|---|---|---|
| Individual | 721,647 | 82.4% |
| Other | 65,234 | 7.4% |
| Religious corporation | 58,700 | 6.7% |
| Local government | 30,024 | 3.4% |
| Public-interest corporation | 437 | 0.0% |
Eight in ten of Japan's cemeteries are operated by individuals.
Crematoria and ossuaries look entirely different.
| Local government | Public-interest | Religious | Other | |
|---|---|---|---|---|
| Crematoria 3,511 | 1,832 (52.2%) | 6 (0.2%) | 29 (0.8%) | 1,644 (46.8%) |
| In regular use 1,349 | 1,315 (97.5%) | 2 (0.1%) | 4 (0.3%) | 28 (2.1%) |
| Ossuaries 13,853 | 760 (5.5%) | 115 (0.8%) | 10,244 (73.9%) | 2,734 (19.7%) |
97.5% of the crematoria actually operating are run by local governments. Privately operated crematoria are almost all idle.
73.9% of ossuaries are run by religious corporations.
3-3 The share in use is split in two
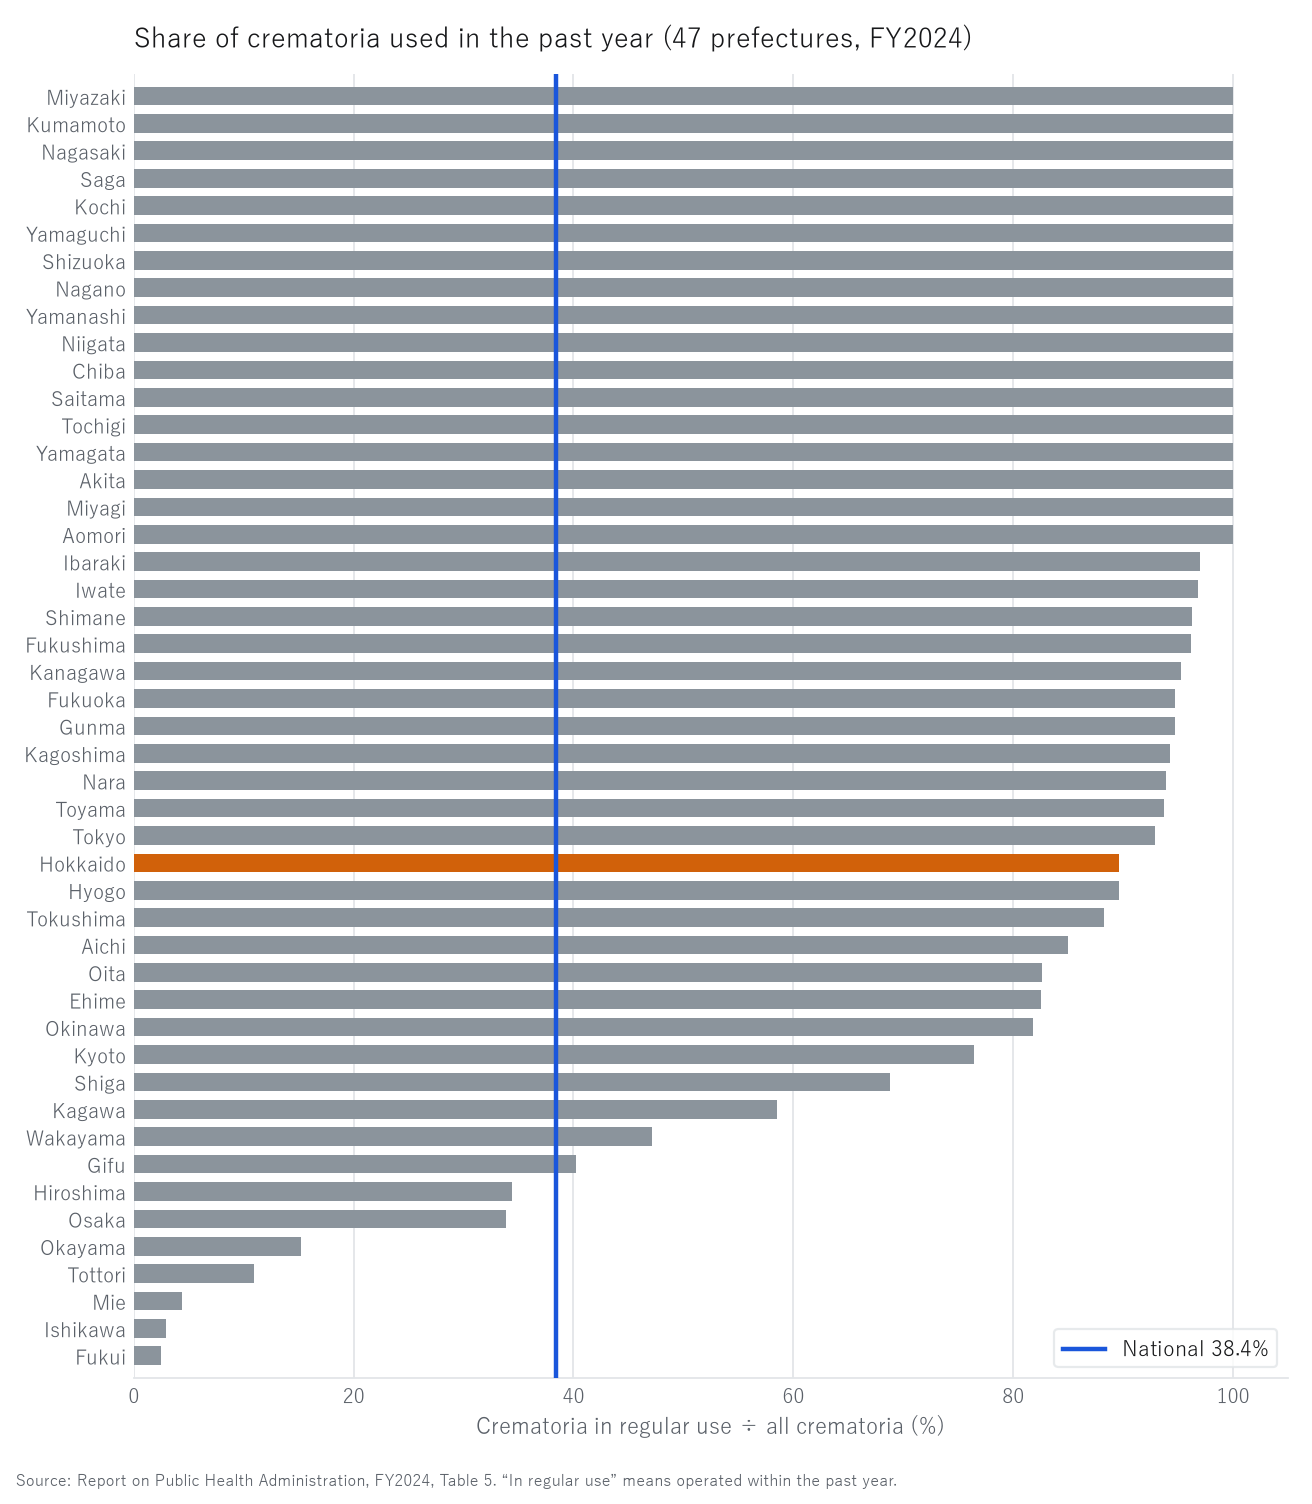
Figure 1. Share of crematoria used in the past year, 47 prefectures (FY2024).
Grey is prefectures, orange is Hokkaido, the blue vertical line is the national 38.4%.
| National | 38.4% (1,349 / 3,511) |
| Median | 94.7% |
| Prefectures at 100% | 17 of 47 |
| High | Aomori 100.0% (36/36) / Miyagi 100.0% (27/27) / Akita 100.0% (25/25) |
| Low | Mie 4.4% (28/640) / Ishikawa 3.0% (13/437) / Fukui 2.5% (14/557) |
| Top ÷ bottom | 39.8 |
The national 38.4% does not describe the situation. Seventeen of the 47 prefectures are at 100% and the median is 94.7%.
The average is pulled down by a handful of prefectures holding hundreds of unused crematoria — Fukui 557, Ishikawa 437, Mie 640.
| Correlation (47 prefectures) | r |
|---|---|
| Share in use × population (log) | +0.135 |
| Share in use × ageing rate | +0.146 |
The share in use relates to neither population nor ageing.
3-4 3.4 cremations a day per facility
| 1,674,137 cremations ÷ 1,349 crematoria in regular use | 1,241 a year |
| Per day (dividing by 365) | 3.4 |
| Dividing by all 3,511 crematoria | 477 a year |
| Cremations per facility | |
|---|---|
| High | Tokyo 5,576 / Kanagawa 5,258 / Saitama 4,031 |
| Low | Hokkaido 505 / Gifu 437 / Shimane 415 |
| Top ÷ bottom | 13.4, median 916 |
| Correlation with population (log) | r = +0.765 |
The more urban the prefecture, the more cremations per facility. Per day, Tokyo is 15.3 and Shimane 1.1.
3-5 Per 100,000 population
| National | High | Low | Top ÷ bottom | Median | |
|---|---|---|---|---|---|
| Cemeteries (areas) | 707.8 | Shimane 15,270 / Okayama 5,960 / Nagano 4,201 | Tokyo 67.1 / Hokkaido 40.1 / Osaka 36.0 | 424 | 511 |
| Ossuaries (facilities) | 11.2 | Saga 77.4 / Kumamoto 66.8 / Kagoshima 60.5 | Chiba 2.0 / Saitama 1.9 / Kanagawa 1.6 | 48 | 6.8 |
Shimane has 15,270 cemetery areas per 100,000 people, 424 times Osaka's 36.0.
| Share of cemeteries operated by individuals | |
|---|---|
| National | 82.4% |
| High | Okinawa 99.2% / Shimane 98.7% / Nagano 97.2% |
| Low | Kagoshima 22.2% / Miyazaki 17.7% / Hokkaido 1.5% |
| Median | 68.2% |
3-6 Against the Economic Census
| Establishments | Workers | Per establishment | Municipalities present | |
|---|---|---|---|---|
| 795 Crematory and cemetery management | 1,580 | 9,217 | 5.83 | 769 |
| 796 Ceremonial occasion services | 12,587 | 142,531 | 11.32 | 1,532 |
| Comparison | Ratio |
|---|---|
| Crematoria 3,511 + ossuaries 13,853 = 17,364 against 795's 1,580 | 10.99 |
| In regular use 1,349 + ossuaries 13,853 = 15,202 against 1,580 | 9.62 |
| Adding the 876,042 cemeteries | 565 |
Cemeteries are not counted as establishments at all — 795's 1,580 establishments are 0.18% of the cemetery count. And 52.2% of crematoria are run by local governments, which are not Economic Census establishments.
3-7 Hokkaido and the Kushiro Subprefecture
| Hokkaido | |
|---|---|
| Cemeteries | 2,002 areas |
| Crematoria | 173 (155 in regular use, 89.6%) |
| Ossuaries | 1,846 (13.3% of the national 13,853, 6th of 47) |
| Ossuaries ÷ cemeteries | 0.922 (58.3 times the national 0.0158) |
| Cemetery operators | local government 1,504 (75.1%) / religious 418 (20.9%) / individual 31 (1.5%, 47th of 47) |
| Cremations per facility | 78,350 ÷ 155 = 505 a year (45th of 47; national 1,241) |
| Per 100,000 population | cemeteries 40.1 (46th) / ossuaries 36.9 (6th) |
Hokkaido has 2,002 cemeteries and 1,846 ossuaries — almost the same number. Nationally, ossuaries are 1.6% of the cemetery count.
Three quarters of Hokkaido's cemeteries are operated by local government and only 1.5% by individuals — the reverse of the national pattern.
Kushiro Subprefecture (Economic Census 2021, as counted in I010):
| Municipality | 795 Crematory/cemetery management | 796 Ceremonial occasion services |
|---|---|---|
| Kushiro City | 1 | 22 |
| Kushiro Town | 0 | 1 |
| Akkeshi | 0 | 1 |
| Hamanaka | 1 | 0 |
| Shibecha | 0 | 2 |
| Teshikaga | 0 | 2 |
| Tsurui | 1 | 1 |
| Shiranuka | 0 | 3 |
| Total | 3 | 32 |
4. Discussion
4-1 When the average does not describe the situation
The national share in use is 38.4%, but the median is 94.7% and 17 prefectures are at 100%. These two numbers paint entirely different pictures.
Read 38.4% alone and you get "six in ten of Japan's crematoria are unused." Read the median of 94.7% and you get "in most prefectures the crematoria are used." Both are true.
What is happening is that a handful of prefectures register extraordinary numbers of crematoria — Fukui 557, Ishikawa 437, Mie 640 — far more than their populations would suggest.
Small old crematoria left on the register without ever being formally closed is a plausible explanation, but this table cannot confirm it. Table 5 counts whether a facility is registered, not why it remains so.
As with I009's public bathhouses (2,730 traditional among 23,668) and I012's 99.65% appointment rate, these tables keep separate counts for "what the regime holds" and "what actually operates." Table 5 is unusually helpful in stating both explicitly.
4-2 That 82.4% of cemeteries are individual
Of Japan's 876,042 cemetery areas, 721,647 are operated by individuals.
This means cemeteries are largely not a business. The Economic Census counts only 1,580 establishments in category 795, 0.18% of the cemetery count.
An individual cemetery is usually a small family or hamlet burial ground. Shimane's 15,270 areas per 100,000 and Okinawa's 99.2% individual share can be read as places where that form survives. But the size of an "area" is unknown, so the count of areas is not a count of graves or of land.
Meanwhile, 97.5% of the crematoria actually operating are local government facilities. Within the same subject — what is done with the dead — cemeteries are in private hands and cremation is in the state's.
4-3 Hokkaido alone has a different shape
Hokkaido's figures fall outside the national pattern.
| National | Hokkaido | |
|---|---|---|
| Share of cemeteries individual | 82.4% | 1.5% (47th) |
| Cemeteries per 100,000 | 707.8 | 40.1 (46th) |
| Ossuaries per 100,000 | 11.2 | 36.9 (6th) |
| Ossuaries ÷ cemeteries | 0.0158 | 0.922 (58.3×) |
Hokkaido has the second-fewest cemeteries per head in Japan and the sixth-most ossuaries. Three quarters of its cemeteries are municipal.
Candidate explanations include the history of settlement (planned villages and communal cemeteries from the Meiji period onward), snow, and the distribution of temples. These are hypotheses that this table cannot test. Table 5 records neither the date nor the circumstances of establishment.
What can be said is only that the national pattern — cemeteries belong to individuals — does not hold in Hokkaido.
4-4 What 3.4 a day means
1,674,137 cremations across 1,349 facilities in regular use is 3.4 a day each. Tokyo is 15.3; Shimane is 1.1.
Whether a municipality can keep a facility of this size on its own is a live question. By R005's calculation, the median municipal population ratio in 2050 is 0.664 (−33.6%) across 1,876 municipalities. Ageing, meanwhile, means deaths keep rising for some time.
Demand for a crematorium is set by deaths, not population. I010 found a strong correlation between the ageing rate and cremations (r = +0.936). The period of falling population and the period of rising deaths overlap.
This paper does not calculate further. What it can say is that the present figure is 3.4 a day per facility.
4-5 What the Kushiro Subprefecture shows
The subprefecture has three establishments in category 795 — one each in Kushiro City, Hamanaka and Tsurui — and 32 in 796.
The crematoria themselves belong to the municipalities, so they do not appear in the Economic Census. What appears is the private trade around them.
As I015 showed, Tsurui has one barbershop and two beauty salons. That village also has one establishment in 795. In a village of 2,368 people, a trade of that kind surviving is something population does not explain.
5. Limitations
- The health register is as at end of FY2024, the Economic Census at 1 June 2021 — three years and ten months apart
- Cemeteries are counted in "areas"; the size of an area (land, number of plots) is unknown
- "Crematoria in regular use" means those operated within the past year (Table 5, note 1)
- Cremation counts are prefectural totals, not per facility. Use across prefectural boundaries cannot be separated
- Cremations per facility is an average; the distribution across facilities is not examined
- Most crematoria are run by local governments and are not Economic Census establishments
- Cemeteries are not counted as establishments. The ratio against 795 compares different units
- The health register has no municipal table
- Why unused crematoria remain registered (closure procedure, register maintenance) is a hypothesis this table cannot test
- Why Hokkaido has so many ossuaries (settlement history, snow, temple distribution) is likewise untestable here
- A correlation indicates the strength of a relationship, not the direction of causation
6. How to reproduce
- Download Table 5 (Environmental Health, cemeteries, crematoria and ossuaries) of the FY2024 Report on Public Health Administration from e-Stat (CP932)
- Take the national row and the 47 rows from Hokkaido to Okinawa (nothing below "designated cities (regrouped)")
- Take cemeteries, crematoria, crematoria in regular use and ossuaries across the six operator columns
- Divide crematoria in regular use by all crematoria, and report the median as well as the mean
- Divide the cremations of Table 6 by the number of crematoria in regular use
- Compute per-100,000 figures and compare with Economic Census categories 795 and 796
Every figure in this paper is output by a single script (kensan_208). No intermediate value was copied by hand.
Scope of this paper
No new theory is claimed. Table 5 of the Report on Public Health Administration is counted by operator and matched against the cremations counted in I010. It shows that 1,349 of 3,511 crematoria (38.4%) are in regular use but that the median is 94.7% with 17 prefectures at 100%, that 82.4% of cemeteries are operated by individuals while 97.5% of working crematoria are municipal, and that in Hokkaido cemeteries and ossuaries are almost equal in number. Hypotheses are offered for the unused crematoria and for Hokkaido's different shape, but this table cannot test them. Correlations are reported; the direction of causation is not.
References and data sources
- Ministry of Health, Labour and Welfare, Report on Public Health Administration, FY2024, Tables 5 and 6 (Environmental Health)
- Ministry of Internal Affairs and Communications and Ministry of Economy, Trade and Industry, Economic Census 2021, Tables 9-1A and 9-1B
- Ministry of Internal Affairs and Communications, Basic Resident Register population, 1 January 2026
- Yuuki Yamagishi, "Of 23,668 'Public Bathhouses', 2,730 Are Sento" (I009)
- Yuuki Yamagishi, "383 Burials and 1,674,137 Cremations" (I010)
- Yuuki Yamagishi, "48,608 Specified Buildings Are Managed by 17,842 Registered Offices" (I012)
- Yuuki Yamagishi, "107,995 Barbershops and 277,752 Beauty Salons" (I015). Zenodo. https://doi.org/10.5281/zenodo.22878037
- Yuuki Yamagishi, "How Many People Does a Trade Run On?" (X001)
- Yuuki Yamagishi, "How Many Trades Will Leave a Town by 2050?" (R005). Zenodo. https://doi.org/10.5281/zenodo.22877595
Version history
| Version | Date | Contents |
|---|---|---|
| 1 | 2026-09-22 | First release |
How to cite
Yamagishi, Y. (2026). Of 3,511 Crematoria, 1,349 Are in Use: Fukui Has 557 and Uses 14 [I017]. Zenodo. https://doi.org/10.5281/zenodo.22879157
(This DOI is the concept DOI; it always resolves to the latest version. Cite this one.)
© 2026 Yuuki YAMAGISHI
This work is licensed under a Creative Commons Attribution 4.0 International License (CC BY 4.0).
You may copy, adapt, redistribute and use it commercially, provided you give appropriate credit.
creativecommons.org/licenses/by/4.0
All figures and values in this paper were computed from official statistics. Rights in the underlying data remain with the publishing agencies.
Reference
Yamagishi, Y. (2026). Of 3,511 Crematoria, 1,349 Are in Use: Fukui Has 557 and Uses 14 [I017]. Zenodo.
DOI: 10.5281/zenodo.22879157
YOI: https://www.yamagishiyuuki.com/yoi/I017
ORCID: 0009-0006-8587-3450
PDF (English) · PDF (Japanese) · Date proof of the English PDF (OpenTimestamps .ots) · SHA256SUMS
The record page for this paper (in Japanese, with the PDFs in each language and the date proof): YOI I017. This paper is a preprint and has not been peer reviewed.