Abstract
From Table 2 of the Report on Public Health Administration (FY2024) I counted the volume of milk processed by prefecture, by type of milk and method of pasteurisation, and matched it against the sampling tests of Table 1.
Nationally, 3,569,411 kilolitres of milk were processed, of which 3,177,500 (89.02%) was plain milk.
Hokkaido processed 609,649 kilolitres, 17.1% of the national total. Hokkaido holds 4.0% of the population, so that is 4.23 times its share.
Top to bottom the spread is 20,444-fold: 531,536 kilolitres of plain milk in Hokkaido against 26 in Fukui. The top ten prefectures account for 58.8% of the national total.
Per head, Hokkaido processes 122.0 litres a year against a national 28.8. Volume correlates with population at r = +0.572, but volume per head against population in logs at only r = +0.097. Milk is processed where it is milked, not where it is drunk.
95.36% of plain milk is flash pasteurised (ultra-high temperature). Low-temperature long-time pasteurisation accounts for 1.18%, one eighty-first of the flash total. Seven prefectures use none of it; Yamanashi uses nothing else.
Special milk amounts to 52 kilolitres nationwide. Of that, 8 kilolitres is unpasteurised, all of it in Hokkaido.
Sampling tests numbered 2,593, of which 6 failed (0.23%) — one sample per 1,377 kilolitres processed.
1. Introduction
Up to I015, what the Report on Public Health Administration let me count was numbers of premises: 107,995 barbershops, 277,752 beauty salons, 63,203 pharmacies.
Table 2 is one of the few that counts volume. Not how many establishments there are, but how many kilolitres of milk passed through them.
Where is milk processed, and is that decided by population?
2. Data
| Volume processed | MHLW, Report on Public Health Administration, FY2024, Table 2 (Milk and Meat Hygiene). By type of milk, method of processing and prefecture, during FY2024, in kilolitres |
| Sampling tests | Same source, Table 1 (sampling tests of milk). Samples taken and samples failing |
| Population | MIC, Basic Resident Register, 1 January 2026 |
All 47 prefectures are present, and the totals reconcile exactly with the national row (plain milk 3,177,500, all types 3,569,411, both differences zero).
Six types of milk are distinguished: special milk, plain milk, low-fat milk, processed milk (milk fat 3% or more), processed milk (under 3%) and other milk. Pasteurisation is split into unpasteurised, 63–65 °C (low-temperature long-time), 75 °C or above (high-temperature short-time) and flash (ultra-high temperature).
3. Results
3-1 3,569,411 kilolitres
| Type | Kilolitres | Share |
|---|---|---|
| Plain milk | 3,177,500 | 89.02% |
| Other milk | 135,602 | 3.80% |
| Low-fat milk | 107,538 | 3.01% |
| Processed milk (3% or more) | 87,061 | 2.44% |
| Processed milk (under 3%) | 61,658 | 1.73% |
| Special milk | 52 | 0.00146% |
| Total | 3,569,411 |
Nine tenths of it is plain milk.
Special milk amounts to 52 kilolitres nationwide, 0.00146% of the total, handled in just three prefectures (Fukuoka 31, Kanagawa 13, Hokkaido 8).
Of that, 8 kilolitres is unpasteurised, all of it in Hokkaido. Of the 47 prefectures, Hokkaido alone processes any unpasteurised milk.
3-2 A 20,444-fold spread
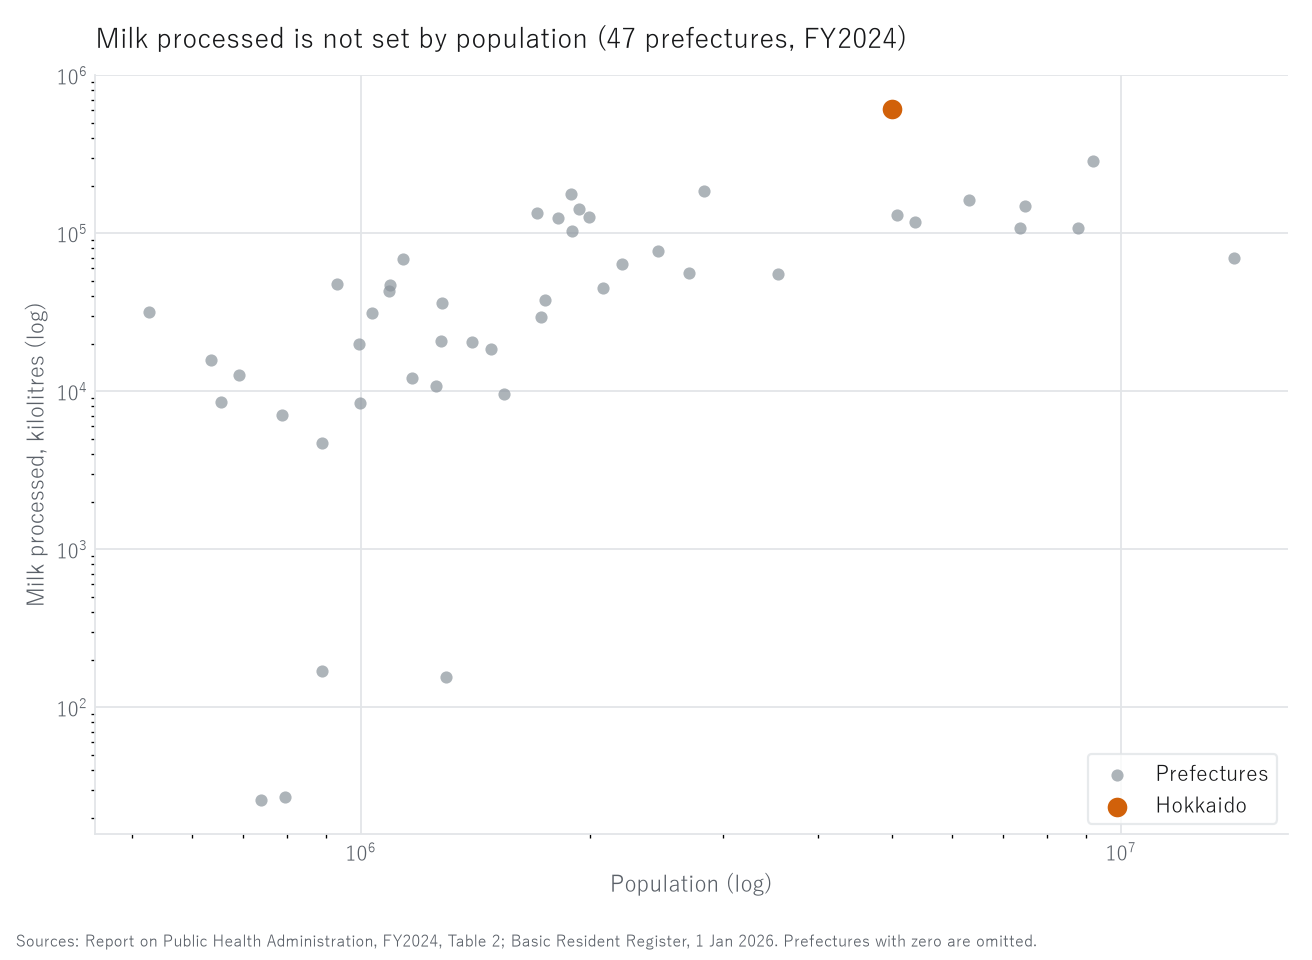
Figure 1. Milk processed against population, 47 prefectures (FY2024).
Grey is prefectures, orange is Hokkaido. Both axes are logarithmic.
| Plain milk (kilolitres) | |
|---|---|
| High | Hokkaido 531,536 (16.7%) / Kanagawa 214,363 (6.7%) / Ibaraki 174,969 (5.5%) / Chiba 161,214 (5.1%) / Tochigi 159,044 (5.0%) |
| Low | Nara 156 / Yamanashi 27 / Fukui 26 |
| Top ÷ bottom | 20,444, median 42,983 |
No prefecture processes zero. But Fukui's 26 kilolitres is one twenty-thousandth of Hokkaido's.
| Concentration | Share of national |
|---|---|
| Top 3 prefectures | 29.0% |
| Top 5 prefectures | 39.1% |
| Top 10 prefectures | 58.8% |
Low-fat milk concentrates further.
| Low-fat milk | |
|---|---|
| High | Hokkaido 50,177 (46.7%) / Tokyo 10,409 (9.7%) / Hyogo 8,023 (7.5%) |
| Prefectures at zero | 26 of 47 |
Hokkaido processes 47% of the low-fat milk, and more than half of the prefectures process none at all.
3-3 Population does not decide it
| Per head (litres per year) | |
|---|---|
| National | 28.8 |
| High | Hokkaido 122.0 / Tochigi 93.0 / Kumamoto 79.2 |
| Low | Nara 0.12 / Fukui 0.04 / Yamanashi 0.03 |
| Median | 21.7 |
| Top ÷ bottom | 3,591 |
| Correlation (47 prefectures) | r |
|---|---|
| Volume (log) × population (log) | +0.572 |
| Volume per head × population (log) | +0.097 |
Volume per head is essentially unrelated to population (r = +0.097).
Milk is processed where it is milked, not where it is drunk.
3-4 95% is flash pasteurised
| Pasteurisation (plain milk) | Kilolitres | Share |
|---|---|---|
| Flash (ultra-high temperature) | 3,029,968 | 95.36% |
| 75 °C or above (high-temperature short-time) | 110,069 | 3.46% |
| 63–65 °C (low-temperature long-time) | 37,463 | 1.18% |
Flash pasteurisation is 81 times the low-temperature long-time total.
| Share low-temperature long-time | |
|---|---|
| High | Yamanashi 100.0% / Wakayama 81.2% / Kochi 24.7% |
| Prefectures at 0% | 7 |
| National | 1.18%, median 0.31% |
All 27 kilolitres of Yamanashi's plain milk is low-temperature long-time. Small volume and choice of method go together.
3-5 2,593 samples, 6 failures
| Type | Samples | Failures | Failure rate |
|---|---|---|---|
| Plain milk | 1,275 | 4 | 0.31% |
| Raw milk | 1,201 | 0 | 0.00% |
| Other milk | 56 | 0 | 0.00% |
| Low-fat milk | 24 | 0 | 0.00% |
| Processed milk (under 3%) | 24 | 0 | 0.00% |
| Processed milk (3% or more) | 13 | 2 | 15.38% |
| Together | 2,593 | 6 | 0.23% |
Against 3,569,411 kilolitres processed, 2,593 samples is one per 1,377 kilolitres.
Only processed milk at 3% or more fat shows failures at any rate — 2 of 13. With a denominator of 13, that 15.38% moves sharply on one or two samples.
Hokkaido took 90 samples (3.5% of the national total), none of which failed.
3-6 Hokkaido
| Plain milk | 531,536 kL (16.7% of national, 1st of 47) |
| Low-fat milk | 50,177 kL (46.7% of national, 1st of 47) |
| All milk | 609,649 kL (17.1% of national, 1st of 47) |
| Population | 4,996,492 (4.0% of national) |
| Share of volume ÷ share of population | 4.23 |
| Per head | 122.0 L per year (1st of 47; national 28.8 L) |
| Special milk | 8 kL (all unpasteurised) |
| Low-temperature long-time plain milk | 5,479 kL (1.0% of its plain milk) |
Hokkaido is first on all three counts.
3-7 The Kushiro Subprefecture
The health register has no municipal table, so this comes from the Economic Census (2021).
| Municipality | Livestock farming | Workers | Livestock food manufacturing | Workers |
|---|---|---|---|---|
| Kushiro City | 17 | 161 | 6 | 133 |
| Kushiro Town | 4 | 25 | 1 | 8 |
| Akkeshi | 3 | 19 | 2 | 18 |
| Hamanaka | 15 | 86 | 6 | 181 |
| Shibecha | 31 | 261 | 3 | 111 |
| Teshikaga | 7 | 74 | 2 | 7 |
| Tsurui | 17 | 147 | 1 | 7 |
| Shiranuka | 6 | 61 | 6 | 42 |
| Subprefecture total | 100 |
The subprefecture has 100 livestock farming establishments, 1.29% of the national 7,751.
Nationally, livestock farming runs on 9.23 workers per establishment and livestock food manufacturing on 45.30 (X001). Between milking and processing, the figure differs 4.91-fold.
Shibecha has the most in the subprefecture, 31 establishments and 261 workers. Tsurui has 17 and 147.
4. Discussion
4-1 Trades set by population, and trades that are not
R001 showed that the number of industrial subcategories in a municipality is largely determined by the logarithm of its population (R² = 0.925). X001 showed that the smaller a trade is per establishment, the more municipalities it is present in.
Milk processing fits neither. Volume per head correlates with population in logs at +0.097 — essentially nothing.
I015 found barbershops in 1,862 of 1,889 municipalities and beauty salons in 1,857. Some trades are everywhere and some are almost nowhere. Milk processing is the latter: in Fukui, Yamanashi and Nara it barely happens.
The difference is set not by where the customers are but by where the input is. Hair grows everywhere; raw milk comes only from where it is milked.
4-2 How to read 20,444-fold
Hokkaido 531,536 against Fukui 26. That 20,444 is far larger than the 87.4 for land prices in X002.
| Top ÷ bottom | |
|---|---|
| Consumer prices (X002) | 1.081 |
| Minimum wage (X002) | 1.198 |
| Taxable income per taxpayer (X002) | 1.85 |
| Commercial land price (X002) | 87.4 |
| Milk processed | 20,444 |
But these are not the same kind of number. Wages and prices are "how much per unit"; volume processed is "how much in total". Dividing by population still leaves 3,591-fold, but a distribution of quantities and a distribution of prices are different things to compare.
What can be said is that the siting of an industry is far more uneven than its prices.
4-3 That 95% is flash pasteurised
95.36% of plain milk is flash pasteurised; low-temperature long-time accounts for 1.18%.
This is a choice of process, not a ranking of quality. Flash pasteurisation handles large volumes quickly and keeps longer. Low-temperature long-time takes time.
What is worth noting is that the high shares of low-temperature long-time are in the low-volume prefectures. Yamanashi is 100% on 27 kilolitres, Wakayama 81.2%; Hokkaido is 1.0%.
The direction is that smaller plants choose low-temperature long-time and larger ones choose flash. But this only compares volume with share at prefecture level; the choice made by individual plants is not observed.
4-4 Eight kilolitres of special milk
Unpasteurised special milk amounts to 8 kilolitres nationwide, all of it in Hokkaido.
Eight out of 3,569,411 — 0.00022% of the total.
Special milk requires its own licence and its facilities face stricter conditions. It is a regime that permits something almost nobody does.
The same shape recurs in these tables: I009's public bathhouses (2,730 traditional among 23,668), I011's itinerant food trade (2,187 of 10,408 in Miyazaki alone). Regimes that exist nationwide but operate in only a few prefectures.
4-5 Milking and processing
The Kushiro Subprefecture has 100 livestock farming establishments. Nationally, livestock farming averages 9.23 workers per establishment and livestock food manufacturing 45.30 (X001) — a 4.91-fold difference.
As I015 showed, Tsurui's one barbershop has one worker. The same village has 17 livestock farming establishments with 147 workers.
By headcount, Tsurui is not a barbering village but a livestock village. But livestock farming does not deal with consumers directly, so it does not count as a "shop" in the village.
By R005's calculation, all eight municipalities of the subprefecture lose at least 30% of their population by 2050. As population falls, trades set by population — barbering, beauty, retail — fall with it. But milk volume is not set by population (r = +0.097). The two need not fall alike. That is a hypothesis; this paper does not test it.
4-6 What 2,593 samples means
Against 3,569,411 kilolitres, 2,593 samples is one per 1,377 kilolitres.
Six failed (0.23%): four plain milk, two processed milk at 3% or more.
That 0.23% cannot be read as "it is safe." As I014 also argued, it is the administration that decides how many samples to take, and how much was examined is what makes the number. Hokkaido processes 17.1% of the national volume and took 3.5% of the samples (90).
Sampling density per unit processed differs by prefecture. Fewer samples do not mean safer, and more do not mean riskier.
5. Limitations
- These are volumes processed, not produced (raw milk yield). Milk moved across prefectural boundaries counts where it was processed
- The health register is FY2024 (volume during the year); the Economic Census is 1 June 2021
- Dairy products — cheese, butter, skimmed milk powder — are not in this table
- "Other milk" includes component-adjusted milk and milk drinks; this table cannot break it down
- Sampling tests are samples the administration drew, not a test of everything shipped
- Prefectures decide how many samples to take. Fewer does not mean safer, and more does not mean riskier
- The 15.38% failure rate for processed milk at 3% or more rests on a denominator of 13
- The health register has no municipal table. The Kushiro Subprefecture is shown from the Economic Census
- The relation between method and volume is observed at prefecture level; the choice made by individual plants is not
- A correlation indicates the strength of a relationship, not the direction of causation
6. How to reproduce
- Download Table 2 (Milk and Meat Hygiene, volume of milk processed) of the FY2024 Report on Public Health Administration from e-Stat (CP932)
- Take the national row and the 47 rows from Hokkaido to Okinawa (nothing below "designated cities (regrouped)")
- Sum the totals of the six types (special, plain, low-fat, two processed, other) for the overall figure
- For plain milk, compute the shares of 63–65 °C, 75 °C or above, and flash
- Divide by population for the per-head figure and correlate against population in logs
- Take samples and failures by type of milk from Table 1
Every figure in this paper is output by a single script (kensan_207). No intermediate value was copied by hand.
Scope of this paper
No new theory is claimed. Tables 2 and 1 of the Report on Public Health Administration are counted. It shows a 20,444-fold spread in volume processed, that Hokkaido with 4.0% of the population processes 17.1%, that volume per head is essentially unrelated to population (r = +0.097), that 95.36% of plain milk is flash pasteurised, and that special milk amounts to 52 kilolitres of which the 8 unpasteurised are all in Hokkaido. These are volumes processed, not produced. Correlations are reported; the direction of causation is not.
References and data sources
- Ministry of Health, Labour and Welfare, Report on Public Health Administration, FY2024, Tables 2 and 1 (Milk and Meat Hygiene)
- Ministry of Internal Affairs and Communications and Ministry of Economy, Trade and Industry, Economic Census 2021, Tables 9-1A and 9-1B
- Ministry of Internal Affairs and Communications, Basic Resident Register population, 1 January 2026
- Yuuki Yamagishi, "Of 23,668 'Public Bathhouses', 2,730 Are Sento" (I009)
- Yuuki Yamagishi, "865,122 Food Businesses Require Notification" (I011)
- Yuuki Yamagishi, "11,910 Shops Sell Medicines Online (12.8%)" (I014)
- Yuuki Yamagishi, "107,995 Barbershops and 277,752 Beauty Salons" (I015). Zenodo. https://doi.org/10.5281/zenodo.22878037
- Yuuki Yamagishi, "How Many People Does a Trade Run On?" (X001)
- Yuuki Yamagishi, "Wages 1.20-fold, Prices 1.08-fold, Income 1.85-fold, Land 87.4-fold" (X002). Zenodo. https://doi.org/10.5281/zenodo.22877924
- Yuuki Yamagishi, "How Many Trades Will Leave a Town by 2050?" (R005). Zenodo. https://doi.org/10.5281/zenodo.22877595
Version history
| Version | Date | Contents |
|---|---|---|
| 1 | 2026-09-22 | First release |
How to cite
Yamagishi, Y. (2026). Milk Processed Differs 20,444-fold Top to Bottom: Hokkaido, with 4.0% of the Population, Processes 17.1% [I016]. Zenodo. https://doi.org/10.5281/zenodo.22879076
(This DOI is the concept DOI; it always resolves to the latest version. Cite this one.)
© 2026 Yuuki YAMAGISHI
This work is licensed under a Creative Commons Attribution 4.0 International License (CC BY 4.0).
You may copy, adapt, redistribute and use it commercially, provided you give appropriate credit.
creativecommons.org/licenses/by/4.0
All figures and values in this paper were computed from official statistics. Rights in the underlying data remain with the publishing agencies.
Reference
Yamagishi, Y. (2026). Milk Processed Differs 20,444-fold Top to Bottom: Hokkaido, with 4.0% of the Population, Processes 17.1% [I016]. Zenodo.
DOI: 10.5281/zenodo.22879076
YOI: https://www.yamagishiyuuki.com/yoi/I016
ORCID: 0009-0006-8587-3450
PDF (English) · PDF (Japanese) · Date proof of the English PDF (OpenTimestamps .ots) · SHA256SUMS
The record page for this paper (in Japanese, with the PDFs in each language and the date proof): YOI I016. This paper is a preprint and has not been peer reviewed.