Abstract
From Tables 3-1 to 3-8 of the Report on Public Health Administration (FY2024) I split Japan's 48,608 specified buildings by use and counted appointments of supervising engineers, on-site inspections, and non-compliances by item examined. I012 looked only at the total table (3-1).
Of the 48,608, offices are the largest group at 19,767 (40.7%), followed by shops at 10,616 (21.8%) and hotels at 6,892 (14.2%); the smallest is entertainment venues at 1,257 (2.59%). Offices outnumber entertainment venues 16 to 1, and the top three uses are 76.7% of the total.
Supervising engineers are appointed at 99.65% of buildings. By use this runs from 99.89% for department stores to 98.90% for hotels. 170 buildings have none.
On-site inspections numbered 6,997, or 14.4% of buildings — once in 6.9 years. Requests for reports (21,355) are 3.1 times the inspections. Hotels are highest at 25.6%, "other" lowest at 9.6%.
Of 371,503 examinations, 30,982 (8.34%) were non-compliant. But the rate depends entirely on the item.
| Item | Examined | Non-compliant | Rate |
|---|---|---|---|
| Relative humidity | 13,968 | 8,355 | 59.82% |
| Temperature | 14,250 | 5,697 | 39.98% |
| Carbon dioxide | 17,728 | 3,196 | 18.03% |
| … | |||
| Carbon monoxide | 17,478 | 98 | 0.56% |
| Water quality standards | 18,424 | 85 | 0.46% |
Six in ten humidity readings fail the standard, while carbon monoxide and water quality sit around 0.5%.
1. Introduction
I012 counted 48,608 specified buildings and the 17,842 registered offices that manage them. That paper looked only at Table 3-1, the total.
Table 3 runs from 3-2 to 3-8 by use — entertainment venues, department stores, shops, offices, schools, hotels and other. Each table carries the examinations and non-compliances for 39 separate items.
What are specified buildings used for, and what fails the standards?
2. Data
| Buildings, supervising engineers, inspections, items examined | MHLW, Report on Public Health Administration, FY2024, Tables 3-1 to 3-8 (Environmental Health). Buildings and appointments as at end of FY2024; inspections and examinations during the year |
| Economic Census | MIC and METI, Economic Census 2021, 922 Building maintenance services (counted in I012) |
| Population | MIC, Basic Resident Register, 1 January 2026 |
The seven uses sum exactly to the total of 48,608 (difference zero).
There are 39 items examined. Notes 1 to 5 of Table 3 set out exceptions in what each measurement covers (measurement of the air environment excludes formaldehyde; cleaning of water tanks excludes hot-water tanks; and so on).
A "specified building" falls under the Act on Maintenance of Sanitation in Buildings (the Building Sanitation Act), which covers only buildings meeting requirements of use and floor area.
3. Results
3-1 Offices are 40.7%
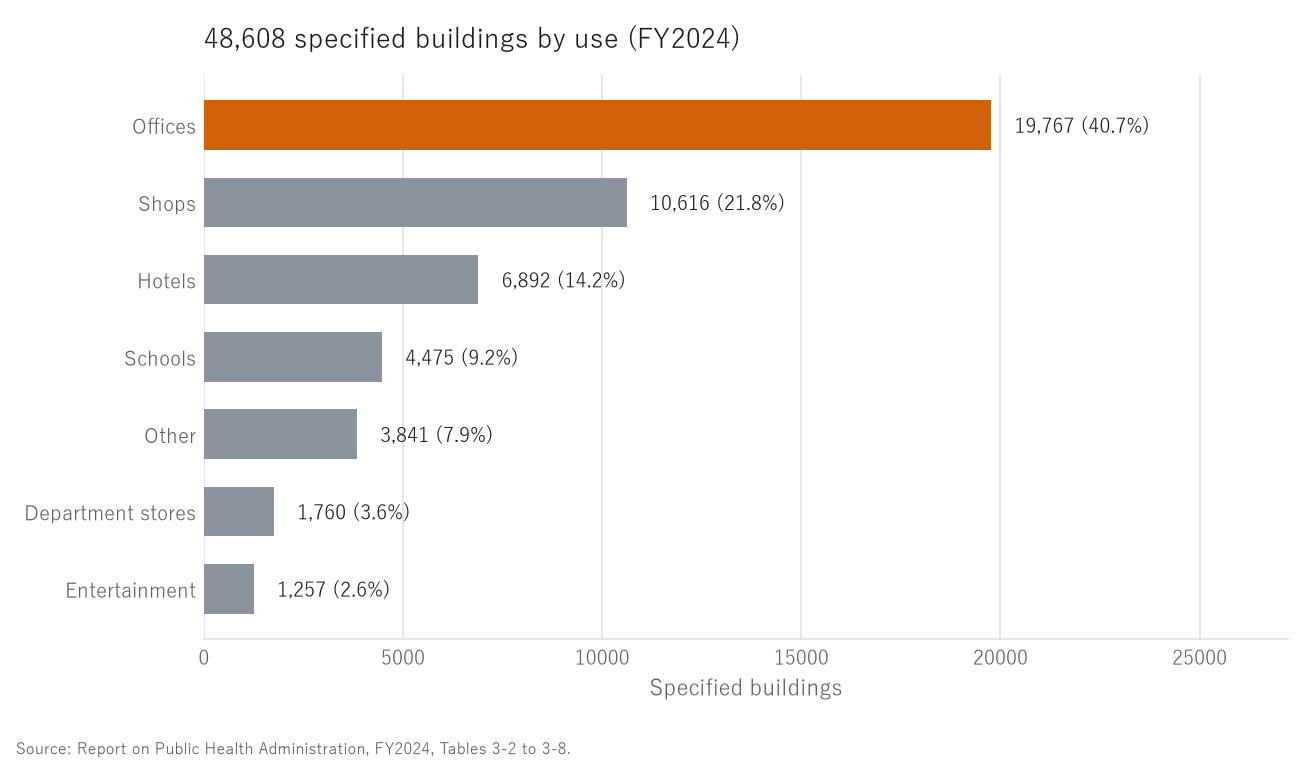
Figure 1. 48,608 specified buildings by use (FY2024).
Orange is offices.
| Use | Buildings | Share |
|---|---|---|
| Offices | 19,767 | 40.7% |
| Shops | 10,616 | 21.8% |
| Hotels | 6,892 | 14.2% |
| Schools | 4,475 | 9.2% |
| Other | 3,841 | 7.9% |
| Department stores | 1,760 | 3.6% |
| Entertainment venues | 1,257 | 2.59% |
| Total | 48,608 |
Offices outnumber entertainment venues 16 to 1; the top three uses (offices, shops, hotels) are 76.7%.
I019 counted 4,826 permanent entertainment venues under the Entertainment Venues Act. Of those, 1,257 (26.0%) meet the specified-building requirements. But the two regimes have different floor-area thresholds, so this is not a simple subset.
3-2 99.65% have a supervising engineer
| Use | Buildings | With engineer | Rate |
|---|---|---|---|
| Department stores | 1,760 | 1,758 | 99.89% |
| Entertainment venues | 1,257 | 1,255 | 99.84% |
| Offices | 19,767 | 19,728 | 99.80% |
| Shops | 10,616 | 10,592 | 99.77% |
| Schools | 4,475 | 4,463 | 99.73% |
| Other | 3,841 | 3,826 | 99.61% |
| Hotels | 6,892 | 6,816 | 98.90% |
| Total | 48,608 | 48,438 | 99.65% |
170 buildings have none. The spread across uses is about one percentage point, with hotels alone slightly lower.
3-3 Inspections come once in 6.9 years
| Use | Reports requested | Inspections | Inspections ÷ buildings | Reports ÷ buildings |
|---|---|---|---|---|
| Hotels | 2,396 | 1,761 | 25.6% | 34.8% |
| Shops | 4,277 | 1,817 | 17.1% | 40.3% |
| Department stores | 659 | 265 | 15.1% | 37.4% |
| Entertainment venues | 369 | 186 | 14.8% | 29.4% |
| Offices | 10,501 | 2,118 | 10.7% | 53.1% |
| Schools | 1,878 | 480 | 10.7% | 42.0% |
| Other | 1,275 | 370 | 9.6% | 33.2% |
| Total | 21,355 | 6,997 | 14.4% | 43.9% |
6,997 inspections against 48,608 buildings is 14.4% — once in 6.9 years.
Requests for reports (21,355) are 3.1 times the inspections. The administration's main point of contact with a specified building is paperwork, not a visit. For offices, reports reach 53.1% of buildings while inspections reach 10.7%.
Hotels at 25.6% are 2.7 times "other" at 9.6%. Hotels have the lowest appointment rate and the highest inspection rate.
3-4 Six in ten non-compliances are relative humidity
| Item (the 38 with 1,000+ examinations) | Examined | Non-compliant | Rate |
|---|---|---|---|
| Relative humidity | 13,968 | 8,355 | 59.82% |
| Temperature | 14,250 | 5,697 | 39.98% |
| Carbon dioxide | 17,728 | 3,196 | 18.03% |
| Drain pan fouling and blockage check | 9,294 | 1,333 | 14.34% |
| Keeping of records | 15,018 | 1,916 | 12.76% |
| Humidifier fouling check (monthly) | 7,856 | 964 | 12.27% |
| Humidifier cleaning (annual) | 7,826 | 839 | 10.72% |
| Drainage cleaning | 13,841 | 1,201 | 8.68% |
| … | |||
| Water tank cleaning | 18,841 | 155 | 0.82% |
| Carbon monoxide | 17,478 | 98 | 0.56% |
| Water quality standards | 18,424 | 85 | 0.46% |
| Total examinations | 371,503 |
| Total non-compliances | 30,982 (8.34%) |
| Median | 4.32% |
| Items with none | 0 of 39 |
All 39 items produce some non-compliance. And relative humidity alone accounts for 27.0% of all non-compliances (8,355 of 30,982); humidity and temperature together, 45.4%.
The most examined items are free residual chlorine testing (20,233), free residual chlorine level (19,671), water quality testing (19,273) and water tank cleaning (18,841). Water is what gets examined.
3-5 Non-compliance rates barely differ by use
| Use | Examined | Non-compliant | Rate |
|---|---|---|---|
| Shops | 64,553 | 6,073 | 9.41% |
| Other | 21,660 | 1,869 | 8.63% |
| Schools | 32,206 | 2,689 | 8.35% |
| Offices | 165,046 | 13,550 | 8.21% |
| Department stores | 13,335 | 1,075 | 8.06% |
| Entertainment venues | 8,490 | 672 | 7.92% |
| Hotels | 66,213 | 5,054 | 7.63% |
| Total | 371,503 | 30,982 | 8.34% |
Top to bottom is only 1.2-fold. Against the spread by item (0.46% to 59.82%), the spread by use is negligible.
3-6 Hokkaido
| Use | Buildings | With engineer | Rate | Inspections |
|---|---|---|---|---|
| Offices | 747 | 738 | 98.80% | 100 |
| Shops | 628 | 626 | 99.68% | 43 |
| Hotels | 532 | 516 | 96.99% | 188 |
| Schools | 284 | 283 | 99.65% | 43 |
| Other | 219 | 212 | 96.80% | 20 |
| Department stores | 102 | 102 | 100.00% | 7 |
| Entertainment venues | 47 | 47 | 100.00% | 7 |
| Total | 2,559 | 2,524 | 98.63% | 408 |
Hokkaido's 2,559 specified buildings are 5.3% of the national 48,608, above its 4.0% share of population.
408 inspections is 15.9% of its buildings, above the national 14.4%.
188 inspections against 532 hotels is 35.3% (national hotels 25.6%). Hokkaido's hotel appointment rate of 96.99% is below the national 98.90%, and its overall 98.63% below the national 99.65%.
4. Discussion
4-1 A "building" here means an office
Of 48,608 specified buildings, 19,767 (40.7%) are offices; the top three uses are 76.7%.
The Building Sanitation Act is, in practice, a regime for office blocks, retail premises and hotels.
I012 counted 17,842 registered offices managing them, against 27,977 establishments in Economic Census category 922 (building maintenance services). 48,608 buildings are managed by 27,977 establishments.
As X001 showed, category 922 is not among the larger subcategories by headcount. Large buildings are managed by mid-sized firms.
4-2 How to read 59.82%
Of 13,968 examinations of relative humidity, 8,355 (59.82%) failed the standard. Temperature failed 39.98%.
This does not mean six in ten buildings are breaking the law.
Two reasons.
- The relative humidity standard is hard to meet on a dry winter day. Even with humidifying equipment, dry outside air pulls the reading below it
- Measurement happens at a particular moment. The question is not whether the standard held all year but what the reading was when taken
What deserves attention is the size of the spread by item.
| Non-compliance rate | |
|---|---|
| Relative humidity | 59.82% |
| Temperature | 39.98% |
| Carbon dioxide | 18.03% |
| Carbon monoxide | 0.56% |
| Water quality standards | 0.46% |
Carbon monoxide and water quality are almost fully complied with. Humidity and temperature fail around half the time.
What is directly health-critical and reliably controlled by equipment (water, carbon monoxide) holds; what depends on outside air (humidity, temperature) does not. That reflects both the design of the regime and physical difficulty. But this reading is a hypothesis this table cannot test.
4-3 Reports outnumber inspections 3.1 to 1
21,355 requests for reports against 6,997 inspections. The administration's main contact with a specified building is paperwork.
For offices, reports reach 53.1% of buildings and inspections 10.7% — paperwork once in 1.9 years, a visit once in 9.3.
Set beside what earlier papers found, the 14.4% inspection rate is mid-range.
| Inspection / monitoring rate | |
|---|---|
| Hospitals (I021) | 96.0% |
| Food businesses (I022, inspection and guidance) | 59.1% |
| Specified buildings (this paper, inspections) | 14.4% |
| General clinics (I021) | 13.9% |
| Dental clinics (I021) | 9.2% |
Only hospitals are entered every year; everything else is once in several.
4-4 That use makes no difference
Non-compliance runs from 9.41% for shops to 7.63% for hotels — 1.2-fold.
The spread by item runs from 0.46% to 59.82% — 130-fold.
What fails is determined by the item, not by the use. In a building of any use, humidity fails and water holds.
This has a practical implication. Changing what a building is used for does not change what fails.
4-5 Hokkaido's hotels
188 inspections against 532 hotels in Hokkaido is 35.3%, above the national 25.6% for hotels. Its appointment rate of 96.99% is below the national 98.90%.
Inspections are concentrated where appointment rates are lower. The direction is consistent.
I006 counted 52,946 hotel and inn premises nationwide with 1,782,232 rooms. Of those, 6,892 (13.0%) meet the specified-building requirements. Only the large hotels fall under the Building Sanitation Act.
X002 found Hokkaido third in Japan for prices and 29th for the real minimum wage; R005 projects all eight municipalities of the Kushiro Subprefecture to lose at least 30% of their population by 2050. A large building still has to be managed for as long as it stands.
5. Limitations
- A "specified building" falls under the Building Sanitation Act, which covers only buildings meeting requirements of use and floor area
- The seven uses are checked against the total (difference zero)
- "Inspections" counts events, not buildings. Entering the same building twice counts twice
- Non-compliance rates move with how examination is targeted. Items and uses with fewer examinations give less stable rates
- Items with fewer than 1,000 examinations are excluded from comparison, since one or two move the rate sharply
- Measurement is taken at a particular time, not sustained over a year
- Notes 1 to 5 of Table 3 set out exceptions in what each measurement covers (measurement of the air environment excludes formaldehyde; cleaning of water tanks excludes hot-water tanks)
- The reasons offered for the high humidity failure rate (dry outside air, the limits of humidifying equipment) are hypotheses this table cannot test
- I019's 4,826 entertainment venues and this paper's 1,257 have different floor-area thresholds, so neither is a simple subset of the other
- The health register has no municipal table
- Few non-compliances does not necessarily mean few problems
6. How to reproduce
- Download Tables 3-1 to 3-8 (Environmental Health, specified buildings) of the FY2024 Report on Public Health Administration from e-Stat (CP932)
- From each, take the national row and the 47 rows from Hokkaido to Okinawa (nothing below "designated cities (regrouped)")
- Sum the seven uses and check against the total table
- Divide appointments by buildings for the appointment rate, and inspections by buildings for the inspection rate
- Build the 39 item names from the header rows and take each pair of examination and non-compliance counts
- Compute non-compliance rates by item and by use. Exclude items with fewer than 1,000 examinations from comparison
Every figure in this paper is output by a single script (kensan_214). No intermediate value was copied by hand.
Scope of this paper
No new theory is claimed. Tables 3-1 to 3-8 of the Report on Public Health Administration are counted by use. It shows offices at 19,767 (40.7%) of 48,608 specified buildings, a supervising-engineer appointment rate of 99.65% with hotels alone at 98.90%, 6,997 inspections amounting to once in 6.9 years, requests for reports at 3.1 times inspections, and non-compliance rates spanning 130-fold by item (59.82% for relative humidity to 0.46% for water quality) against only 1.2-fold by use. The reasons offered for the humidity rate are hypotheses this table cannot test.
References and data sources
- Ministry of Health, Labour and Welfare, Report on Public Health Administration, FY2024, Tables 3-1 to 3-8 (Environmental Health)
- Ministry of Internal Affairs and Communications and Ministry of Economy, Trade and Industry, Economic Census 2021, Tables 9-1A and 9-1B
- Ministry of Internal Affairs and Communications, Basic Resident Register population, 1 January 2026
- Yuuki Yamagishi, "Lodging Counts Differ 13.7-fold Between Statistics" (I006)
- Yuuki Yamagishi, "48,608 Specified Buildings Are Managed by 17,842 Registered Offices" (I012)
- Yuuki Yamagishi, "1,468 Cinema Premises, and None at All in 82.1% of Municipalities" (I019). Zenodo. https://doi.org/10.5281/zenodo.22879269
- Yuuki Yamagishi, "25,678 Inspections, 3 Sanctions" (I021). Zenodo. https://doi.org/10.5281/zenodo.22879344
- Yuuki Yamagishi, "1,904,239 Licensed Food Businesses" (I022)
- Yuuki Yamagishi, "How Many People Does a Trade Run On?" (X001)
- Yuuki Yamagishi, "Wages 1.20-fold, Prices 1.08-fold, Income 1.85-fold, Land 87.4-fold" (X002). Zenodo. https://doi.org/10.5281/zenodo.22877924
- Yuuki Yamagishi, "How Many Trades Will Leave a Town by 2050?" (R005). Zenodo. https://doi.org/10.5281/zenodo.22877595
Version history
| Version | Date | Contents |
|---|---|---|
| 1 | 2026-09-22 | First release |
How to cite
Yamagishi, Y. (2026). Six in Ten Non-Compliances Are Relative Humidity — and Inspections Come Once in 6.9 Years [I023]. Zenodo. https://doi.org/10.5281/zenodo.22879464
(This DOI is the concept DOI; it always resolves to the latest version. Cite this one.)
© 2026 Yuuki YAMAGISHI
This work is licensed under a Creative Commons Attribution 4.0 International License (CC BY 4.0).
You may copy, adapt, redistribute and use it commercially, provided you give appropriate credit.
creativecommons.org/licenses/by/4.0
All figures and values in this paper were computed from official statistics. Rights in the underlying data remain with the publishing agencies.
Reference
Yamagishi, Y. (2026). Six in Ten Non-Compliances Are Relative Humidity [I023]. Zenodo.
DOI: 10.5281/zenodo.22879464
YOI: https://www.yamagishiyuuki.com/yoi/I023
ORCID: 0009-0006-8587-3450
PDF (English) · PDF (Japanese) · Date proof of the English PDF (OpenTimestamps .ots) · SHA256SUMS
The record page for this paper (in Japanese, with the PDFs in each language and the date proof): YOI I023. This paper is a preprint and has not been peer reviewed.