Abstract
For each of the 526 industrial subcategories I computed workers per establishment from the 2021 Economic Census, and set it beside the number of the 1,889 municipalities in which the subcategory is present.
Across all industries, 62,427,908 workers over 5,288,891 establishments gives 11.80. The median across subcategories is 14.77, the minimum is 1.57 for authors and artists, and the maximum 746.22 for iron manufacturing — a 475-fold spread.
170 subcategories (32.3%) average under 10 workers per establishment, and 408 (77.6%) under 30. Nearly four-fifths of Japan's industrial subcategories do not reach thirty.
The fewer workers per establishment, the more municipalities have the subcategory (r = −0.417 between the base-10 logarithm of workers per establishment and the count of municipalities). Split into quartiles, the smallest quarter is present in a median of 1,279 municipalities and the largest quarter in only 339.
In the Kushiro Subprefecture the figure runs from 6.62 (Teshikaga) to 10.62 (Shiranuka); the national median across 1,889 municipalities is 9.58.
A table of all 526 subcategories is attached as a CSV.
1. Introduction
R001 counted the industrial subcategories present in each municipality, R002 the population at which a subcategory appears, and R003 the subcategories of which a town has only one. All counted establishments.
I004 showed barbershops and beauty salons at 1.80 and 2.12 workers per shop; I008 showed cleaning premises that wash at 1.68. Each covered one trade.
Establishment counts and worker counts are published as two tables of the same shape. Dividing one by the other gives workers per establishment for all 526 subcategories.
How many people does a trade run on? And does that relate to where the trade is found?
2. Data
| Establishments | 2021 Economic Census for Business Activity, Table 9-1A: establishments by industrial subcategory (1 June 2021) |
| Workers | Same census, Table 9-1B: workers by industrial subcategory (same date) |
| Municipalities | MIC, Basic Resident Register population, 1 January 2026 (unit A of R001, 1,892 municipalities) |
There are 526 industrial subcategories, and all their names were readable.
Nationally: 5,288,891 establishments and 62,427,908 workers. Summing unit A's 1,892 municipalities gives 62,012,734 workers, 415,174 short of the national figure (areas of undetermined boundary and the like).
The worker table contains no suppressed values (X). The establishment table does. The count of municipalities where a subcategory is present therefore excludes suppressed cells.
Of unit A's 1,892 municipalities, 1,889 also appear in the industry table.
3. Results
3-1 11.80 across all industries; a subcategory median of 14.77
| Workers nationally | 62,427,908 |
| Establishments nationally | 5,288,891 |
| Workers per establishment | 11.80 |
Across the 526 subcategories:
| Workers | |
|---|---|
| Median | 14.77 |
| Lower quartile | 8.16 |
| Upper quartile | 27.47 |
| Minimum | 1.57 |
| Maximum | 746.22 |
The subcategory median (14.77) exceeds the all-industry figure (11.80), because subcategories with many establishments tend to be the smaller ones (r = −0.445 between workers per establishment and establishment count).
| Workers per establishment | Subcategories | Share |
|---|---|---|
| Under 3 | 15 | 2.9% |
| Under 5 | 57 | 10.8% |
| Under 10 | 170 | 32.3% |
| Under 30 | 408 | 77.6% |
| Under 100 | 500 | 95.1% |
Nearly four-fifths of the subcategories do not reach thirty workers per establishment.
3-2 A 475-fold spread
| Largest | Workers per establishment | Establishments |
|---|---|---|
| 221 Iron manufacturing | 746.2 | 55 |
| 191 Tyre and tube manufacturing | 313.1 | 83 |
| 491 Postal services (incl. correspondence delivery) | 305.4 | 335 |
| 831 Hospitals | 288.2 | 8,341 |
| 222 Steel manufacturing and rolling | 264.3 | 99 |
| 105 Tobacco manufacturing | 233.8 | 6 |
| 561 Department stores and general merchandise supermarkets | 228.0 | 1,097 |
| 816 Higher education institutions | 226.6 | 2,442 |
| 381 Public broadcasting (excl. cable) | 215.3 | 56 |
| Smallest | Workers per establishment | Establishments |
|---|---|---|
| 942 Buddhist religious organisations | 2.65 | 61,064 |
| 693 Parking services | 2.59 | 24,619 |
| 943 Christian religious organisations | 2.59 | 7,696 |
| 835 Therapeutic services | 2.57 | 78,918 |
| 783 Beauty salons | 2.52 | 162,431 |
| 949 Other religious organisations | 2.40 | 13,011 |
| 723 Administrative scrivener offices | 1.98 | 7,350 |
| 782 Barbershops | 1.94 | 87,048 |
| 903 Mounting and paperhanging | 1.92 | 1,989 |
| 727 Authors and artists | 1.57 | 983 |
The spread from top to bottom is 475-fold (746.22 ÷ 1.57).
At the top sit subcategories with few establishments: iron manufacturing 55, tobacco manufacturing 6, public broadcasting 56. At the bottom sit those with many: beauty salons 162,431, barbershops 87,048, therapeutic services 78,918.
In I004, the Report on Public Health Administration gave 1.80 workers per barbershop premises and 2.12 per beauty salon. The Economic Census gives 1.94 and 2.52. The units differ (premises against establishments), so they do not match exactly, but they are of the same order.
3-3 The smaller the trade, the more municipalities have it
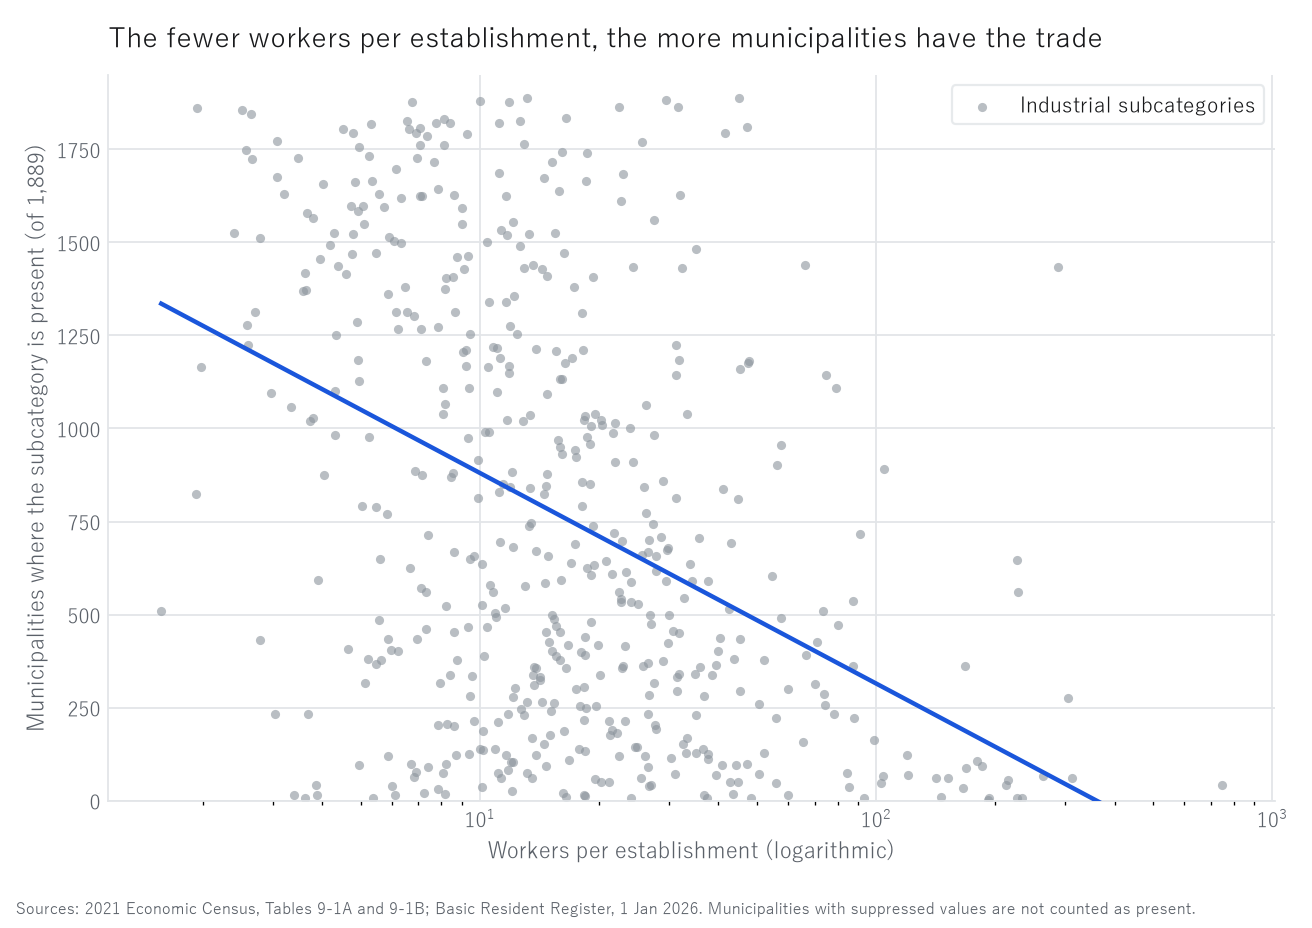
Figure 1. Workers per establishment and the number of municipalities where the subcategory is present (526 subcategories, 1,889 municipalities).
Grey points are subcategories; the blue line is a least-squares fit against the base-10 logarithm.
| Correlation (526 subcategories) | r |
|---|---|
| Workers per establishment (log) × municipalities present | −0.417 |
| Establishments (log) × municipalities present | +0.921 |
| Workers per establishment (log) × establishments (log) | −0.445 |
The fewer workers per establishment, the more municipalities have the subcategory.
By quartile the pattern separates clearly.
| Quartile by workers per establishment | Range | Municipalities present (median) |
|---|---|---|
| Smallest quarter | 1.6–8.1 | 1,279 |
| Second | 8.2–14.7 | 814 |
| Third | 14.8–27.4 | 594 |
| Largest quarter | 27.4–746.2 | 339 |
The smallest quarter reaches 3.8 times as many municipalities as the largest.
The strongest correlation, however, is with the number of establishments (r = +0.921). That a subcategory with many establishments is present in many municipalities is obvious; workers per establishment sits behind it. Being small per establishment and being numerous are two views of the same thing (r = −0.445 between them).
3-4 The Kushiro Subprefecture
| Municipality | Establishments | Workers | Per establishment |
|---|---|---|---|
| Kushiro City | 7,989 | 74,401 | 9.31 |
| Kushiro Town | 1,009 | 9,856 | 9.77 |
| Akkeshi | 531 | 4,029 | 7.59 |
| Hamanaka | 304 | 2,378 | 7.82 |
| Shibecha | 435 | 3,192 | 7.34 |
| Teshikaga | 468 | 3,099 | 6.62 |
| Tsurui | 140 | 1,262 | 9.01 |
| Shiranuka | 399 | 4,236 | 10.62 |
The national median across 1,889 municipalities is 9.58, the minimum 2.57 and the maximum 46.33.
Only Kushiro Town (9.77) and Shiranuka (10.62) exceed the median; the other six fall below it. Teshikaga's 6.62 is the lowest. As I006 showed, Teshikaga has an exceptional concentration of lodging, and lodging establishments are small.
Kushiro City, at 9.31, falls just below the national median.
3-5 The table of 526 subcategories
kensan_199_1事業所あたり.csv carries the following columns for all 526 subcategories.
| Column | Contents |
|---|---|
| Subcategory | three-digit code |
| Name | subcategory name |
| Establishments | national (2021) |
| Workers | national (2021) |
| Workers per establishment | workers ÷ establishments |
| Municipalities present | of 1,889 (suppressed cells excluded) |
| Municipalities suppressed | establishments reported as X |
4. Discussion
4-1 Answering "how many people does my trade average?"
When speaking to small businesses about their trade, "your trade averages N workers per establishment" is a basic figure. Hunting for it trade by trade takes work.
Dividing two Economic Census tables gives it for all 526 subcategories at once. The CSV attached here is that list.
But it is a mean. Beauty salons at 2.52 does not mean most salons have two people; it is one-person shops and twenty-person shops averaged together. The distribution is not examined here.
4-2 Small trades spread thin and wide
Subcategories with fewer workers per establishment are present in more municipalities (r = −0.417), and by quartile the difference is 1,279 against 339, a factor of 3.8.
R002 found that barbershops and beauty salons had the lowest possible threshold population, 155. Small trades appear in small towns too. This paper confirms that across all 526 subcategories.
A plausible reason is that a trade that runs on few people also needs few customers. Iron manufacturing must gather 746 people in one place, and the demand for that must be drawn nationally. A barbershop runs on 1.94, and that demand fits inside a town.
This paper does not observe demand, so that is an explanation, not a test.
4-3 Establishment counts and establishment size
Of the three correlations, the strongest is between establishments and municipalities present (r = +0.921) — unsurprising, since more establishments means more towns.
Workers per establishment sits behind it (r = −0.445 with establishment count). Whether trades are widespread because they are small, or appear small because they are numerous, is not separated here.
What can be said is that the three quantities — establishment count, workers per establishment, and municipalities present — move together.
4-4 Connections to the other papers
- Against I004 and I008. Barbershops at 1.94 (Census) sit near 1.80 (Public Health Report, per premises), and beauty salons at 2.52 near 2.12. Different units, same order
- Against R002 and R003. That small trades reach small towns is confirmed across all 526 subcategories
- Citable from any trade's article. One row of the CSV serves any trade page, so a single paper can be cited from all of them
5. Limitations
- The Census is as of 1 June 2021 and population as of 1 January 2026: the dates differ
- Workers include everyone working at the establishment (paid officers, regular employees, temporary employees and others); full-time and part-time are not distinguished
- The establishment table contains suppressed values (X). "Municipalities present" excludes them and may therefore understate
- Workers per establishment is a mean; the distribution of establishment sizes within a subcategory is not examined
- Revenue and profit are not examined. Headcount is only one aspect of the size of a business
- The national figure is computed from national totals, which differs from the mean across municipalities
- Summing unit A's 1,892 municipalities gives 415,174 fewer workers than the national figure (areas of undetermined boundary and the like)
- No causal claim is made that being small makes a trade widespread
6. Reproduction
- From e-Stat, obtain the 2021 Economic Census Table 9-1A (establishments by industrial subcategory) and Table 9-1B (workers by the same)
- Both have the same shape; tabulate them by municipality code and three-digit subcategory code (
_ツール/gyoshu_shichoson.pyand_ツール/jugyosha_shichoson.py) - On the national row (00000), divide workers by establishments for each subcategory
- Among unit A's 1,892 municipalities, use the 1,889 also present in the industry table and count, for each subcategory, those with at least one establishment (excluding suppressed cells)
- Correlate the base-10 logarithm of workers per establishment with the count of municipalities
All values are the output of a single script (kensan_199). No intermediate value was transcribed by hand.
Scope of this paper
No new theory is claimed. This paper divides Economic Census establishment counts by worker counts to tabulate workers per establishment for all 526 industrial subcategories, and sets that beside how many municipalities have each. It views from the side of size what R002 and R003 viewed from the side of counts. No causation is shown. The table is attached as a CSV so that any trade's article can cite it.
References and data sources
- Statistics Bureau of Japan and METI, 2021 Economic Census for Business Activity, Table 9-1A (establishments by industrial subcategory) and Table 9-1B (workers by the same).
- MIC, Population Based on the Basic Resident Register, 1 January 2026.
- Y. Yamagishi, "Population and the Number of Industrial Subcategories Present in Japanese Municipalities" (R001). Zenodo. https://doi.org/10.5281/zenodo.22872218
- Y. Yamagishi, "At What Population Does a Trade Appear?" (R002). Zenodo. https://doi.org/10.5281/zenodo.22872356
- Y. Yamagishi, "The Only One in Town" (R003). Zenodo. https://doi.org/10.5281/zenodo.22872474
- Y. Yamagishi, "Barbershops and Beauty Salons: Two People per Shop" (I004). Zenodo. https://doi.org/10.5281/zenodo.22875820
- Y. Yamagishi, "Seven in Ten Cleaning Premises Do Not Wash" (I008). Zenodo. https://doi.org/10.5281/zenodo.22876239
Version history
| Version | Date | Change |
|---|---|---|
| 1 | 2026-09-21 | First release |
How to cite
Yamagishi, Y. (2026). How Many Workers per Establishment? A Table of 526 Industrial Subcategories, and How the Smaller Trades Reach More Towns [X001]. Zenodo. https://doi.org/10.5281/zenodo.22877856
(This DOI is the concept DOI; it always resolves to the latest version. Cite this one.)
© 2026 Yuuki YAMAGISHI
This work is licensed under a Creative Commons Attribution 4.0 International License (CC BY 4.0).
You may copy, adapt, redistribute and use it commercially, provided you give appropriate credit.
creativecommons.org/licenses/by/4.0
All figures and values in this paper were computed from official statistics. Rights in the underlying data remain with the publishing agencies.
Reference
Yamagishi, Y. (2026). How Many Workers per Establishment? A Table of 526 Industrial Subcategories, and How the Smaller Trades Reach More Towns [X001]. Zenodo.
DOI: 10.5281/zenodo.22877856
YOI: https://www.yamagishiyuuki.com/yoi/X001
ORCID: 0009-0006-8587-3450
PDF (English) · PDF (Japanese) · Date proof of the English PDF (OpenTimestamps .ots) · SHA256SUMS
The record page for this paper (in Japanese, with the PDFs in each language and the date proof): YOI X001. This paper is a preprint and has not been peer reviewed.