Abstract
This paper asks from which causes and ages the rise in deaths in winter comes, and how that changed over time. From the monthly tables of Vital Statistics (cause × month, age × month, and year × month for 1947–2024), the "winter ratio" (December–March over April–November) and the "winter excess" (winter deaths above the rest-of-year level) were measured using deaths per day. No new mathematical theorem or new law is claimed.
First, in 2024 the winter ratio was 1.180 and the winter excess was 91070 deaths, 0.0567 of the year's 1605378 deaths. The monthly totals of the four tables agree, and the ratio from deaths differs from the ratio from population-based rates by at most 0.006 over 32 years (Sections 3 and 4).
Second, this is the core of the paper. Among 12 cause groups, heart disease carries the most winter excess (24062 deaths, 0.264), with a winter ratio of 1.357. The group with the largest ratio is accidents (1.496); among subcategories, influenza swings by 17.304 and accidental drowning by 2.806, yet their shares of the excess are only 0.026 and 0.041 (Section 5).
Third, the excess equals "rest-of-year deaths per day × (winter ratio − 1) × days of winter". Cancer barely swings (ratio 1.022), but because it is large, its excess is 2894 deaths (0.032). Suicide has a ratio of 0.957, fewer in winter (Section 5).
Fourth, by age, the winter ratio is smallest at ages 0–39 (1.053) and largest at 85–94 (1.205). Ages 75 and over carry 0.837 of the excess, but they also account for 0.801 of the year's deaths (Section 6).
Fifth, the winter ratio was largest in 1965 (1.382) and smallest in 2010 (1.111), yet the excess count is largest in 2024 (91070), the largest of the 32 years in the table. From 1965 to 2024 the excess grew 1.156 times and annual deaths 2.292 times (Section 7).
Sixth, the separator is how far a cause swings in winter and how large it usually is. "Causes that rise in winter" and "causes that raise winter deaths" are not the same list.
Scope note: No new mathematical theorem or new law is claimed — measuring seasonal swings from monthly deaths is a known method; this paper applies it to published tables and measures how far the size of the swing and the amount carried disagree. This paper is a structural interpretation describing the shape of numbers in public aggregate data; it is not medical advice, diagnosis, or a treatment recommendation. The author is not a physician. For decisions about individual health, consult a physician or medical institution. It is a preprint that has not been peer reviewed. It is not one person's outlook — all figures describe the monthly shape of national totals. It does not go into why deaths rise in winter (cold, infection, ways of living). The definition of winter is one choice — December–March is winter and April–November is the baseline; January–March and December of a calendar year belong to different winters. Cells with fewer than 10 deaths per month are not shown (there are 0 in this paper's groups and age bands). About the data: the e-Stat Vital Statistics are used under the Public Data License (Version 2.0); this paper's ratios and excess were produced by processing them. Source: Ministry of Health, Labour and Welfare, Vital Statistics. What this paper adds is splitting the winter excess into 12 non-overlapping cause groups and age bands and showing that the size of the swing (winter ratio) and the amount carried (share of excess) do not rank the same; writing the excess as the product of usual size, swing and days; and showing that over the 32 years from 1947 to 2024 the winter ratio and the excess count moved in opposite directions.
1. Notation and question
- Deaths per day: a month's deaths ÷ the days in that month (2024 is a leap year, so February has 29 days); this removes differences in month length.
- Winter ratio: deaths per day in winter (December, January, February, March) ÷ deaths per day in the rest of the year (April–November).
- Winter excess: winter deaths − (rest-of-year deaths per day × days of winter), the deaths that would not have occurred had winter stayed at the rest-of-year level. Split by cause or age, the parts sum exactly to the total excess.
Question: Which causes and ages carry the rise in winter deaths? Is the cause that swings most the one that carries most?
Observation 1.1: The winter excess is the product of rest-of-year deaths per day (usual size), the winter ratio minus 1 (swing) and the days of winter. A cause that swings a lot but is rare carries little; a cause that swings a little but is common carries a lot.
2. Survey and design
To be candid: the design was decided after looking at the tables.
| Content | |
|---|---|
| Year × month | Table 5.4: deaths and rates (per 1,000 population; annualised) by month of death; 32 years, every five years for 1947 and 1950–2000, every year for 2005–2024 |
| Cause × month | Volume 3, Table 3: deaths by the short list of causes × sex × month of death (2024) |
| Cause × month rates | Table 5.18: rates (per 100,000 population; annualised) by the short list of causes × month (2024); used to check the ratios from deaths |
| Age × month | Volume 2, Table 5: deaths by age (single years) × month × sex (2024); each age is split over two birth-year rows, which are added |
| Cause groups | 12 non-overlapping groups: cancer, heart disease, cerebrovascular, other circulatory, pneumonia, aspiration pneumonia, other respiratory, old age (senility), accidents, suicide, COVID-19, other |
3. Data and checks
Calculation 3.1 The retrieved files were fixed by SHA-256, and the following were checked.
| Check | Result |
|---|---|
| Monthly totals for 2024 | Agree across Table 5.4, Volume 3 Table 3 and Volume 2 Table 5 (January 155418, December 157141) |
| Volume 3, Table 3 | Men + women = total; sum of the 20 chapters = total (each month) |
| Volume 2, Table 5 | Single ages (0–120) + unknown (543) = total (each month) |
| 12 cause groups | Monthly sums = total; sum of excesses = total excess |
| Ratio from deaths vs from rates | 1.180 and 1.176 for the 2024 total (difference +0.004); largest difference over 32 years 0.006 |
Observation 3.2: The ratio of deaths per day ignores month-to-month changes in population, but it agrees with the ratio from population-based rates to within 0.006. The ratios in this paper can be read to the second decimal place.
4. The monthly shape of 2024
Calculation 4.1 Deaths per day in 2024
| Jan | Feb | Mar | Apr | May | Jun | Jul | Aug | Sep | Oct | Nov | Dec |
|---|---|---|---|---|---|---|---|---|---|---|---|
| 5013 | 4804 | 4644 | 4178 | 3986 | 3889 | 4111 | 4272 | 4143 | 4126 | 4396 | 5069 |
Observation 4.2: The highest month is December and the lowest June, a ratio of 1.303. Against 4137.5 deaths per day in the rest of the year, winter has 4883.9; the winter ratio is 1.180 and the winter excess is 91070 deaths (0.0567 of the year's deaths).
5. Core — causes that swing and causes that carry
Calculation 5.1 Winter ratio and excess by cause group (2024, largest excess first)
| Group | Annual deaths | Rest-of-year deaths per day | Winter ratio | Excess (deaths) | Share of excess | Peak month |
|---|---|---|---|---|---|---|
| Heart disease | 226388 | 552.8 | 1.357 | +24062 | +0.264 | Jan |
| Other | 323290 | 836.3 | 1.169 | +17218 | +0.189 | Dec |
| Old age (senility) | 206887 | 536.4 | 1.162 | +10574 | +0.116 | Dec |
| Cerebrovascular | 102821 | 262.3 | 1.213 | +6820 | +0.075 | Jan |
| Accidents | 45743 | 107.2 | 1.496 | +6492 | +0.071 | Dec |
| Pneumonia | 80176 | 202.4 | 1.248 | +6114 | +0.067 | Jan |
| Other respiratory | 61142 | 151.5 | 1.308 | +5694 | +0.063 | Dec |
| COVID-19 | 35865 | 84.5 | 1.479 | +4938 | +0.054 | Feb |
| Other circulatory | 41771 | 102.8 | 1.331 | +4146 | +0.046 | Jan |
| Cancer | 398020 | 1079.6 | 1.022 | +2894 | +0.032 | Dec |
| Aspiration pneumonia | 63667 | 167.4 | 1.118 | +2402 | +0.026 | Dec |
| Suicide | 19608 | 54.4 | 0.957 | −286 | −0.003 | Apr |
Observation 5.2: Heart disease carries the most excess (0.264), with a winter ratio of 1.357. The group with the largest ratio is accidents (1.496), but its share of the excess is 0.071. The ranking by excess does not match the ranking by ratio. The excess equals exactly "rest-of-year deaths per day × (winter ratio − 1) × days of winter (122 days)", so it is set by both usual size and swing.
Observation 5.3: Cancer's winter ratio is 1.022, the smallest swing among the 12 groups. Yet with 1079.6 deaths per day in the rest of the year, its excess is 2894 deaths (0.032). Suicide has a ratio of 0.957, fewer in winter, with its highest daily deaths in April.
Calculation 5.4 Selected subcategories (2024)
| Cause | Annual deaths | Rest-of-year deaths per day | Winter ratio | Excess (deaths) | Share of excess | Peak month |
|---|---|---|---|---|---|---|
| Influenza | 2857 | 1.2 | 17.304 | +2413 | +0.026 | Dec |
| Accidental drowning | 9905 | 16.9 | 2.806 | +3722 | +0.041 | Dec |
| Acute myocardial infarction | 28237 | 66.5 | 1.479 | +3886 | +0.043 | Jan |
| Intracerebral haemorrhage | 32566 | 81.5 | 1.274 | +2728 | +0.030 | Jan |
| Falls | 11935 | 30.0 | 1.263 | +961 | +0.011 | Dec |
| Diabetes | 14959 | 37.6 | 1.260 | +1194 | +0.013 | Jan |
| Heart failure | 98814 | 248.7 | 1.257 | +7800 | +0.086 | Jan |
| Renal failure | 29665 | 75.5 | 1.219 | +2014 | +0.022 | Jan |
| Cerebral infarction | 56129 | 144.8 | 1.177 | +3130 | +0.034 | Jan |
| Alzheimer's disease | 25595 | 66.7 | 1.146 | +1184 | +0.013 | Dec |
Observation 5.5: Influenza's winter ratio of 17.304 is 12.75 times heart disease's, but heart disease carries 9.97 times as much excess. Accidental drowning also swings strongly (2.806), with an excess of 3722 deaths (0.041). The causes that swing most are not the causes that most increase winter deaths.
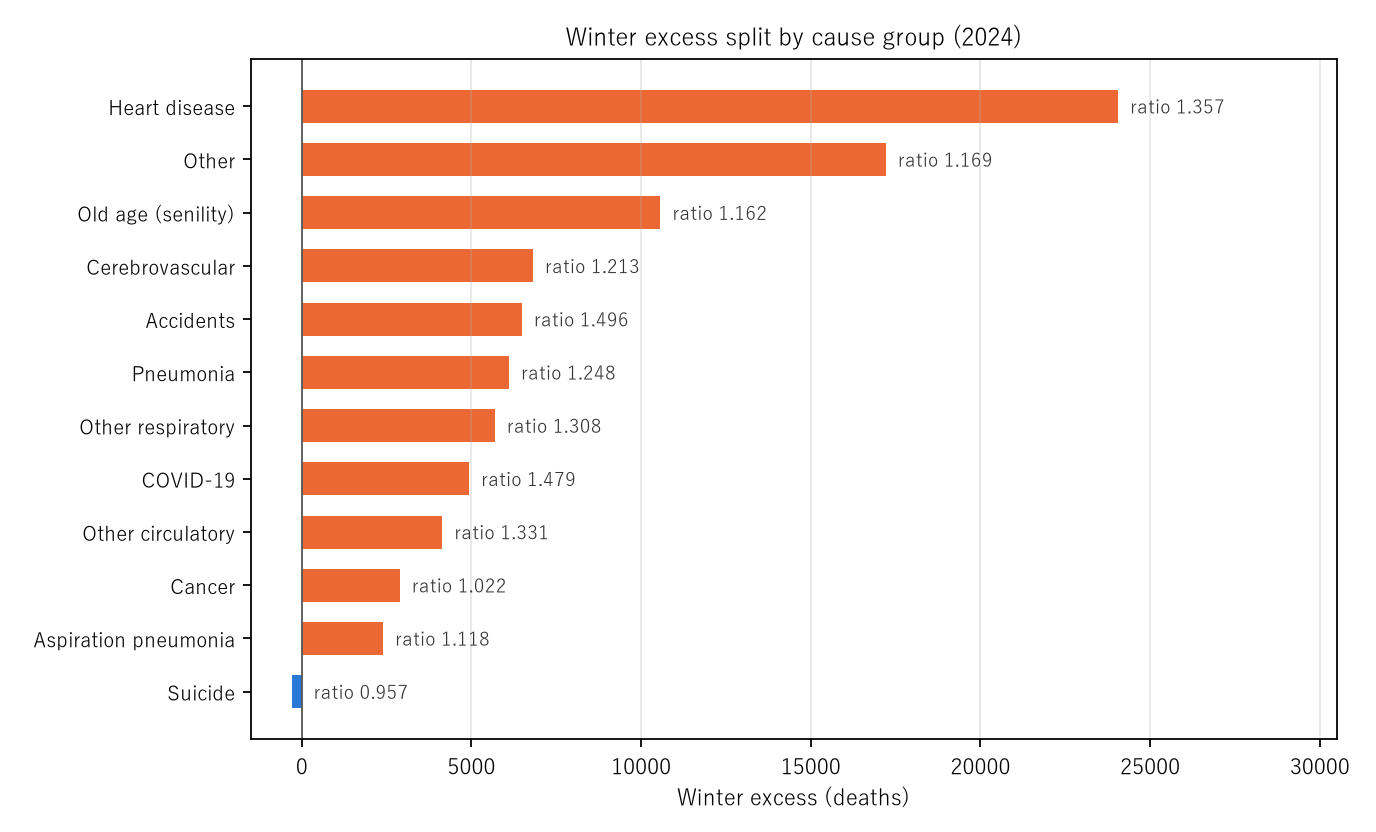
Figure 1: The 2024 winter excess (deaths) split into 12 cause groups; the number at the end of each bar is the winter ratio. Heart disease has the longest bar, but accidents have the largest ratio. Cancer keeps a bar with a ratio of 1.022, and only suicide is negative.
6. By age
Calculation 6.1 Winter ratio and excess by age band (2024)
| Age band | Annual deaths | Winter ratio | Excess (deaths) | Share of excess |
|---|---|---|---|---|
| 0–39 | 15402 | 1.053 | +268 | +0.003 |
| 40–64 | 113235 | 1.118 | +4299 | +0.047 |
| 65–74 | 191139 | 1.170 | +10260 | +0.113 |
| 75–84 | 451728 | 1.167 | +23871 | +0.262 |
| 85–94 | 627118 | 1.205 | +40198 | +0.441 |
| 95+ | 206213 | 1.189 | +12192 | +0.134 |
Observation 6.2: The winter ratio is smallest at 0–39 (1.053) and largest at 85–94 (1.205). The excess among deaths of unknown age is −20; added to the bands, it gives the total.
Observation 6.3: Ages 75 and over carry 0.837 of the excess, but they also account for 0.801 of the year's deaths. The three bands from 75 have ratios of 1.167–1.205, and the gap between the share of excess and the share of deaths is small. The excess gathers at old ages mainly because deaths at old ages are common to begin with. Here too, the amount carried is set by usual size.
7. Over the years
Calculation 7.1 Winter ratio and excess over time (Table 5.4)
| Year | Winter ratio | Excess (deaths) | Share of annual deaths |
|---|---|---|---|
| 1947 | 1.246 | +85669 | 0.0753 |
| 1950 | 1.286 | +78404 | 0.0866 |
| 1955 | 1.229 | +48904 | 0.0705 |
| 1960 | 1.266 | +57558 | 0.0815 |
| 1965 | 1.382 | +78769 | 0.1125 |
| 1970 | 1.332 | +70700 | 0.0992 |
| 1975 | 1.248 | +53296 | 0.0759 |
| 1980 | 1.209 | +47014 | 0.0650 |
| 1985 | 1.190 | +44675 | 0.0594 |
| 1990 | 1.192 | +48987 | 0.0597 |
| 1995 | 1.289 | +80497 | 0.0873 |
| 2000 | 1.231 | +68676 | 0.0714 |
| 2005 | 1.228 | +76133 | 0.0702 |
| 2010 | 1.111 | +42384 | 0.0354 |
| 2015 | 1.175 | +70601 | 0.0547 |
| 2020 | 1.136 | +59720 | 0.0435 |
| 2021 | 1.117 | +53710 | 0.0373 |
| 2022 | 1.172 | +84751 | 0.0540 |
| 2023 | 1.175 | +86251 | 0.0547 |
| 2024 | 1.180 | +91070 | 0.0567 |
Observation 7.2: The winter ratio was largest in 1965 (1.382) and smallest in 2010 (1.111). The excess count is largest in 2024 (91070), the largest of the 32 years in the table. From 1965 to 2024 the winter ratio fell from 1.382 to 1.180, but the excess rose from 78769 to 91070 (1.156 times), and annual deaths rose from 700438 to 1605378 (2.292 times). The winter swing became smaller, but because the usual size grew, the number added in winter increased.
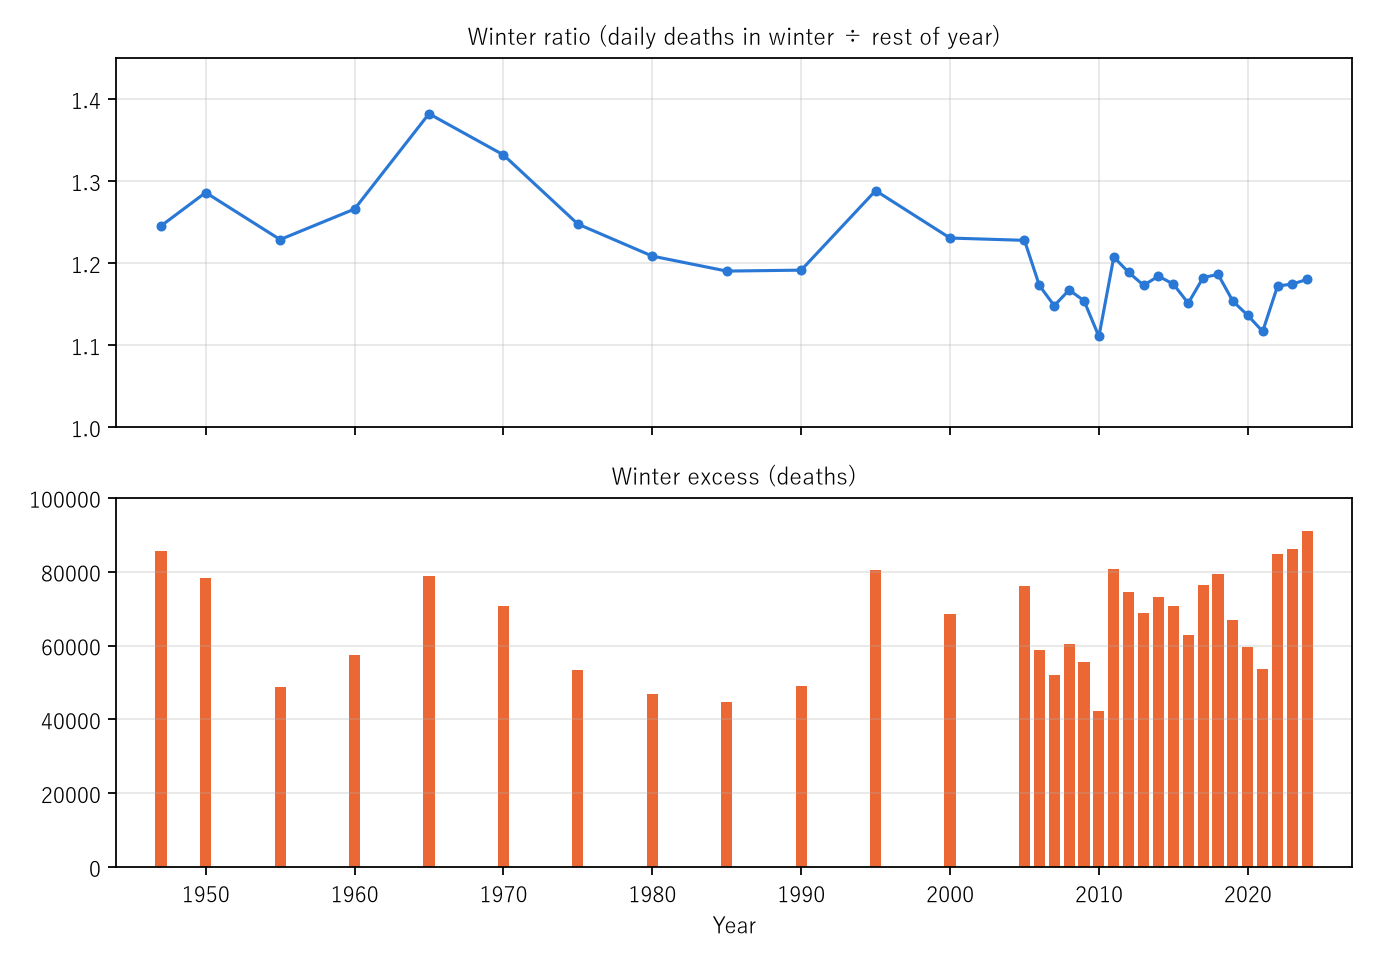
Figure 2: Top, the winter ratio; bottom, the winter excess (deaths). Every five years for 1947–2000 and every year from 2005. The top line peaks in 1965 and then falls, while the bottom bars are high from 2022.
8. Limitations
- The definition of winter is one choice. December–March is winter and April–November the baseline. In years with a summer rise (in 2024, 4272 deaths per day in August), the baseline is slightly higher.
- January–March and December of a calendar year belong to different winters. The figures describe the monthly shape of one calendar year.
- The ratio of deaths per day ignores population changes. It agreed with the rate-based ratio to within 0.006.
- Why deaths rise in winter is not examined. These tables do not separate reasons such as cold, epidemics of infection, or ways of living.
- Causes follow the underlying cause on the death certificate; each death counts under one cause only.
- What lies inside the growth in deaths (age composition and age-specific rates) is not split here; M001 showed how to split it.
- It is not one person's outlook.
Conclusion
Of the 91070 winter excess deaths in 2024, heart disease carried 0.264, with a winter ratio of 1.357. Influenza swung by 17.304 but carried 0.026 of the excess. Cancer barely swung (1.022) yet carried 2894 deaths. By age, too, ages 75 and over carried 0.837 of the excess because they account for 0.801 of the year's deaths. And although the winter ratio fell from 1.382 in 1965, the excess count was largest in 2024.
One thing separates them — how far a cause swings in winter and how large it usually is.
When you hear "a cause that rises in winter", ask whether it is a cause that swings a lot or a cause that carries many winter deaths. The two lists are not the same.
Data and reproduction
| Data | Ministry of Health, Labour and Welfare, Vital Statistics 2024 (final data), Volume 1 Tables 5.4 and 5.18, Volume 2 Table 5, Volume 3 Table 3 (e-Stat, accessed 26 September 2026) |
| Terms of use | e-Stat follows the Public Data License (Version 2.0). This paper's ratios and excess were produced by processing these and are not figures produced by the government |
| Scope | Japan; causes and ages by month for 2024; months for 32 years from 1947 to 2024 |
| Verification | 検算/M016.py (--zu also writes the figures). Every number in the text is taken from 検算/M016_output.txt |
| Raw data | The 4 retrieved files and SOURCES.md (URLs, retrieval dates, SHA-256, terms of use, how the calculation is set up) in data/ |
| Figures | 図/M016_zu1, 図/M016_zu2 (png, svg, English versions) |
References
- Ministry of Health, Labour and Welfare. Vital Statistics 2024 (final data), Volume 1, Table 5.4 and Table 5.18 (in Japanese). e-Stat (accessed 26 September 2026). https://www.e-stat.go.jp/
- Ministry of Health, Labour and Welfare. Vital Statistics 2024 (final data), Volume 2, Table 5, and Volume 3, Table 3 (in Japanese). e-Stat (accessed 26 September 2026). https://www.e-stat.go.jp/
- Yamagishi, Y. (2026). "The Death Rate Rose" Names Two Movements at Once, the Age Composition and the Age-Specific Rates [M001]. Zenodo. https://doi.org/10.5281/zenodo.22963112
Reference
Yamagishi, Y. (2026). The Cause That Swings Most in Winter Is Not the Cause That Carries Most of the Winter Excess [M016]. Zenodo.
DOI: 10.5281/zenodo.22967170
YOI: https://www.yamagishiyuuki.com/yoi/M016
ORCID: 0009-0006-8587-3450
PDF (English) · PDF (Japanese) · Date proof of the English PDF (OpenTimestamps .ots) · SHA256SUMS
The record page for this paper (in Japanese, with the PDFs in each language and the date proof): YOI M016. This paper is a preprint and has not been peer reviewed.