Abstract
This paper asks how much death rates differ by marital status (married, never married, widowed, divorced), and how far the size of that difference moves with age adjustment and with how the denominator is built. From deaths by marital status in Vital Statistics and population by marital status in the census (with the "unknown" category imputed and not imputed), death rates at ages 40 and over were compared for 2020, and the trend was followed over the six census years from 1995 to 2020. No new mathematical theorem or new law is claimed.
First, in 2020 there were 705027 deaths of men and 664579 of women aged 15 and over, and "unknown" marital status on the death side was small (0.0009 for men, 0.0005 for women). On the census side, however, the unknown share for men grew at every census, from 0.0067 in 1995 to 0.0479 in 2020 (Section 3).
Second, this is the core of the paper. At ages 40 and over in 2020, never-married men's death rate is 0.65 times the married rate without age adjustment and 1.66 times with it. For the widowed, 4.74 times shrinks to 1.47 times (for women, 8.83 to 1.66). The mean age of the population aged 40 and over is 54.5 for never-married men and 78.8 for widowed men, far from the 63.0 of married men (Section 5).
Third, by age, men's ratios fall with age: never married from 3.36 at 40–44 to 1.13 at 85+, divorced from 7.26 to 1.69. For women the ratios fall through 80–84 and rise at 85+ (never married 1.70 to 2.13) (Section 4).
Fourth, the ratio moves with the denominator. Dividing by the census population with unknowns imputed, men's never-married ratio is 1.66 and divorced 2.34; dividing by the unimputed population gives 1.99 and 2.78. From 2015 to 2020, men's never-married ratio appears to rise from 1.86 to 1.99 (+0.13) with the unimputed denominator but barely moves, 1.67 to 1.66 (−0.01), with the imputed one (Sections 6 and 7).
Fifth, the numbers can speak only to the size of the gap. Whether healthier people are more likely to marry, whether having a spouse protects health, or whether illness leads to separation — these tables do not separate them (Section 8).
Sixth, the separator is the age composition and how the unknowns in the denominator are handled. The single figure "death rates differ by X times by marital status" becomes 0.65 or 1.99 depending on these two choices.
Scope note: No new mathematical theorem or new law is claimed — age-adjusted death rates (direct method) are a known method; this paper applies it to published tables and measures how far the ratios move with age adjustment and with how the denominator is built. This paper is a structural interpretation describing the shape of numbers in public aggregate data; it is not medical advice, diagnosis, or a treatment recommendation. The author is not a physician. For decisions about individual health, consult a physician or medical institution. It is a preprint that has not been peer reviewed. It is not one person's outlook — all figures are national aggregate rates. It does not go into why death rates differ by marital status — these tables do not separate selection, protection, or illness coming first. Marital status is a different category from ways of living, living alone, or social ties, and this paper says nothing about any way of living being better or worse. Ages under 40 are not used because some marital categories have small death counts there (among the cells used at ages 40 and over, 0 have fewer than 10 deaths). About the data: the e-Stat Vital Statistics and census are used under the Public Data License (Version 2.0); this paper's rates and ratios were produced by processing them. Source: Ministry of Health, Labour and Welfare, Vital Statistics; Statistics Bureau of Japan, Population Census. What this paper adds is showing that the ratio of death rates by marital status can even change direction with age adjustment (never-married men move from below 1 to above 1), and measuring how far imputing the census "unknown" marital status moves the ratios and their trend.
1. Notation and question
- Marital status: the four categories used in both Vital Statistics and the census (married, never married, widowed, divorced). On the death side it comes from the death record; on the population side from census responses.
- Age-specific death rate: deaths in a year ÷ the census population on 1 October of that year × 100,000.
- Age-adjusted rate (direct method): the age-specific rates in the 10 groups at ages 40 and over (40–44 … 80–84, 85+), weighted by the age shares of that year's population of that sex aged 40 and over (all marital statuses).
- Ratio: each category's rate ÷ the married rate.
Question: How much do death rates differ by marital status, and how far does that "X times" move with age adjustment and with how the denominator is built?
Observation 1.1: Marital status is tied closely to age: the never married are concentrated at younger ages and the widowed at older ages. Comparing without age adjustment compares differences in age rather than in marital status (the same confusion between movements in age composition and in age-specific rates that M001 showed).
2. Survey and design
To be candid: the design was decided after looking at the tables.
| Content | |
|---|---|
| Deaths | Vital Statistics, Volume 2, Table 7: deaths aged 15+ by five-year age group, sex and marital status (1995, 2000, 2005, 2010, 2015, 2020) |
| Population | Census time series, Table 4: population aged 15+ by marital status (4 categories), five-year age group and sex; for 2015 and 2020, values with unknowns imputed are also given |
| Matching years | Population by marital status exists only in census years, so deaths were matched to census years |
| Ages | 10 groups from age 40; deaths at 85+ are combined (the census table tops out at 85+) |
| Main denominator | For 2020, the imputed values; the same calculation was also done with the unimputed values |
3. Data and checks
Calculation 3.1 The retrieved files were fixed by SHA-256, and the following were checked.
| Check | Result |
|---|---|
| Deaths (all 6 years) | Marital categories + unknown = total; sum over ages = total (by sex) |
| Deaths in 2020 (aged 15+) | Men 705027, women 664579; unknown marital status: men 635, women 324 |
| Share of deaths with unknown marital status | 1995 men 0.0026, women 0.0021 / 2020 men 0.0009, women 0.0005 |
| Census values with unknowns imputed (2015, 2020) | Sum of the 4 categories = total |
| Share of unknown marital status in the census (unimputed, men) | 1995 0.0067, 2000 0.0107, 2005 0.0166, 2010 0.0197, 2015 0.0294, 2020 0.0479 |
| Death counts in cells at ages 40+ | 0 cells with fewer than 10 |
Observation 3.2: Unknown marital status on the death side is small, but on the census side it grew over 25 years. Dropping the unknowns from the denominator shrinks the four categories and inflates their rates; because each category shrinks by a different amount, the ratios move too (Section 6).
4. Ratios by age
Calculation 4.1 Age-specific death rates in 2020 (per 100,000; imputed denominator) and ratios to the married (men)
| Age | Married | Never married | Widowed | Divorced | Ratio never married | Ratio widowed | Ratio divorced |
|---|---|---|---|---|---|---|---|
| 40–44 | 54.7 | 183.9 | 248.0 | 397.2 | 3.36 | 4.53 | 7.26 |
| 45–49 | 91.3 | 286.0 | 266.4 | 569.9 | 3.13 | 2.92 | 6.25 |
| 50–54 | 154.9 | 459.5 | 415.8 | 850.8 | 2.97 | 2.68 | 5.49 |
| 55–59 | 274.1 | 771.1 | 562.9 | 1268.3 | 2.81 | 2.05 | 4.63 |
| 60–64 | 501.6 | 1313.9 | 924.8 | 1858.1 | 2.62 | 1.84 | 3.70 |
| 65–69 | 921.8 | 2145.4 | 1585.3 | 2926.9 | 2.33 | 1.72 | 3.18 |
| 70–74 | 1557.2 | 3268.9 | 2307.0 | 4340.2 | 2.10 | 1.48 | 2.79 |
| 75–79 | 2864.3 | 5429.9 | 4009.4 | 7027.4 | 1.90 | 1.40 | 2.45 |
| 80–84 | 5112.1 | 8421.6 | 6639.7 | 10997.7 | 1.65 | 1.30 | 2.15 |
| 85+ | 11808.1 | 13310.1 | 16468.2 | 19907.8 | 1.13 | 1.39 | 1.69 |
Calculation 4.2 The same for women
| Age | Married | Never married | Widowed | Divorced | Ratio never married | Ratio widowed | Ratio divorced |
|---|---|---|---|---|---|---|---|
| 40–44 | 44.5 | 116.9 | 124.5 | 148.8 | 2.63 | 2.80 | 3.34 |
| 45–49 | 75.8 | 164.5 | 145.7 | 212.1 | 2.17 | 1.92 | 2.80 |
| 50–54 | 124.3 | 250.3 | 215.8 | 274.0 | 2.01 | 1.74 | 2.20 |
| 55–59 | 178.7 | 365.3 | 293.7 | 359.5 | 2.04 | 1.64 | 2.01 |
| 60–64 | 266.4 | 569.2 | 412.2 | 533.6 | 2.14 | 1.55 | 2.00 |
| 65–69 | 425.4 | 902.0 | 608.1 | 850.7 | 2.12 | 1.43 | 2.00 |
| 70–74 | 660.4 | 1305.6 | 918.6 | 1366.3 | 1.98 | 1.39 | 2.07 |
| 75–79 | 1199.3 | 2251.0 | 1622.3 | 2505.0 | 1.88 | 1.35 | 2.09 |
| 80–84 | 2310.9 | 3926.1 | 3038.1 | 4603.0 | 1.70 | 1.31 | 1.99 |
| 85+ | 5576.0 | 11899.6 | 10456.4 | 14215.9 | 2.13 | 1.88 | 2.55 |
Observation 4.3: For men, both the never-married and the divorced ratios fall with age from 40–44 to 85+ (never married 3.36 to 1.13, divorced 7.26 to 1.69). The ratio exceeds 1 at every age, but its size differs greatly by age.
Observation 4.4: Women's never-married ratio moves gently from 2.01 at 50–54 to 1.70 at 80–84 and rises to 2.13 at 85+. Because 85+ is a single combined group, age differences within it may enter the ratio, but this paper has not checked that.
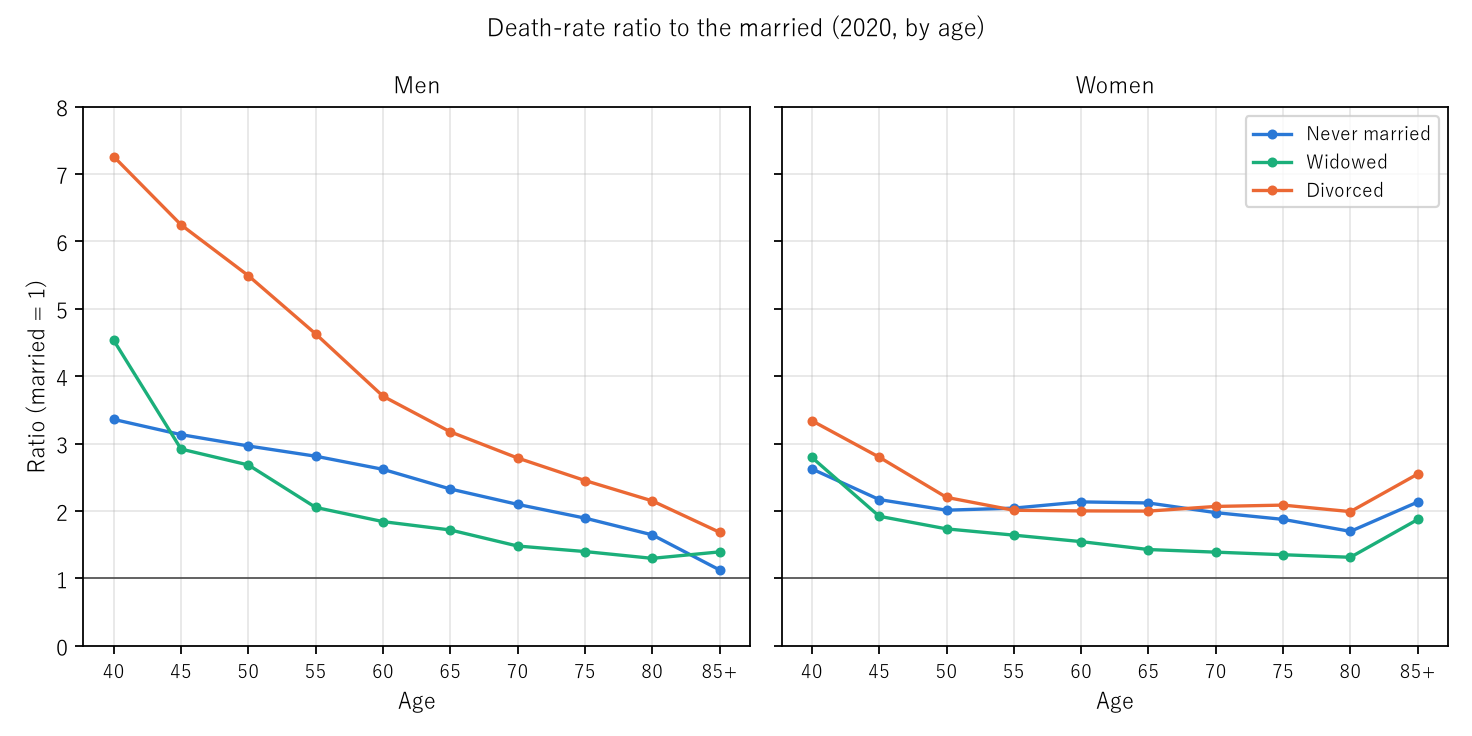
Figure 1: Age-specific ratios in 2020; men on the left, women on the right. Blue never married, green widowed, red divorced; the horizontal line is 1 (same as the married). Every line for men falls to the right.
5. Core — with or without age adjustment
Calculation 5.1 Rates at ages 40+ in 2020 (per 100,000) and ratios
| Sex | Married | Never married | Widowed | Divorced | Ratio never married | Ratio widowed | Ratio divorced | |
|---|---|---|---|---|---|---|---|---|
| Men | Not adjusted | 1624.2 | 1054.7 | 7696.6 | 2741.0 | 0.65 | 4.74 | 1.69 |
| Men | Age-adjusted | 1566.5 | 2607.6 | 2308.9 | 3670.3 | 1.66 | 1.47 | 2.34 |
| Women | Not adjusted | 581.0 | 959.4 | 5127.1 | 1345.5 | 1.65 | 8.83 | 2.32 |
| Women | Age-adjusted | 1042.9 | 2106.4 | 1731.7 | 2426.2 | 2.02 | 1.66 | 2.33 |
Calculation 5.2 Mean age of the population aged 40+ (group midpoints; 85+ set to 90)
| Sex | Married | Never married | Widowed | Divorced |
|---|---|---|---|---|
| Men | 63.0 | 54.5 | 78.8 | 60.9 |
| Women | 61.3 | 56.1 | 80.8 | 61.3 |
Observation 5.3: Never-married men's death rate looks lower than the married rate without age adjustment (0.65 times) and becomes 1.66 times with it — the direction reverses. Never-married men aged 40+ have a mean age of 54.5, younger than the 63.0 of married men, and a younger group has a lower death rate for that reason alone.
Observation 5.4: The widowed go the other way: 4.74 times for men and 8.83 for women without adjustment, but 1.47 and 1.66 with it, because the widowed are concentrated at old ages (mean age 78.8 and 80.8). The divorced have a mean age close to the married (60.9 for men, 61.3 for women), and for women the ratio barely changes, 2.32 without and 2.33 with adjustment.
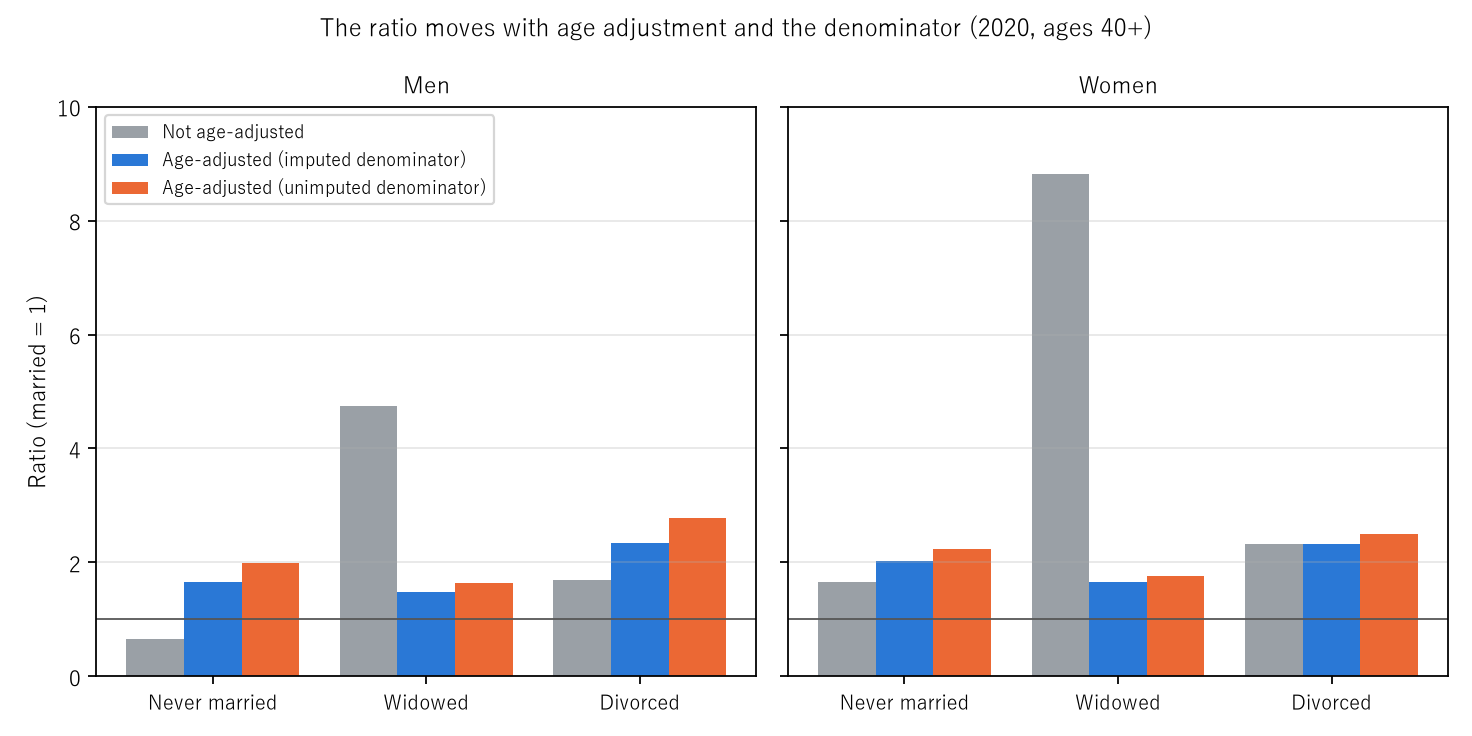
Figure 2: Ratios at ages 40+ in 2020. Grey, not age-adjusted; blue, age-adjusted with the imputed denominator; red, age-adjusted with the unimputed denominator. Only the widowed grey bars stand out, and only the never-married men's grey bar falls below 1.
6. Imputing the unknowns in the denominator, or not
Calculation 6.1 Age-adjusted ratios at ages 40+ in 2020
| Sex | Denominator | Ratio never married | Ratio widowed | Ratio divorced | Married rate |
|---|---|---|---|---|---|
| Men | Imputed | 1.66 | 1.47 | 2.34 | 1566.5 |
| Men | Unimputed | 1.99 | 1.64 | 2.78 | 1610.7 |
| Women | Imputed | 2.02 | 1.66 | 2.33 | 1042.9 |
| Women | Unimputed | 2.24 | 1.76 | 2.50 | 1087.8 |
Observation 6.2: With the same deaths, leaving the unknowns unimputed raises men's never-married ratio from 1.66 to 1.99 and the divorced ratio from 2.34 to 2.78. Dropping the unknowns shrinks every category, but by different amounts. The ratios move not only with how deaths are counted but also with how the population is counted.
7. Over time
Calculation 7.1 Age-adjusted ratios at ages 40+ over time
| Year | Denominator | Men never married | Men widowed | Men divorced | Women never married | Women widowed | Women divorced |
|---|---|---|---|---|---|---|---|
| 1995 | Unimputed | 2.24 | 1.48 | 2.35 | 2.68 | 1.34 | 1.74 |
| 2000 | Unimputed | 2.19 | 1.47 | 2.38 | 2.58 | 1.40 | 1.87 |
| 2005 | Unimputed | 2.08 | 1.47 | 2.34 | 2.47 | 1.47 | 2.03 |
| 2010 | Unimputed | 1.90 | 1.49 | 2.39 | 2.25 | 1.54 | 2.13 |
| 2015 | Unimputed | 1.86 | 1.53 | 2.50 | 2.18 | 1.62 | 2.33 |
| 2015 | Imputed | 1.67 | 1.45 | 2.27 | 2.07 | 1.58 | 2.27 |
| 2020 | Unimputed | 1.99 | 1.64 | 2.78 | 2.24 | 1.76 | 2.50 |
| 2020 | Imputed | 1.66 | 1.47 | 2.34 | 2.02 | 1.66 | 2.33 |
Observation 7.2: With the unimputed denominator, men's never-married ratio falls from 2.24 in 1995 to 1.86 in 2015 and rises to 1.99 in 2020. But the 2015–2020 rise (+0.13) almost disappears with the imputed denominator, 1.67 to 1.66 (−0.01). For women, +0.06 unimputed and −0.05 imputed. Because the 2015–2020 "rise" disappears with the imputed denominator, it cannot be read apart from the growth in census unknowns (men 0.0294 to 0.0479). For 1995–2010 there are no imputed values, so the same check cannot be made.
8. Limitations
- The numbers can speak only to the size of the gap. Whether healthier people are more likely to marry (selection), whether a spouse supports health (protection), or whether illness or disability precedes marriage or separation — this aggregate does not separate them.
- Marital status is recorded differently on the two sides. Deaths use the death record, population uses census responses; these tables cannot check whether the same person would fall into different categories in the two records.
- The ratios move with the handling of unknowns in the denominator (Section 6); there are no imputed values for 1995–2010.
- Only ages 40 and over are examined, with 85+ combined.
- The rates divide one census year's deaths by the 1 October population; they are not life-table figures or figures for one person's life.
- Marital status is a different category from ways of living, living with others, or social ties. This paper says nothing about any way of living being better or worse.
- It is not one person's outlook.
Conclusion
At ages 40 and over in 2020, never-married men's death rate was 0.65 times the married rate without age adjustment and 1.66 times with it. For the widowed, 4.74 times shrank to 1.47 times. By age, men's ratios fell with age, the never-married ratio from 3.36 at 40–44 to 1.13 at 85+. And with a denominator that leaves census "unknown" marital status unimputed, the never-married ratio rose to 1.99, while the 2015–2020 "rise" almost vanished with the imputed denominator.
Two things separate them — the age composition and how the unknowns in the denominator are handled.
When you hear "death rates differ by X times by marital status", check whether the figure is age-adjusted and how the denominator's unknowns were treated — and remember that the "X times" does not say why.
Data and reproduction
| Data | Ministry of Health, Labour and Welfare, Vital Statistics (final data), Volume 2, Table 7 (1995, 2000, 2005, 2010, 2015, 2020); Statistics Bureau of Japan, Population Census time series, Table 4 (both from e-Stat, accessed 26 September 2026) |
| Terms of use | e-Stat follows the Public Data License (Version 2.0). This paper's rates and ratios were produced by processing these and are not figures produced by the government |
| Scope | Japan, by sex, ages 40+, six census years |
| Verification | 検算/M017.py (--zu also writes the figures). Every number in the text is taken from 検算/M017_output.txt |
| Raw data | The 7 retrieved files and SOURCES.md (URLs, retrieval dates, SHA-256, terms of use, how the calculation is set up) in data/ |
| Figures | 図/M017_zu1, 図/M017_zu2 (png, svg, English versions) |
References
- Ministry of Health, Labour and Welfare. Vital Statistics (final data), Volume 2, Table 7 (1995, 2000, 2005, 2010, 2015, 2020) (in Japanese). e-Stat (accessed 26 September 2026). https://www.e-stat.go.jp/
- Statistics Bureau of Japan. Population Census time series, Table 4: Population aged 15 and over by marital status (4 categories), age (five-year groups) and sex (in Japanese). e-Stat (accessed 26 September 2026). https://www.e-stat.go.jp/
- Yamagishi, Y. (2026). "The Death Rate Rose" Names Two Movements at Once, the Age Composition and the Age-Specific Rates [M001]. Zenodo. https://doi.org/10.5281/zenodo.22963112
Reference
Yamagishi, Y. (2026). Never-Married Men's Death Rate Is 0.65 Times the Married Rate Without Age Adjustment and 1.66 Times With It [M017]. Zenodo.
DOI: 10.5281/zenodo.22967222
YOI: https://www.yamagishiyuuki.com/yoi/M017
ORCID: 0009-0006-8587-3450
PDF (English) · PDF (Japanese) · Date proof of the English PDF (OpenTimestamps .ots) · SHA256SUMS
The record page for this paper (in Japanese, with the PDFs in each language and the date proof): YOI M017. This paper is a preprint and has not been peer reviewed.