Abstract
This paper asks at which ages and from which causes the sex gap in life expectancy (women minus men) arises, and when it widened and narrowed. From Table 5.15 of Vital Statistics (deaths and death rates by cause, sex and five-year age group, for 24 years from 1950 to 2024), life tables for men and women were built with this paper's approximation, and the gap was split by age group and by 15 causes (Arriaga's decomposition, with each age group's contribution allocated by cause-specific differences in death rates). No new mathematical theorem or new law is claimed.
First, the published sex gap widened from 3.50 years in 1950 to 6.97 years in 2003 and is 6.04 years in 2024. This paper's life expectancies differ from the published values by at most 0.62 years, and the gap by at most 0.33 years (Section 3).
Second, this is the core of the paper. In this paper's life tables, the gap widened by 3.89 years from 1950 to 2005, and 0.890 of that came from ages 65 and over (65–79 +1.82, 80+ +1.64) (Section 4).
Third, from 2005 to 2024 the gap narrowed by 1.05 years, and 0.665 of that came from ages 40–64 (−0.70). Only ages 80+ kept widening, by +0.10. Where the gap widened and where it narrowed are not the same (Section 4).
Fourth, among the 15 causes, cancer was the largest both when the gap widened and when it narrowed: +2.18 years from 1950 to 2005 (0.562 of the widening) and −0.80 years from 2005 to 2024. In 1950 the largest causes of the gap were accidents (+0.78) and tuberculosis (+0.57); cancer was +0.10 (Section 5).
Fifth, the share of men's deaths outside the 15 causes rose from 0.148 in 2005 to 0.293 in 2024, and in 2024 this "other" is the largest term in the gap (+1.86). The 2005–2024 narrowing was −2.00 years summed over the 15 causes and +0.95 years for "other". Allocation to causes depends on what happens outside the classification (Section 6).
Sixth, the separator is at which ages, and from which causes, men's and women's death rates differ. The same "six-year gap" had different ages and causes inside it in 1950 and in 2024.
Scope note: No new mathematical theorem or new law is claimed — Arriaga's decomposition and allocating contributions by cause-specific differences in death rates are known methods; this paper applies them to published tables and measures how the ages and causes inside the sex gap moved. This paper is a structural interpretation describing the shape of numbers in public aggregate data; it is not medical advice, diagnosis, or a treatment recommendation. The author is not a physician. For decisions about individual health, consult a physician or medical institution. It is a preprint that has not been peer reviewed. It is not one person's outlook — all figures are period life-table figures (M003). It does not go into why men's and women's death rates differ (bodies, ways of living, ways of working). This paper's life tables are an approximation — built from five-year death rates, not the way the published life tables are made. The cause allocation is also an approximation — each age group's contribution is divided by the shares of cause-specific differences in death rates between men and women. Cells with fewer than 10 deaths are used in the shares but not shown in the text. About the data: the e-Stat Vital Statistics are used under the Public Data License (Version 2.0) and the Ministry website's figure data under its Public Data License (Version 1.0); this paper's life tables and decompositions were produced by processing them. Source: Ministry of Health, Labour and Welfare, Vital Statistics and the overview of the 2024 abridged life tables. What this paper adds is splitting the sex gap for 24 years from 1950 to 2024 with the same age groups and 15 causes, and showing that the ages inside it switched between the widening and the narrowing; measuring how much the growth of deaths outside the classification moves the cause allocation; and checking this paper's approximate life tables against published life expectancies.
1. Notation and question
- Sex gap in life expectancy: women's life expectancy minus men's in the same year; called "the gap" here.
- Arriaga's decomposition: splits the difference between two life tables' life expectancies into contributions by age group (the same formula as M013). Here the men's and women's life tables of the same year are compared. A positive contribution means that lower female death rates at those ages widen the gap.
- Allocation to causes: each age group's contribution is divided by the share that each cause's male–female difference in death rates takes in the all-cause difference. The 15 causes are the 16 in Table 5.15's cause-trend classification minus traffic accidents, which are a subset of accidents. The rest is "other".
Question: At which ages and from which causes does the sex gap arise, and is its content the same when it widened and when it narrowed?
Observation 1.1: The sex gap is one number, but its content is the sum of "at which ages and from which causes men's death rates exceed women's". Gaps of the same size can have different contents in different eras.
2. Survey and design
To be candid: the design was decided after looking at the tables.
| Content | |
|---|---|
| Deaths and rates | Table 5.15: the "all causes" sheet and 16 cause sheets; deaths and death rates (per 100,000) by sex and five-year age group; 24 years, every five years for 1950–2010 and every year for 2014–2024 |
| Population | Deaths ÷ death rate × 100,000 (from the "all causes" sheet); cause-specific rates are recomputed with this population |
| Age groups | Five-year groups from 0–4, with 90+ combined; results are shown in five groups: 0–14, 15–39, 40–64, 65–79, 80+ |
| Years compared | 1950; 2005, when the published gap was nearly at its maximum (the maximum, 2003, is not in Table 5.15); 2024 |
| Check | This paper's life expectancies against published values in Reference 2 of the overview |
3. Data and checks
Calculation 3.1 The retrieved files were fixed by SHA-256, and the following were checked.
| Check | Result |
|---|---|
| Published gap | 3.50 years in 1950, maximum 6.97 years (2003), 6.96 in 2005, 6.04 in 2024 |
| Published life expectancy | 1950 men 58.00, women 61.50 / 2005 men 78.56, women 85.52 / 2024 men 81.09, women 87.13 |
| This paper minus published | 1950 men −0.41, women −0.62 / 2005 men +0.14, women +0.35 / 2024 men +0.06, women +0.14; largest of 48 pairs 0.62 years |
| This paper's gap minus published gap | At most 0.33 years |
| Sum of age and cause contributions | Equals this paper's gap in every year (Arriaga's identity) |
Observation 3.2: Because this paper's life tables approximate from five-year groups, life expectancy is off by 0.62 years for women in 1950, but the gap stays within 0.33 years. This paper reads the shares inside the gap and how they move, for which the approximation suffices.
4. Core — widened at old ages, narrowed in middle age
Calculation 4.1 The gap split by age group (years)
| Gap | 0–14 | 15–39 | 40–64 | 65–79 | 80+ | |
|---|---|---|---|---|---|---|
| 1950 | 3.29 | +0.50 | +0.35 | +1.37 | +0.95 | +0.12 |
| 2005 | 7.18 | +0.09 | +0.50 | +2.05 | +2.78 | +1.76 |
| 2024 | 6.13 | +0.00 | +0.28 | +1.36 | +2.63 | +1.86 |
| 1950→2005 | +3.89 | −0.41 | +0.15 | +0.69 | +1.82 | +1.64 |
| 2005→2024 | −1.05 | −0.09 | −0.22 | −0.70 | −0.14 | +0.10 |
Observation 4.2: From 1950 to 2005 this paper's gap widened by 3.89 years, and 0.890 of that came from ages 65 and over (65–79 +1.82, 80+ +1.64). The 0–14 contribution shrank by −0.41 and reached +0.00 in 2024. Where the gap is made moved from children to old ages.
Observation 4.3: From 2005 to 2024 the gap narrowed by 1.05 years, and 0.665 of that came from ages 40–64 (−0.70). Ages 65–79 shrank only −0.14, and ages 80+ widened by +0.10. The narrowing started in middle age; at the oldest ages the gap is still widening.
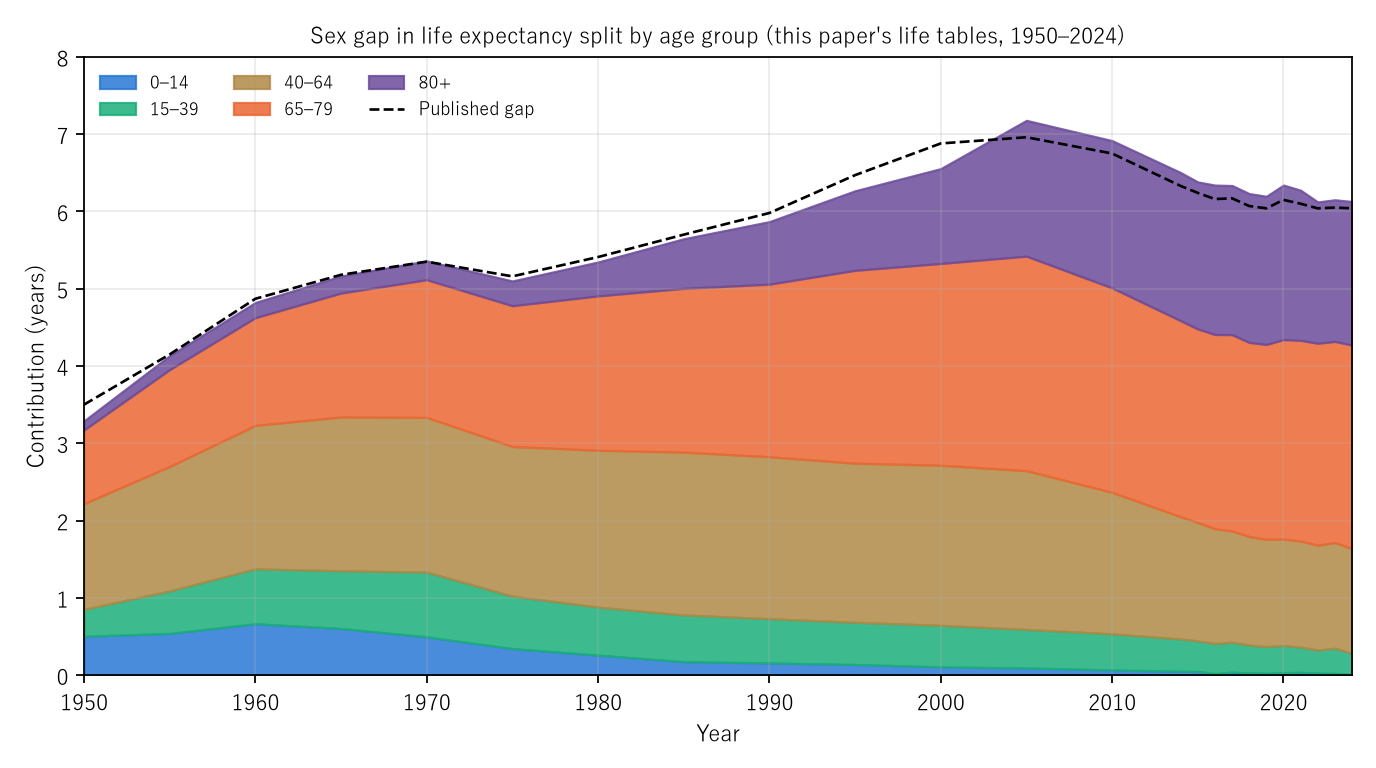
Figure 1: This paper's sex gap stacked as contributions by age group (1950–2024). Blue 0–14, green 15–39, brown 40–64, orange 65–79, purple 80+. The dashed line is the published gap. The brown band thins from around 2005, while the purple band stays thick.
5. By cause
Calculation 5.1 The gap split by cause (largest first, years)
| Year / interval | Largest first |
|---|---|
| 1950 (3.29) | accidents +0.78, tuberculosis +0.57, other +0.45, gastric ulcer +0.37, cerebrovascular +0.32, suicide +0.19, asthma +0.14, cancer +0.10, pneumonia +0.09 |
| 2005 (7.18) | cancer +2.28, heart disease +0.95, other +0.92, pneumonia +0.71, cerebrovascular +0.62, suicide +0.60, accidents +0.50, liver disease +0.21, chronic bronchitis +0.15 |
| 2024 (6.13) | other +1.86, cancer +1.48, heart disease +0.94, cerebrovascular +0.40, pneumonia +0.36, suicide +0.31, accidents +0.28, liver disease +0.20, renal failure +0.12 |
| 1950→2005 (+3.89) | cancer +2.18, heart disease +0.88, pneumonia +0.63, tuberculosis −0.54, other +0.46, suicide +0.41, gastric ulcer −0.34, cerebrovascular +0.30, accidents −0.28 |
| 2005→2024 (−1.05) | other +0.95, cancer −0.80, pneumonia −0.35, suicide −0.28, accidents −0.23, cerebrovascular −0.22, chronic bronchitis −0.09, renal failure +0.03, hypertensive disease +0.03 |
Observation 5.2: In 1950 the largest parts of the gap were accidents (+0.78) and tuberculosis (+0.57); cancer was +0.10. By 2005 cancer, at +2.28, had become the largest term.
Observation 5.3: Among the 15 causes, cancer was the largest both when the gap widened and when it narrowed. From 1950 to 2005 cancer contributed +2.18 years, 0.562 of the widening. From 2005 to 2024 cancer contributed −0.80 years, with pneumonia (−0.35), suicide (−0.28), accidents (−0.23) and cerebrovascular disease (−0.22) also narrowing.
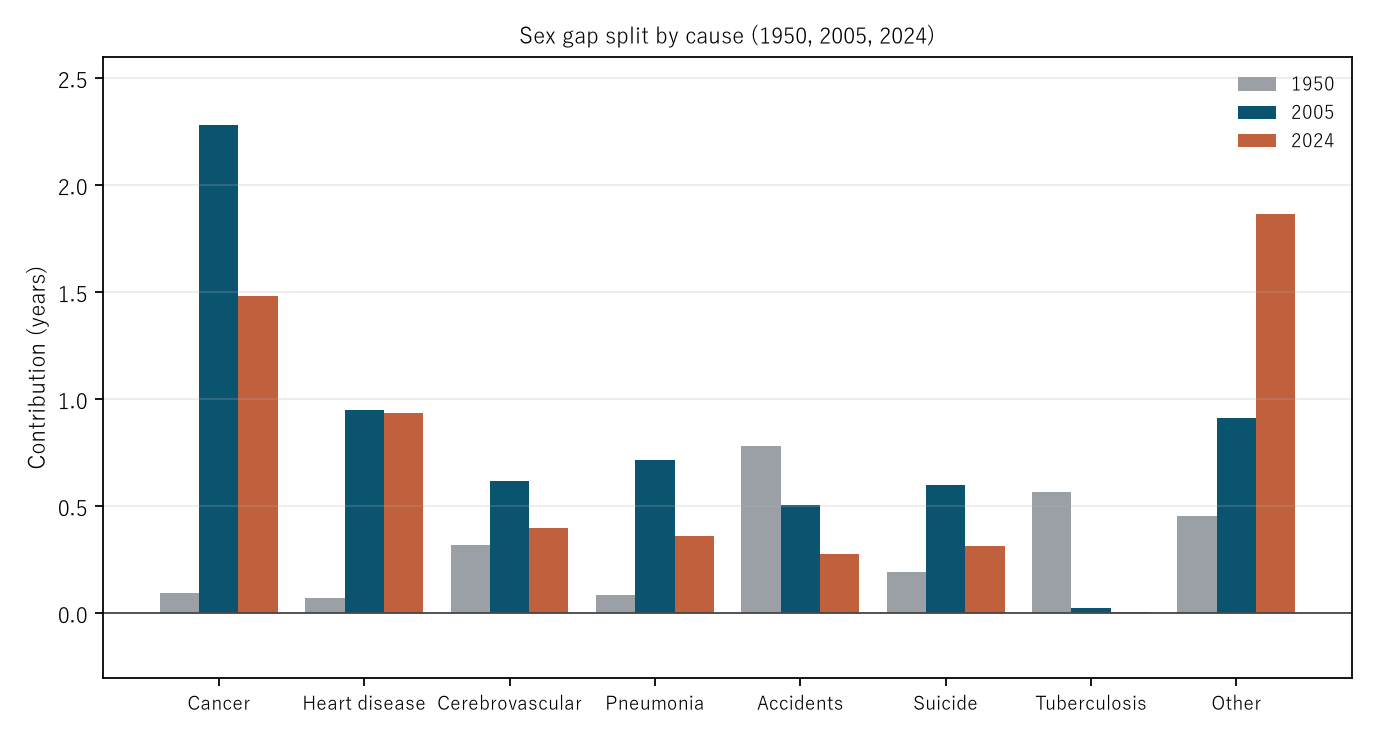
Figure 2: Contributions of the main causes to the gap in 1950, 2005 and 2024. Grey 1950, navy 2005, rust 2024. Cancer is high in 2005 and lower in 2024; tuberculosis is large only in 1950; "other" grows year by year.
6. Deaths outside the classification
Calculation 6.1 Share of deaths outside the 15 causes
| Year | Men | Women | Men's pneumonia deaths in this classification |
|---|---|---|---|
| 1950 | 0.360 | 0.380 | 28090 |
| 1985 | 0.110 | 0.122 | 25520 |
| 2005 | 0.148 | 0.170 | 57310 |
| 2016 | 0.211 | 0.221 | 65661 |
| 2017 | 0.229 | 0.236 | 53143 |
| 2024 | 0.293 | 0.270 | 46529 |
Observation 6.2: The share of deaths outside the 15 causes rose from 0.110 for men in 1985 to 0.293 in 2024. The table notes that total deaths include causes outside the cause-trend classification. From 2016 to 2017, men's pneumonia deaths in this classification fell from 65661 to 53143 while the outside share rose from 0.211 to 0.229. This paper does not go into the reason for this movement.
Observation 6.3: As a result, the largest term in the 2024 gap is "other" (+1.86), and the 2005–2024 narrowing split in opposite directions: −2.00 years summed over the 15 causes and +0.95 years for "other". The split by age does not depend on the classification, but the allocation to causes does. When comparing cause contributions across years, look at the size of "other" too.
7. Limitations
- These are period figures (M003).
- This paper's life tables are approximate: up to 0.62 years off published life expectancy, and up to 0.33 years off the published gap.
- The cause allocation is approximate: contributions are divided by shares of rate differences, and overlaps between causes (one person having several diseases) are not handled.
- Deaths outside the classification are large: 0.293 of men's deaths in 2024 fall outside the 15 causes.
- Why men's and women's death rates differ is not examined.
- Published values are complete life tables for 2005 and abridged life tables for 1950 and 2024; values up to 1971 exclude Okinawa (overview table note). Deaths of unknown age were excluded.
- It is not one person's outlook.
Conclusion
In this paper's life tables, the sex gap in life expectancy widened by 3.89 years from 1950 to 2005, and 0.890 of that came from ages 65 and over. From 2005 to 2024 it narrowed by 1.05 years, 0.665 of that from ages 40–64, while ages 80+ alone widened by +0.10. Among the 15 causes, cancer was the largest both in the widening and in the narrowing. But deaths outside the 15 causes rose to 0.293 for men and are now the largest term in the 2024 gap.
One thing separates them — at which ages, and from which causes, men's and women's death rates differ.
When you hear "the gap between men's and women's lifespans has narrowed", ask at which ages it narrowed and at which ages it is still widening. The same six-year gap held different contents in 1950 and in 2024.
Data and reproduction
| Data | Ministry of Health, Labour and Welfare, Vital Statistics 2024 (final data), Volume 1, Table 5.15 (e-Stat, accessed 25 September 2026); overview of the 2024 abridged life tables, figure data, Reference 2 (Ministry website https://www.mhlw.go.jp/toukei/saikin/hw/life/life24/index.html , accessed 25 September 2026) |
| Terms of use | e-Stat follows the Public Data License (Version 2.0) and the Ministry website its Public Data License (Version 1.0). This paper's life tables and decompositions were produced by processing these and are not figures produced by the government |
| Scope | Japan, by sex, 24 years from 1950 to 2024, five-year age groups, 15 causes and "other" |
| Verification | 検算/M015.py (--zu also writes the figures). Every number in the text is taken from 検算/M015_output.txt |
| Raw data | The 2 retrieved files and SOURCES.md (URLs, retrieval dates, SHA-256, terms of use, how the calculation is set up) in data/ |
| Figures | 図/M015_zu1, 図/M015_zu2 (png, svg, English versions) |
References
- Ministry of Health, Labour and Welfare. Vital Statistics 2024 (final data), Volume 1, Table 5.15 (in Japanese). e-Stat (accessed 25 September 2026). https://www.e-stat.go.jp/
- Ministry of Health, Labour and Welfare. Overview of the 2024 Abridged Life Tables, figure data, Reference 2 (in Japanese; accessed 25 September 2026). https://www.mhlw.go.jp/toukei/saikin/hw/life/life24/xls/life24-13.xlsx
- Yamagishi, Y. (2026). Life Expectancy Is Not the Number of Years Anyone Actually Lives [M003]. Zenodo. https://doi.org/10.5281/zenodo.22963485
- Yamagishi, Y. (2026). Gains in Life Expectancy Came First from Fewer Deaths at Young Ages, Now from Fewer at Old Ages [M013]. Zenodo. https://doi.org/10.5281/zenodo.22966888
Reference
Yamagishi, Y. (2026). The Sex Gap in Life Expectancy Widened at Ages 65 and Over and Narrowed at Ages 40–64 [M015]. Zenodo.
DOI: 10.5281/zenodo.22967085
YOI: https://www.yamagishiyuuki.com/yoi/M015
ORCID: 0009-0006-8587-3450
PDF (English) · PDF (Japanese) · Date proof of the English PDF (OpenTimestamps .ots) · SHA256SUMS
The record page for this paper (in Japanese, with the PDFs in each language and the date proof): YOI M015. This paper is a preprint and has not been peer reviewed.