Abstract
This paper asks from which ages the content of "Japan, the country of long life" comes. Using the life tables (five-year age groups) of the United Nations World Population Prospects 2024, the life-expectancy gaps between Japan and 11 high-income countries (Korea, Australia, Canada, France, Germany, Italy, Spain, Sweden, Switzerland, the UK and the USA) were split into contributions by age group (Arriaga's decomposition). No new mathematical theorem or new law is claimed.
First, WPP's life expectancy for Japan agrees with the Ministry of Health, Labour and Welfare's published values within 0.08 years for 1990–2019. For 2023, however, it is 0.60 years higher, so this paper mainly uses 2019. Within the tables, life expectancy and the life-table columns agree (Section 3).
Second, this is the core of the paper. In 2019 Japanese women's life expectancy ranked first among the 12 countries, 2.70 years above the average of the 11. Of that gap, 0.772 came from fewer deaths at ages 65 and over, and the contributions at 65–79 and 80+ are positive against every one of the 11 countries (Sections 4 and 5).
Third, Japanese men ranked second of 12 (Switzerland was higher), 1.23 years above the average of the 11. The largest part of the gap is at ages 40–64 (0.345), while ages 65 and over account for only 0.382. Against some countries, Japanese men are on the shorter side in some age groups (Sections 4 and 5).
Fourth, Japan's lead moved in opposite directions by sex. Against the average of the 11 countries, men's lead shrank from 3.20 years in 1990 to 1.23 in 2019, falling in every age group except 80+. Women's lead widened from 2.34 to 2.70 years, and the widening came from ages 80+ (+0.92) (Section 6).
Fifth, the content changes with the comparison country. The gap is largest against the USA for both sexes (women +5.96, men +4.91), with ages 40–64 and 65–79 contributing most. Against Switzerland, Japanese men are 0.53 years shorter (Section 4).
Sixth, the separator is sex and at which ages deaths are fewer. The single phrase "Japan, the country of long life" contains both women's fewer deaths at old ages and men's shrunken lead.
Scope note: No new mathematical theorem or new law is claimed — Arriaga's decomposition is a known method; this paper applies it to United Nations life tables and measures the age content of Japan's lead. This paper is a structural interpretation describing the shape of numbers in public aggregate data; it is not medical advice, diagnosis, or a treatment recommendation. The author is not a physician. For decisions about individual health, consult a physician or medical institution. It is a preprint that has not been peer reviewed. It is not one person's outlook — all figures are life-table figures that assume each year's mortality stays constant (M003). It does not go into why deaths are fewer at those ages (medicine, diet, living conditions, how statistics are produced) and says nothing about any country's medicine or ways of living being better or worse. WPP life tables are United Nations estimates and do not match each country's published life tables; for Japan they were checked against published values. About the data: the United Nations World Population Prospects 2024 is used under CC BY 3.0 IGO and the Ministry website's figure data under its Public Data License (Version 1.0); this paper's decompositions were produced by processing them. Sources: United Nations, World Population Prospects 2024; Ministry of Health, Labour and Welfare, overview of the 2024 abridged life tables. What this paper adds is splitting the life-expectancy gaps between Japan and 11 countries with the same age groups and showing that women's lead is concentrated at ages 65+ while men's is spread across ages; showing that from 1990 to 2019 men's lead shrank while women's widened at ages 80+; and checking WPP's values for Japan against published life expectancy.
1. Notation and question
- Life-expectancy gap: Japan's life expectancy minus the comparison country's (same year, same sex); positive means Japan is longer.
- Arriaga's decomposition: splits the difference between two life tables' life expectancies into contributions by age group (the same formula as M013). A positive contribution means that fewer deaths in Japan at those ages widen the gap; the contributions sum exactly to the gap.
- Age groups: 0–4, 5–39, 40–64, 65–79, 80+.
- Average of the 11 countries: the average of the gaps and contributions against each of the 11 countries.
Question: At which ages are deaths fewer in Japan, making its life expectancy longer? Is that the same for men and women, and how did it change over time?
Observation 1.1: A life-expectancy gap is one number, but its content is the sum of "at which ages Japan has fewer deaths than the other country". "Japan is longer" means different things depending on whether it comes from young or old ages.
2. Survey and design
To be candid: the design was decided after looking at the tables.
| Content | |
|---|---|
| Life tables | United Nations World Population Prospects 2024 life tables (five-year groups, with ages 0 and 1–4 separate, 100+); rows for 12 countries and 5 years were extracted from the original 144 MB file |
| Countries compared | 11 high-income countries: Korea, Australia, Canada, France, Germany, Italy, Spain, Sweden, Switzerland, UK, USA |
| Main year | 2019 (before the COVID-19 pandemic); trends use 1990, 2000, 2010 and 2019 |
| Check | Japan's values against the Ministry's published life expectancy (Reference 2 of the overview) |
| Not used | The Human Mortality Database (use requires registration) |
3. Data and checks
Calculation 3.1 The retrieved files were fixed by SHA-256, and the following were checked.
| Check | Result |
|---|---|
| Completeness | 12 countries, 5 years, men, women and both sexes; every table has 22 age groups |
| Internal consistency | Life expectancy = cumulative stationary population ÷ survivors (largest difference 0.00005) |
| Arriaga's identity | For every country and year, contributions sum to the gap within 0.001 |
| WPP Japan − published (men, women) | 1990 +0.02, −0.04 / 2000 −0.04, −0.08 / 2010 −0.04, −0.07 / 2019 −0.05, −0.02 / 2023 +0.60, +0.60 |
Observation 3.2: WPP's life expectancy for Japan differs from the published values by at most 0.08 years in 1990–2019, but for 2023 it is 0.60 years higher for both sexes. The published 2023 values are 81.09 for men and 87.14 for women; the reason for the gap has not been checked here. 2023 is not used in the decomposition.
4. Life expectancy in 2019 and the content of the gaps
Calculation 4.1 Life expectancy in 2019 (WPP, years)
| Sex | Highest first |
|---|---|
| Women | Japan 87.43, Korea 86.74, Spain 86.14, France 85.57, Switzerland 85.56, Italy 85.40, Australia 85.28, Sweden 84.73, Canada 84.36, Germany 83.54, UK 83.28, USA 81.47 |
| Men | Switzerland 81.90, Japan 81.36, Sweden 81.35, Australia 81.21, Italy 81.14, Spain 80.74, Korea 80.34, Canada 80.17, France 79.75, UK 79.55, Germany 78.83, USA 76.45 |
Calculation 4.2 Japan minus each country, split by age group (2019, women, years)
| Country | Gap | 0–4 | 5–39 | 40–64 | 65–79 | 80+ |
|---|---|---|---|---|---|---|
| Korea | +0.69 | +0.03 | −0.17 | −0.49 | +0.81 | +0.52 |
| Australia | +2.15 | +0.07 | +0.09 | +0.33 | +0.69 | +0.97 |
| Canada | +3.07 | +0.18 | +0.24 | +0.62 | +1.18 | +0.85 |
| France | +1.86 | +0.12 | +0.03 | +0.60 | +0.51 | +0.60 |
| Germany | +3.89 | +0.08 | +0.01 | +0.71 | +1.44 | +1.66 |
| Italy | +2.03 | +0.02 | −0.11 | +0.16 | +0.70 | +1.26 |
| Spain | +1.29 | +0.03 | −0.10 | +0.15 | +0.31 | +0.90 |
| Sweden | +2.70 | −0.01 | +0.04 | +0.22 | +1.09 | +1.36 |
| Switzerland | +1.87 | +0.10 | −0.10 | +0.04 | +0.67 | +1.16 |
| UK | +4.15 | +0.14 | +0.13 | +0.90 | +1.54 | +1.44 |
| USA | +5.96 | +0.29 | +0.65 | +1.76 | +1.94 | +1.31 |
Calculation 4.3 The same for men
| Country | Gap | 0–4 | 5–39 | 40–64 | 65–79 | 80+ |
|---|---|---|---|---|---|---|
| Korea | +1.02 | +0.06 | −0.35 | −0.01 | +0.84 | +0.48 |
| Australia | +0.16 | +0.13 | +0.28 | +0.19 | −0.37 | −0.07 |
| Canada | +1.19 | +0.24 | +0.50 | +0.38 | +0.10 | −0.03 |
| France | +1.61 | +0.19 | +0.27 | +0.97 | +0.20 | −0.01 |
| Germany | +2.54 | +0.12 | +0.05 | +0.91 | +0.95 | +0.51 |
| Italy | +0.22 | +0.04 | −0.07 | −0.08 | +0.02 | +0.31 |
| Spain | +0.63 | +0.06 | −0.12 | +0.34 | +0.19 | +0.15 |
| Sweden | +0.02 | −0.01 | +0.12 | −0.34 | −0.09 | +0.32 |
| Switzerland | −0.53 | +0.11 | −0.09 | −0.34 | −0.27 | +0.06 |
| UK | +1.81 | +0.18 | +0.27 | +0.64 | +0.40 | +0.33 |
| USA | +4.91 | +0.36 | +1.39 | +2.01 | +0.92 | +0.24 |
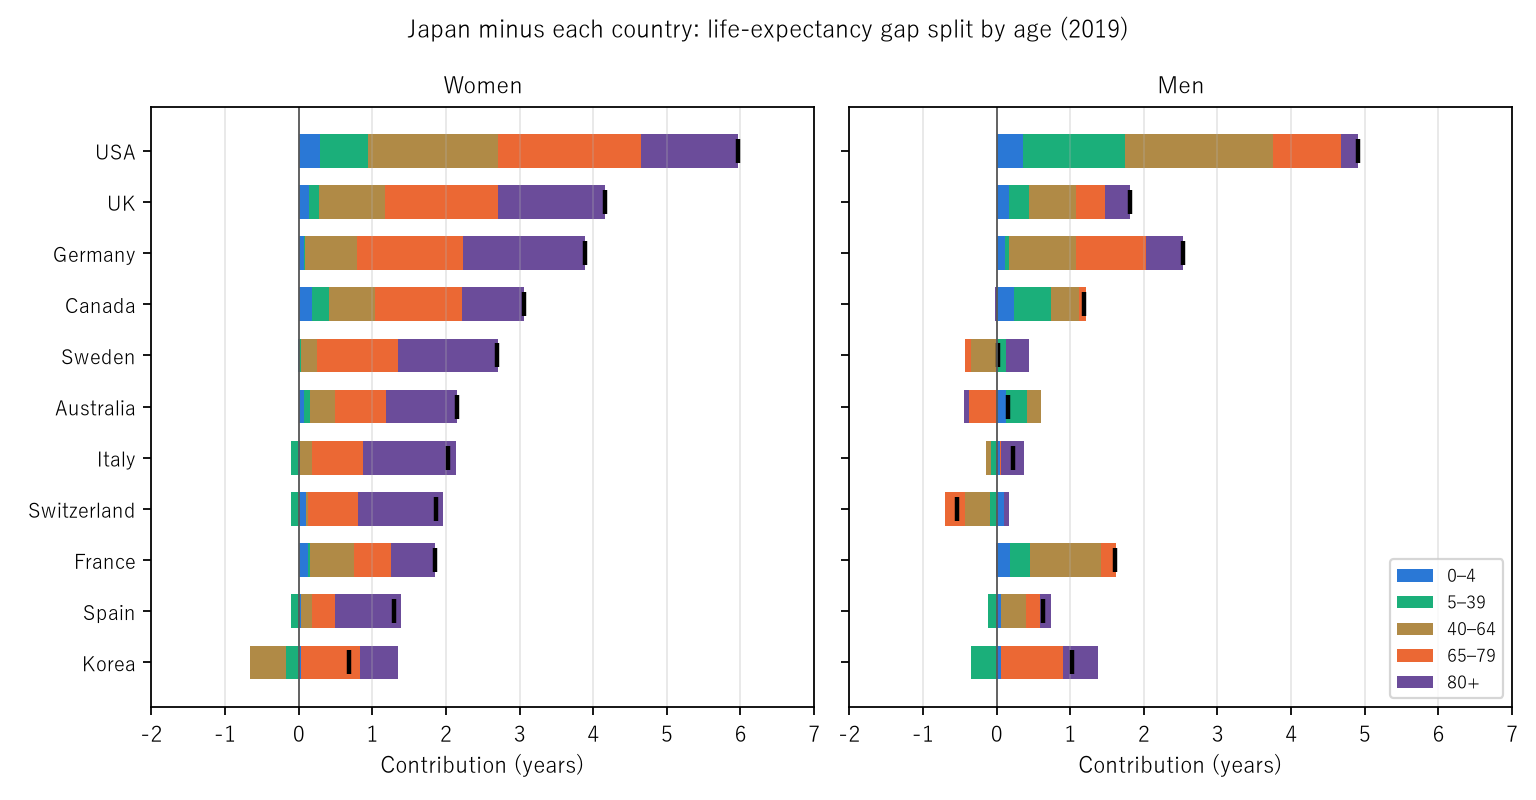
Figure 1: The age content of Japan minus each country in 2019; women on the left, men on the right. Blue 0–4, green 5–39, brown 40–64, orange 65–79, purple 80+; the black vertical mark is the gap itself. For women, orange and purple extend to the right against every country; for men, the colours differ by country and some extend to the left (Japan shorter).
5. Core — women at old ages, men spread out
Calculation 5.1 Contributions against the average of the 11 countries (2019)
| Sex | Average gap | 0–4 | 5–39 | 40–64 | 65–79 | 80+ |
|---|---|---|---|---|---|---|
| Women (years) | +2.70 | +0.10 | +0.06 | +0.45 | +0.99 | +1.09 |
| Women (share) | 0.035 | 0.024 | 0.169 | 0.366 | 0.405 | |
| Women (countries negative) | 1 | 4 | 1 | 0 | 0 | |
| Men (years) | +1.23 | +0.13 | +0.20 | +0.43 | +0.26 | +0.21 |
| Men (share) | 0.108 | 0.165 | 0.345 | 0.213 | 0.169 | |
| Men (countries negative) | 1 | 4 | 4 | 3 | 3 |
Observation 5.2: Of women's 2.70-year gap, 0.772 comes from ages 65 and over, and the contributions at 65–79 and 80+ are positive against every one of the 11 countries. Japanese women's longevity is made by fewer deaths at old ages.
Observation 5.3: Men's 1.23-year gap is spread across ages; the largest part is at 40–64 (0.345), and ages 65+ account for only 0.382. In each of the 40–64, 65–79 and 80+ groups, Japanese men are on the shorter side against 3–4 countries; for women, 0 countries have a negative contribution at 65+.
6. Trends — men's lead shrank, women's widened at 80+
Calculation 6.1 Average gap and contributions against the 11 countries over time (years)
| Sex | Year | Average gap | 0–4 | 5–39 | 40–64 | 65–79 | 80+ |
|---|---|---|---|---|---|---|---|
| Women | 1990 | +2.34 | +0.24 | +0.28 | +0.75 | +0.90 | +0.17 |
| Women | 2000 | +2.93 | +0.11 | +0.14 | +0.59 | +1.11 | +0.98 |
| Women | 2010 | +2.61 | +0.11 | +0.01 | +0.45 | +0.96 | +1.08 |
| Women | 2019 | +2.70 | +0.10 | +0.06 | +0.45 | +0.99 | +1.09 |
| Women | 1990→2019 | +0.36 | −0.14 | −0.22 | −0.29 | +0.09 | +0.92 |
| Men | 1990 | +3.20 | +0.29 | +0.76 | +1.05 | +0.97 | +0.14 |
| Men | 2000 | +2.02 | +0.13 | +0.36 | +0.53 | +0.67 | +0.34 |
| Men | 2010 | +0.96 | +0.12 | +0.07 | +0.29 | +0.30 | +0.18 |
| Men | 2019 | +1.23 | +0.13 | +0.20 | +0.43 | +0.26 | +0.21 |
| Men | 1990→2019 | −1.97 | −0.15 | −0.55 | −0.62 | −0.71 | +0.07 |
Observation 6.2: Men's lead shrank from 3.20 years in 1990 to 1.23 in 2019, in every age group except 80+ (+0.07). Japanese men's life expectancy also rose, from 75.92 years in 1990 to 81.41 in 2019 (published values); the lead shrank because the other countries' gains were larger.
Observation 6.3: Women's lead widened from 2.34 to 2.70 years, and the widening came from ages 80+ (+0.92). Contributions at 0–64 shrank, as for men. Japanese women's lead moved to older ages over time.
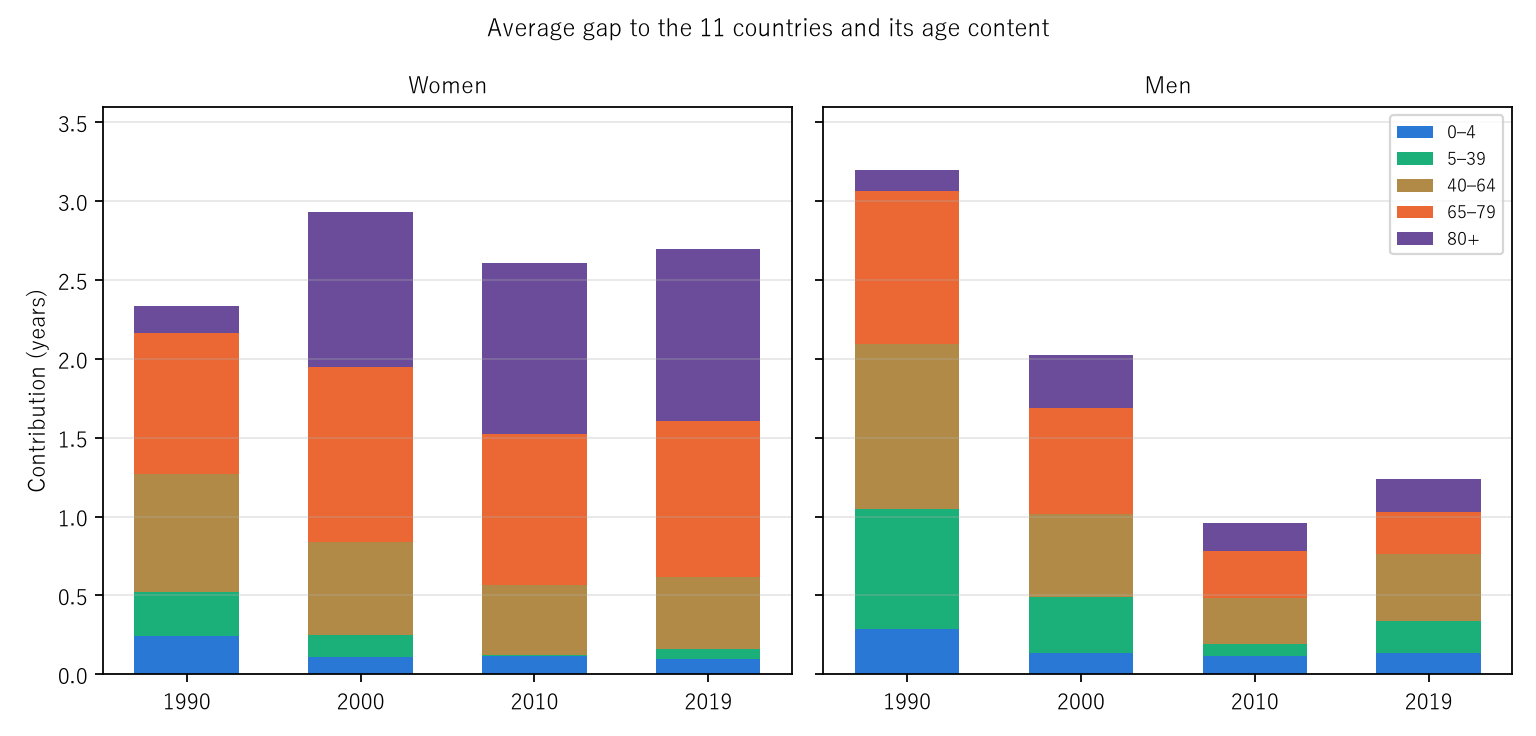
Figure 2: The average gap to the 11 countries stacked as contributions by age group (1990, 2000, 2010, 2019); women on the left, men on the right. For women the purple band (80+) thickens; for men the whole bar gets lower.
7. Limitations
- WPP life tables are United Nations estimates. For Japan they were within 0.08 years of published values in 1990–2019 but 0.60 years off in 2023; other countries were not checked against their published values.
- These are period figures (M003).
- Why deaths are fewer at those ages is not examined. These tables do not separate medicine, diet, living conditions, cause-of-death structure or how statistics are produced.
- The average depends on the choice of countries; this paper chose 11 high-income countries.
- Observation 6.2 describes how the life-expectancy gap shrank; the trends in each country's age-specific death rates are not shown here.
- It is not one person's outlook.
Conclusion
In 2019 Japanese women's life expectancy ranked first among the 12 countries, 2.70 years above the average of the 11, and 0.772 of that came from fewer deaths at ages 65 and over. Japanese men ranked second; their 1.23-year lead was spread across ages, largest at 40–64. From 1990 to 2019, men's lead shrank from 3.20 to 1.23 years, while women's widened at ages 80+.
Two things separate them — sex, and at which ages deaths are fewer.
When you hear "Japan, the country of long life", ask whether it is about women at old ages or men in middle age. The same phrase holds stories about different ages.
Data and reproduction
| Data | United Nations, Department of Economic and Social Affairs, Population Division (2024). World Population Prospects 2024 life tables (five-year groups, https://population.un.org/wpp/ ); Ministry of Health, Labour and Welfare, overview of the 2024 abridged life tables, figure data, Reference 2 (Ministry website) (both accessed 26 September 2026) |
| Terms of use | WPP 2024 is CC BY 3.0 IGO; the Ministry website follows its Public Data License (Version 1.0). This paper's decompositions were produced by processing these and are not figures produced by the United Nations or the government |
| Scope | 12 countries, by sex, 1990, 2000, 2010, 2019 (2023 used only as a check) |
| Verification | 検算/M018.py (--zu also writes the figures). Every number in the text is taken from 検算/M018_output.txt. The extraction is 検算/extract_wpp.py |
| Raw data | The extracted CSV, the overview table and SOURCES.md (URLs, retrieval dates, SHA-256 of the original file and the extract, terms of use, how the calculation is set up) in data/ |
| Figures | 図/M018_zu1, 図/M018_zu2 (png, svg, English versions) |
References
- Ministry of Health, Labour and Welfare. Overview of the 2024 Abridged Life Tables, figure data, Reference 2 (in Japanese; accessed 26 September 2026). https://www.mhlw.go.jp/toukei/saikin/hw/life/life24/xls/life24-13.xlsx
- United Nations, Department of Economic and Social Affairs, Population Division. World Population Prospects 2024 (accessed 26 September 2026). https://population.un.org/wpp/
- Yamagishi, Y. (2026). Life Expectancy Is Not the Number of Years Anyone Actually Lives [M003]. Zenodo. https://doi.org/10.5281/zenodo.22963485
- Yamagishi, Y. (2026). Gains in Life Expectancy Came First from Fewer Deaths at Young Ages, Now from Fewer at Old Ages [M013]. Zenodo. https://doi.org/10.5281/zenodo.22966888
Reference
Yamagishi, Y. (2026). Japanese Women's Longevity Arises at Ages 65 and Over, and Japanese Men's Lead Shrank from 3.20 Years in 1990 to 1.23 [M018]. Zenodo.
DOI: 10.5281/zenodo.22967659
YOI: https://www.yamagishiyuuki.com/yoi/M018
ORCID: 0009-0006-8587-3450
PDF (English) · PDF (Japanese) · Date proof of the English PDF (OpenTimestamps .ots) · SHA256SUMS
The record page for this paper (in Japanese, with the PDFs in each language and the date proof): YOI M018. This paper is a preprint and has not been peer reviewed.