Abstract
This paper asks what carries the changes in the ranking of causes of death, told as "tuberculosis, then cerebrovascular disease, then cancer". Using the Vital Statistics tables by cause-trend classification (crude death rates 1950–2024 and age-adjusted death rates), the published ranking of causes, and the table of how the classification changed, it measures the ranking by crude rates, the ranking by age-adjusted rates and the steps in the years when the classification changed. No new mathematical theorem or new law is claimed.
First, the leading cause among this paper's 15 causes by crude rate matches the published leading cause in all 75 years since 1950. The leader changed from tuberculosis (1950) to cerebrovascular disease (from 1951) and cancer (from 1981) (Sections 3 and 4).
Second, this is the core of the paper. In 1950 the leading cause by crude rate was tuberculosis for both sexes, but adjusted to the age structure of the 2015 population the leader is old age for both sexes (men 1076.9, women 937.0), and tuberculosis is fifth. The 1950 ranking was a ranking in a young population. In 2024, by contrast, the top six are in the same order with or without age adjustment for both sexes (Section 5).
Third, cancer's crude rate rose 1.448 times for men and 1.609 times for women from 1995 to 2024, but its age-adjusted rate fell to 0.693 and 0.789 times. "Cancer death rates rose" is a movement in age composition (Section 6).
Fourth, in years when the classification or the death certificate changed, there are steps of a different order from usual years. Heart disease moved −0.117 in 1993–1994 and −0.129 in 1994–1995 (4.9 and 5.5 times the usual yearly change), cerebrovascular disease +0.217 in 1994–1995 (8.3 times), and pneumonia −0.186 in 2016–2017 (7.1 times). 1995 is the year the 10th revision came into use (Section 7).
Fifth, some of the ranking changes happened in these step years. Second and third place swapped between cerebrovascular and heart disease in 1995 and swapped back in 1997; third place moved from pneumonia to cerebrovascular disease in 2017 and to old age in 2018 (Sections 4 and 7).
Sixth, the separator is age composition and classification. The ranking of causes changes not only because age-specific rates move but also with the age shape of the population and at the seams in how causes are counted.
Scope note: No new mathematical theorem or new law is claimed — age-adjusted death rates and the history of the cause classification are published; this paper lines them up and measures where ranking changes come from. This paper is a structural interpretation describing the shape of numbers in public aggregate data; it is not medical advice, diagnosis, or a treatment recommendation. The author is not a physician. For decisions about individual health, consult a physician or medical institution. It is a preprint that has not been peer reviewed. It is not one person's outlook — all figures are national aggregate rates. It does not go into why rates of a cause moved (medicine, hygiene, living conditions). Whether a step is due to a classification or certificate change can be said only as far as the table notes and the timing coincide — for the 1994 fall in heart disease, the table note says it is considered an effect of advance notice of a caution on the new death certificate. This paper's 15 causes are the cause-trend classification, which differs from the classification used for the published ranking (which counts aspiration pneumonia and others separately). About the data: the e-Stat Vital Statistics are used under the Public Data License (Version 2.0); this paper's rankings and steps were produced by processing them. Source: Ministry of Health, Labour and Welfare, Vital Statistics. What this paper adds is lining up crude and age-adjusted rankings in the same years and showing that the 1950 leader changes with age composition, and measuring the steps in classification-change years in multiples of usual yearly change and matching them to the years of ranking changes.
1. Notation and question
- Crude rate: deaths ÷ that year's population × 100,000; affected by the population's age shape.
- Age-adjusted rate: age-specific rates weighted by a fixed age shape (here the 2015 model population); published values.
- Step: the proportional change from the previous year divided by the usual size of yearly change for the same cause (median over surrounding years).
- Causes: the 15 causes of the cause-trend classification (traffic accidents excluded as a subset of accidents).
Question: Do changes in the ranking of causes come from movements in age-specific rates, the age composition of the population, or changes in cause classification?
Observation 1.1: The crude-rate ranking says "which cause is common in that year's population"; the age-adjusted ranking says "which cause is common in a population of the same age shape". A cause common at old ages looks low in the crude rate of a young population.
2. Survey and design
To be candid: the design was decided after looking at the tables.
| Content | |
|---|---|
| Crude rates | Table 5.12: deaths and death rates by cause-trend classification × sex × year (1899–2024; this paper uses 1950 on) |
| Age-adjusted rates | Table 5.14: age-adjusted death rates for the same classification (2015 model population as standard; by sex; 31 years from 1950 to 2024) |
| Check | Table 5.11: the published ranking of causes (by the classification used for ranking) |
| Classification history | Classification table 4, history of the cause-trend classification (PDF) |
3. Data and checks
Calculation 3.1 The retrieved files were fixed by SHA-256, and the following were checked.
| Check | Result |
|---|---|
| Years | Table 5.12: 75 years from 1950; Table 5.14: 31 years |
| Consistency within Table 5.12 | The population implied by deaths ÷ rate differs across causes with rates of 50 or more by at most 0.00119 (rounding) |
| Match with the published ranking | This paper's leading cause matches Table 5.11's leader in all 75 years since 1950 |
| Classification history | Classification table 4 has the row "(10th revision) Heisei 7 to Heisei 28" and notes for "from Heisei 29 (2017)" and "from Heisei 7 (1995)" |
Observation 3.2: According to classification table 4, the 10th revision (ICD-10) was used from Heisei 7 (1995) to Heisei 28 (2016), and the 2013 version from Heisei 29 (2017). The years 1995 and 2017, where this paper measures steps, are these switch-over years.
4. Changes in the crude-rate ranking
Calculation 4.1 Years when the leading places changed by crude rate (both sexes)
| Place | Year of change and the cause that entered |
|---|---|
| 1st | 1950 tuberculosis, 1951 cerebrovascular, 1981 cancer |
| 2nd | 1950 cerebrovascular, 1951 tuberculosis, 1953 cancer, 1981 cerebrovascular, 1985 heart disease, 1995 cerebrovascular, 1997 heart disease |
| 3rd | 1950 cancer, 1953 old age, 1958 heart disease, 1985 cerebrovascular, 1995 heart disease, 1997 cerebrovascular, 2011 pneumonia, 2017 cerebrovascular, 2018 old age |
Calculation 4.2 Top five by crude rate (both sexes, per 100,000)
| Year | Top five |
|---|---|
| 1950 | tuberculosis 146.4, cerebrovascular 127.1, cancer 77.4, old age 70.2, pneumonia 65.1 |
| 1980 | cerebrovascular 139.5, cancer 139.1, heart disease 106.2, pneumonia 28.4, old age 27.6 |
| 2000 | cancer 235.2, heart disease 116.8, cerebrovascular 105.5, pneumonia 69.2, accidents 31.4 |
| 2024 | cancer 319.3, heart disease 188.2, old age 172.0, cerebrovascular 85.5, pneumonia 66.6 |
Observation 4.3: The leader changed from tuberculosis (1950) to cerebrovascular disease (from 1951) and cancer (from 1981). Second and third place swapped between cerebrovascular and heart disease in 1995 and swapped back in 1997, and third place moved to pneumonia in 2011, cerebrovascular disease in 2017 and old age in 2018.
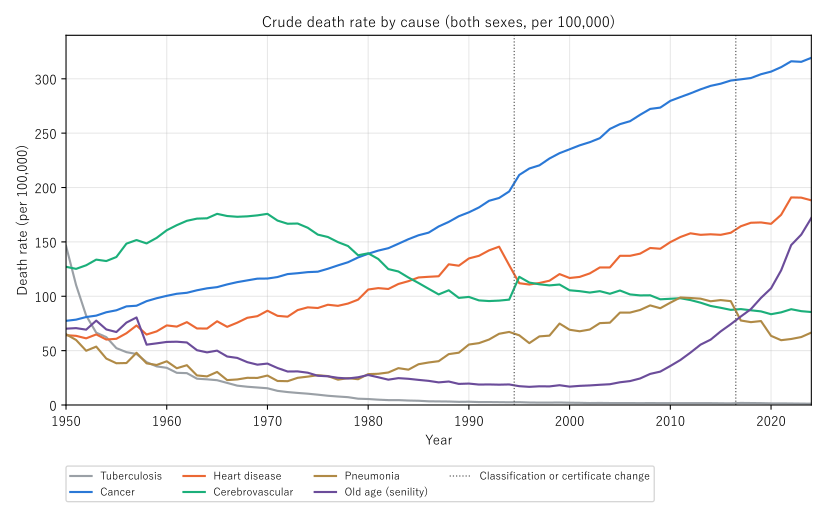
Figure 1: Crude rates of six main causes (1950–2024). Dotted lines mark years when the classification or death certificate changed (between 1994 and 1995 and between 2016 and 2017). Heart disease (red) falls around 1995 while cerebrovascular disease (green) rises in the same year; pneumonia (brown) falls in 2017.
5. Core — with age adjustment, the 1950 leader changes
Calculation 5.1 Top causes by crude and age-adjusted rates (per 100,000; standard: 2015 model population)
| Sex, year | Top by crude rate | Top by age-adjusted rate |
|---|---|---|
| Men 1950 | tuberculosis 159.5, cerebrovascular 127.9, cancer 80.1, pneumonia 68.8, heart disease 64.0 | old age 1076.9, cerebrovascular 724.1, heart disease 269.5, cancer 266.3, tuberculosis 196.1 |
| Men 1980 | cancer 163.5, cerebrovascular 142.7, heart disease 112.1, accidents 37.0, pneumonia 32.6 | cerebrovascular 597.0, heart disease 488.0, cancer 452.8, old age 216.7, pneumonia 172.9 |
| Men 2024 | cancer 379.4, heart disease 190.6, old age 100.6, cerebrovascular 87.6, pneumonia 79.6 | cancer 372.6, heart disease 195.0, old age 113.0, cerebrovascular 87.7, pneumonia 82.4 |
| Women 1950 | tuberculosis 133.7, cerebrovascular 126.3, old age 82.4, cancer 74.9, heart disease 64.3 | old age 937.0, cerebrovascular 559.3, heart disease 215.0, cancer 199.6, tuberculosis 129.2 |
| Women 1980 | cerebrovascular 136.4, cancer 115.5, heart disease 100.5, old age 35.4, pneumonia 24.4 | cerebrovascular 455.2, heart disease 357.3, cancer 241.7, old age 224.8, pneumonia 94.4 |
| Women 2024 | cancer 262.5, old age 239.5, heart disease 185.9, cerebrovascular 83.5, pneumonia 54.4 | cancer 193.0, old age 116.0, heart disease 107.1, cerebrovascular 51.2, pneumonia 30.6 |
Observation 5.2: In 1950 the crude-rate leader was tuberculosis for both sexes, but the age-adjusted leader was old age for both sexes (men 1076.9, women 937.0), with tuberculosis fifth. The 1950 population leaned toward younger ages than the 2015 population, so old age and cerebrovascular disease, common at old ages, looked low in crude rates. Even for all causes, men in 1950 had a crude rate of 1144.5 against an age-adjusted rate of 4220.0.
Observation 5.3: In 2024 the top six are in the same order by crude and age-adjusted rates for both sexes. The sizes differ, though: crude ÷ age-adjusted is 1.02 for men's cancer but 2.06 for women's old age and 1.78 for women's pneumonia (women's all-cause crude rate 1270.4, age-adjusted 775.3).
Observation 5.4: In 1980, cancer led men's crude rates (163.5), but by age-adjusted rates the order was cerebrovascular disease (597.0), heart disease (488.0), cancer (452.8). "Cancer became the leading cause in 1981" is a statement about crude rates.
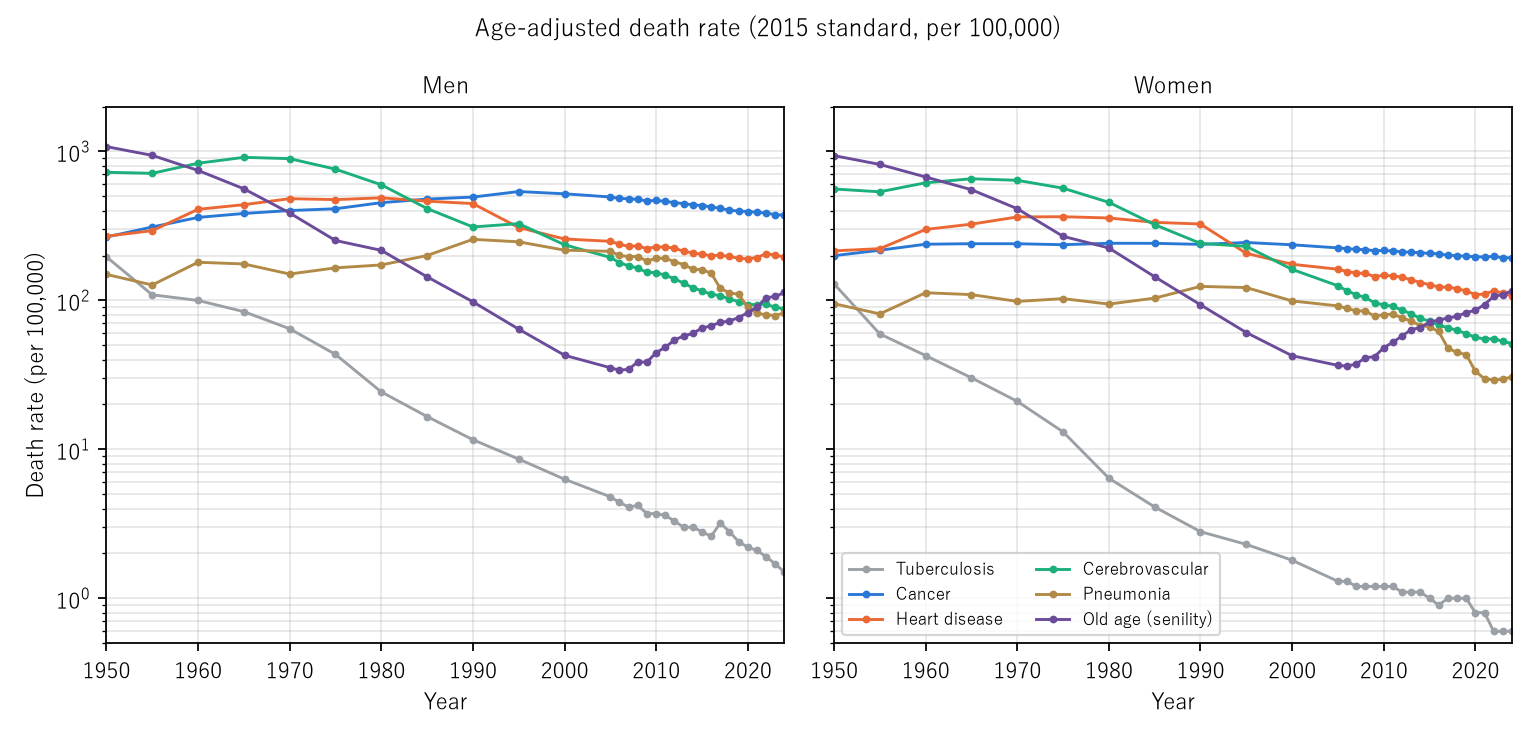
Figure 2: Age-adjusted rates of six main causes (logarithmic scale); men on the left, women on the right. In the 1950s purple (old age) and green (cerebrovascular) are on top, and grey (tuberculosis) falls steeply early on.
6. Did cancer death rates rise or fall?
Calculation 6.1 Cancer rates, 1995 to 2024 (per 100,000)
| Sex | Crude rate | Age-adjusted rate |
|---|---|---|
| Men | 262.0 → 379.4 (1.448 times) | 537.7 → 372.6 (0.693 times) |
| Women | 163.1 → 262.5 (1.609 times) | 244.6 → 193.0 (0.789 times) |
Observation 6.2: Cancer's crude rate rose for both sexes while its age-adjusted rate fell for both. The directions are opposite. Because the age-adjusted rate fell, what pushed the crude rate up was the movement in age composition; compared on the same age shape, the rate of dying of cancer fell. This is the cancer form of the difference between movements in age composition and in age-specific rates that M001 showed for all-cause mortality.
7. Steps at classification changes
Calculation 7.1 Proportional change from the previous year (both sexes, crude rate) and its ratio to the usual size of yearly change (median)
| Cause, years | Rate | Change | Usual yearly change | Times |
|---|---|---|---|---|
| Heart disease 1993→1994 | 145.6 → 128.6 | −0.117 | 0.024 (20 years in 1984–2005) | 4.9 |
| Heart disease 1994→1995 | 128.6 → 112.0 | −0.129 | 0.024 | 5.5 |
| Cerebrovascular 1994→1995 | 96.9 → 117.9 | +0.217 | 0.026 | 8.3 |
| Pneumonia 2016→2017 | 95.5 → 77.7 | −0.186 | 0.026 (10 years in 2007–2016) | 7.1 |
| Old age 2016→2017 | 74.3 → 81.4 | +0.096 | 0.139 | 0.7 |
| Cancer 2016→2017 | 298.4 → 299.5 | +0.004 | 0.012 | 0.3 |
Observation 7.2: The falls in heart disease in 1994 and 1995 (4.9 and 5.5 times the usual yearly change), the rise in cerebrovascular disease in 1995 (8.3 times) and the fall in pneumonia in 2017 (7.1 times) are too large to be usual yearly movements. The table note attributes the 1994 fall in heart disease to advance notice of a caution on the death certificate; 1995 and 2017 are years when the classification switched. The 2017 movements of old age (0.7 times) and cancer (0.3 times) stay within usual years.
Observation 7.3: In age-adjusted rates too, heart disease fell to 0.691 times for men and 0.636 for women from 1990 to 1995, and pneumonia to 0.788 times for men from 2016 to 2017; the steps do not vanish with age adjustment. The 1995 swap in second and third place and the 2017 change in third place happened in these step years.
8. Limitations
- That a step is due to a classification or certificate change can be said only as far as the table notes and the timing coincide.
- The cause-trend classification is meant for comparison across revisions, but a cause with the same name may not have the same content (Table 5.12 note: "complete agreement of content cannot be expected in comparisons across years").
- This paper's 15 causes differ from the classification of the published ranking (aspiration pneumonia, COVID-19 and others are not counted separately); only the leading cause was matched.
- Age-adjusted rates depend on the choice of standard population (the 2015 model population).
- 1947–1972 excludes Okinawa (table note).
- Why rates moved is not examined.
- It is not one person's outlook.
Conclusion
In 1950 the leading cause of death was tuberculosis, but adjusted to today's age shape the leader was old age and tuberculosis was fifth. Cancer's crude rate rose from 1995 to 2024 while its age-adjusted rate fell. And heart disease, cerebrovascular disease and pneumonia showed steps 4.9 to 8.3 times the usual yearly change in years when the classification or death certificate changed, with some changes in second and third place happening in those years.
Two things separate them — age composition and classification.
When you hear "the ranking of causes of death changed", check whether age-specific rates moved, the population's age shape moved, or the way causes are counted changed.
Data and reproduction
| Data | Ministry of Health, Labour and Welfare, Vital Statistics 2024 (final data), Volume 1, Tables 5.11, 5.12 and 5.14, and classification table 4, history of the cause-trend classification (e-Stat, accessed 26 September 2026) |
| Terms of use | e-Stat follows the Public Data License (Version 2.0). This paper's rankings and steps were produced by processing these and are not figures produced by the government |
| Scope | Japan, both sexes and by sex, 1950–2024, 15 causes of the cause-trend classification |
| Verification | 検算/M020.py (--zu also writes the figures). Every number in the text is taken from 検算/M020_output.txt |
| Raw data | The 4 retrieved files and SOURCES.md (URLs, retrieval dates, SHA-256, terms of use, how the calculation is set up) in data/ |
| Figures | 図/M020_zu1, 図/M020_zu2 (png, svg, English versions) |
References
- Ministry of Health, Labour and Welfare. Vital Statistics 2024 (final data), Volume 1, Tables 5.11, 5.12 and 5.14, and classification table 4: history of the cause-trend classification (in Japanese). e-Stat (accessed 26 September 2026). https://www.e-stat.go.jp/
- Yamagishi, Y. (2026). "The Death Rate Rose" Names Two Movements at Once, the Age Composition and the Age-Specific Rates [M001]. Zenodo. https://doi.org/10.5281/zenodo.22963112
Reference
Yamagishi, Y. (2026). In 1950 the Leading Cause of Death Was Tuberculosis, but Adjusted to Today's Age Structure It Is Old Age, and Tuberculosis Is Fifth [M020]. Zenodo.
DOI: 10.5281/zenodo.22968057
YOI: https://www.yamagishiyuuki.com/yoi/M020
ORCID: 0009-0006-8587-3450
PDF (English) · PDF (Japanese) · Date proof of the English PDF (OpenTimestamps .ots) · SHA256SUMS
The record page for this paper (in Japanese, with the PDFs in each language and the date proof): YOI M020. This paper is a preprint and has not been peer reviewed.